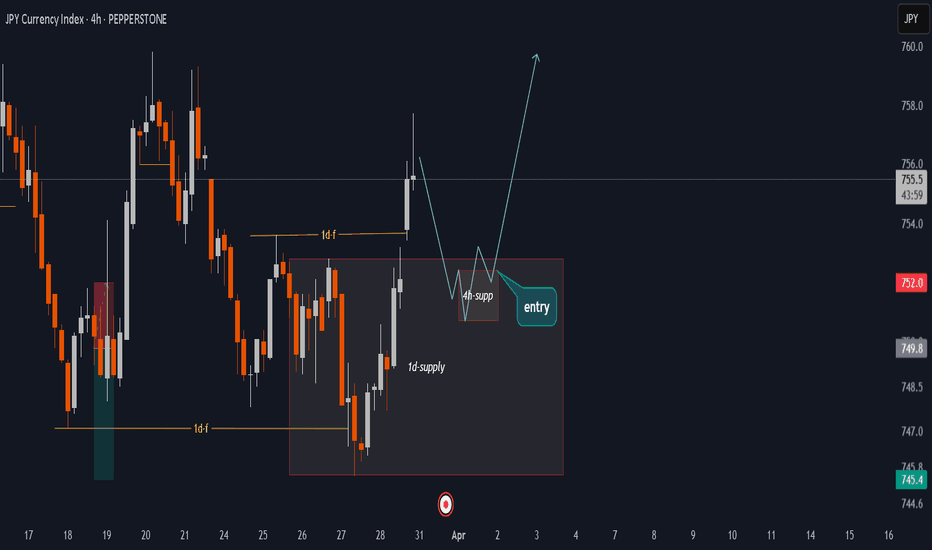
JPY INDEX PROJECTION Dear friends and followers .. I present to you my strategy and analysis on JPY index for trading JPY pairs... Consider that zone form your trading decision either buy or sell. Good luck all...by OluminePublished 222
JPY Index Reversal – FVG Tap and Potential Upside Move?The JPY Index has tapped into a high-probability Fair Value Gap (FVG) after taking out sell-side liquidity. This price action suggests a strong move to the upside may be on the horizon, with price moving from Internal Range Liquidity (IRL) to External Range Liquidity (ERL). With the FVG acting as a key reversal zone, targets are set at 747.5, 771.1, and the higher buy-side liquidity at 788.3. DYORLongby INSIDER_INTELPublished 662
JPY Surge Ahead Could Trigger a Major Drop in GBB/JPYThe JPY Currency Index (JPYX) is approaching a key demand zone, highlighted in blue on the chart around the 748 level. After a sustained downtrend, this area is likely to serve as support, with a potential bullish reversal indicated by the projected price movement. A bounce off this zone could trigger a strong upward move, targeting higher levels. However, if the support breaks, further downside momentum may occur. Watching for confirmation of reversal patterns is crucial before entering any long positions. The zone presents a high-probability area for buyers to step in, but patience is required for confirmation. If the JPYX (Japanese Yen Index) bounces from the current demand zone and strengthens, we can expect the Japanese yen to appreciate. This would likely lead to a bearish impact on GBP/JPY, as a stronger yen typically causes a decrease in GBP/JPY price. The yen’s strength would outweigh the British pound, pushing the pair lower. On the other hand, if the JPYX breaks through this support level and weakens further, the yen would depreciate, driving GBP/JPY higher as the pound strengthens relative to the yen. Key points to watch: A JPYX bounce could trigger a GBP/JPY drop. A JPYX decline might result in a GBP/JPY rise. The exact impact will depend on the strength of the yen's reaction and how the pound performs during this period.Longby TopGBanksPublished 2
JPY index long!as we see downtrend on day frame time been break out with nice flag bullish pattern that's why I'm looking for see all pairs ends with JPY Longby ARCHREXPublished 2
JPYX - ShortPossible rejection area forming bearish cypher lets see good sign for yen pairs Shortby aahrawkyUpdated 1
Is the Yen Set for a Comeback? Analyzing EUR/JPY,GBP/JPY,CHF/JPYThe Japanese Yen (JPY) has been one of the weakest currencies in the past three years, with some pairs experiencing a significant 70-80% devaluation, particularly against CHF, EUR, and GBP (CHF/JPY, EUR/JPY, GBP/JPY). However, since reaching a low in early July, the JPY has shown signs of reversing. When looking at the JPY Index (see posted chart), we can observe that the price recently broke above the falling resistance line within its downward channel. After initially stalling at resistance, as marked by a bearish Pin Bar, the subsequent fall lacked continuation and instead reversed upwards. Currently, the JPY is on the verge of a significant breakout. If this breakout occurs, the technical target for the next mid-term move is around 860, which would represent a potential 10% appreciation for the Yen. Key JPY Crosses to Watch: EUR/JPY: After breaking out of its rising channel, EUR/JPY confirmed the breakout as valid and has begun a downward trajectory. Yesterday's strong bearish engulfing candlestick suggests that further downside is highly likely. A possible first target could be the 150 zone. GBP/JPY: GBP/JPY attempted to recover above its broken support but failed to hold those gains. Like EUR/JPY, GBP/JPY also printed a strong bearish engulfing pattern yesterday. This suggests a lower high may now be in place, with potential downside targets around 178.50, followed by the 170 zone, which seems a strong possibility. CHF/JPY: www.tradingview.com CHF/JPY has seen one of the largest devaluations of the Yen, amounting to almost 80%. The top in this pair was marked by a head & shoulders pattern, and the price is currently sitting at the neckline. A break below this level seems imminent, with 160 being a likely target. If the correction deepens, we could even see a move toward the 151 level. Conclusion: These are long-term predictions, and I anticipate these movements to materialize by the end of the year. P.S: Stay updated on these charts as conditions evolve. These predictions are based on technical analysis and market patterns for long term, so monitoring changes is crucial. Best Of Luck! Mihai Iacob Longby Mihai_IacobPublished 7
JPY Currency Index 4H Analysis: Potential Consolidation and Key The chart shows the JPY Currency Index on a 4-hour timeframe, where the market is currently trading around the 766.9 level. Based on the price action, there appears to be a clear formation of potential consolidation after a sharp move upward. Key Observations: Uptrend Momentum: The index previously experienced a strong uptrend, pushing the price to the 794.1 level, as indicated by the steep price increase. Support and Resistance Levels: Support: The area around 740 acts as a significant support zone, where price is likely to test if the index continues its correction phase. Resistance: The zone around 780 is a key resistance level that the index needs to break to continue its upward momentum. EMA Crossover: The moving averages show bullish momentum, though some consolidation and pullback are expected before further upward movement. Potential Consolidation: The projected pattern on the chart suggests the possibility of a sideways consolidation between 740 and 780 before any significant breakout. This could lead to a pullback toward the 740 support level before another bullish push towards the resistance at 780. RSI Indicator: The RSI (Relative Strength Index) shows mixed signals with both bull and bear indications, suggesting that while the market has had strong bullish pressure, the current overbought condition might result in short-term corrections. Expected Price Movement: The chart outlines a potential scenario where the price consolidates within the 740-780 range. A break above the 780 resistance could lead to a new bullish wave, possibly revisiting the previous high near 794. However, if the price breaks below the 740 support, a deeper retracement is possible. This setup presents a potential range-bound trade for short-term traders, with clear breakouts or breakdowns providing potential trade signals.by NigoukPublished 111
Mallicast Team's Analysis of the JPY Index:The Mallicast team remains optimistic about the upward trend of the Japanese Yen (JPY) index. The strengthening of the yen could lead to a weakening of the US Dollar Index (DXY), as a stronger yen is usually associated with increased demand for this currency and a reduced inclination to buy dollars. This scenario could result in significant changes in global financial and currency markets, especially as investors seek safer assets during periods of market volatility. Given the recent economic and geopolitical developments, the future movements of the JPY against other currencies will continue to be closely monitored by traders and market analysts. Longby kiyandokhtkarimiPublished 3
Mallicast Team's Analysis of the JPY Index:The Mallicast team remains optimistic about the upward trend of the Japanese Yen (JPY) index. The strengthening of the yen could lead to a weakening of the US Dollar Index (DXY), as a stronger yen is usually associated with increased demand for this currency and a reduced inclination to buy dollars. This scenario could result in significant changes in global financial and currency markets, especially as investors seek safer assets during periods of market volatility. Given the recent economic and geopolitical developments, the future movements of the JPY against other currencies will continue to be closely monitored by traders and market analysts. Longby mallicastPublished 4
JPY The JPY index, which is a key indicator for analyzing the durable goods market and even the U.S. dollar, has started its upward rally in recent weeks. It may enter a corrective phase and subsequently break its long-term trend. We have predicted the highest price target at 793.4 and the lowest price during the correction phase at 736.8.by kiyandokhtkarimiPublished 0
FLAG break down then Week 50% RV touch TPFLAG break down then tp line Week 50% RV touch TPShortby backfrominthefuturePublished 0
What is going on with JPY?!?!Hello traders! for those who trade fundamentals can you explain to me what is going on with JPY I've been seeing a lot of triangle/flag pattern on most of the pairs with JPY. Will we be seeing bullish market on JPY? USDJPY: EURJPY: GBPJPY: AUDJPY: CADJPY: NZDJPY: We have 6 trades that look the same, it is clear that there is a pattern here no doubts but what could this mean for our Japanese Yen??Longby Linkhive001Published 111
The JPY is ready to rise from a breakout of the longterm trendThe JPY technically is rising on increased momentum and during periods of uncertainty it is Safe Haven Status: The yen is often considered a safe-haven currency. During times of global economic uncertainty or geopolitical tension, investors tend to flock to safe-haven assets, including the JPY. If there are current or anticipated global risks, this could drive demand for the yen. Monetary Policy Divergence: If the Bank of Japan (BoJ) is expected to tighten its monetary policy while other major central banks are either maintaining or easing their policies, the yen could strengthen. For example, if inflation in Japan is rising faster than expected, the BoJ might signal or implement interest rate hikes or other tightening measures.Longby lawmuicPublished 0
Yen index long viewThe yen index is at a key point testing the EMA 50 daily moving average. If we manage to get his support, the yen could start a longer-term recovery.Longby Aleksin_AleksandarPublished 2
JPY INDEX ??Im looking for reversal of Yen. But i need more confirmation. As at now, Im looking to this structure. Trade carefully.Longby ewtradersbhPublished 3
JPY index on bearish Wait for pull back on jpy index then BUY any JPY pairs .. Don't be left out on this ..the trend line indicates what JPY pairs will do Good luck Shortby OluminePublished 2
JPY index buy ideaJPY yen is subjected to flex muscle for bullish for the last time before selling off. We expect yen to go bullish from this point.. let wait for BULLISH confirmation candle on daily time frame like engulfing or hammer candle.Longby OluminePublished 0
JPY Index next week outlookThe Japanese currency continuesly doping down From march of 2020. Now in 4H timeframe already Rebound from 704.1 level. But still not tread breakout confirmation. Within next week I expect all JPY pairs will fall down to retest the above support area. However still have FVG Between 718 - 120 levels. by chamitha45Published 2
JPY index short viewSince the beginning of the year, the Japanese index in a bearish trend. The main resistance and trend indicators are the EMA 50-daily (white line) and the EMA 20-daily (purple line). The interest rate hike by the Bank of Japan did not bear fruit in strengthening the Japanese yen. The picture is still very bearish and we can expect a further pullback to the April low at 704.0.Shortby Aleksin_AleksandarPublished 2
YEN come back strongerI see a possibility that Yen will come back stronger this year. So i guess XXXJPY will drop signicantly . Just my point of view.Longby ewtradersbhUpdated 1
JPY index bullish move preparationJPY index pair is preparing for short bullish move before long fall bearish again... Almost set to go BULLISH Longby OluminePublished 1
JPYXThe JPYBasket (“Yen Index”) is a Japanese Yen benchmark and is designed to reflect the change in value of the JPY against a basket of major world currencies.Longby HavalMamarPublished 4