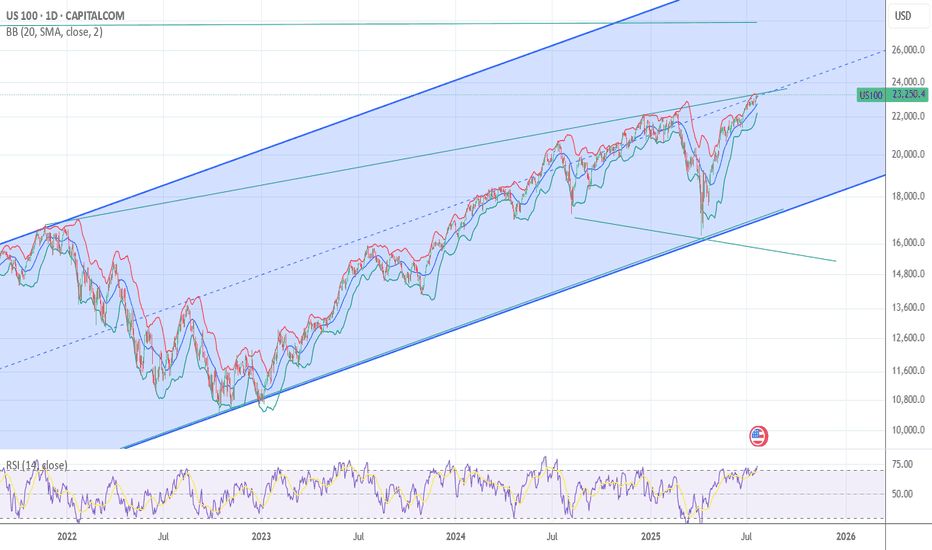
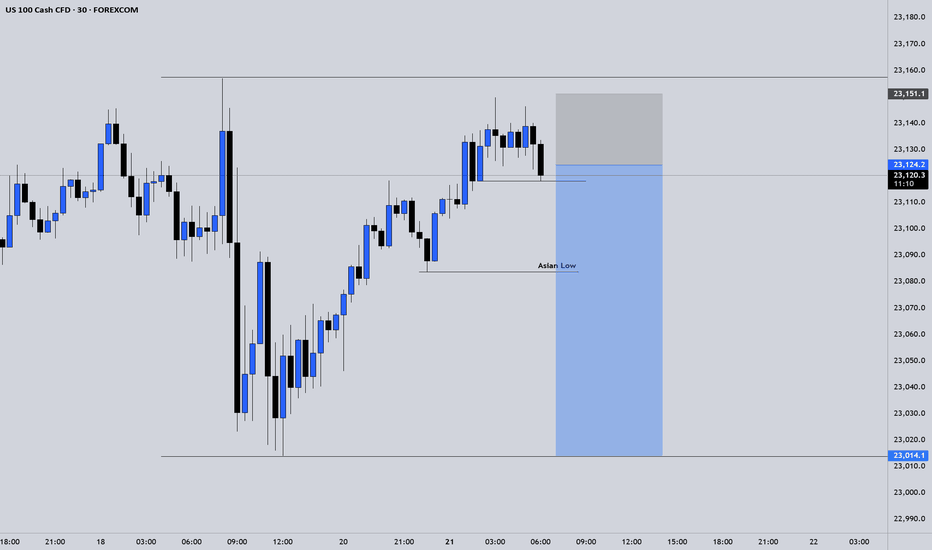
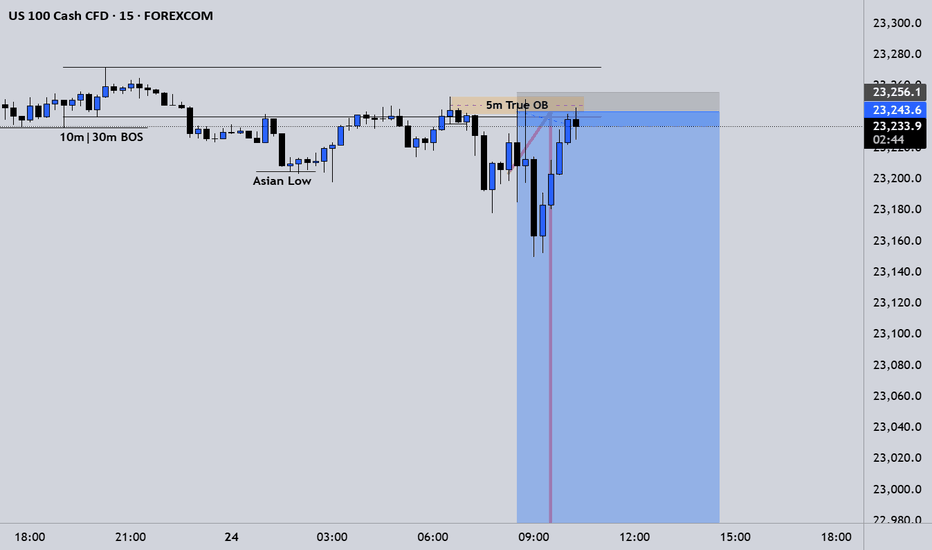
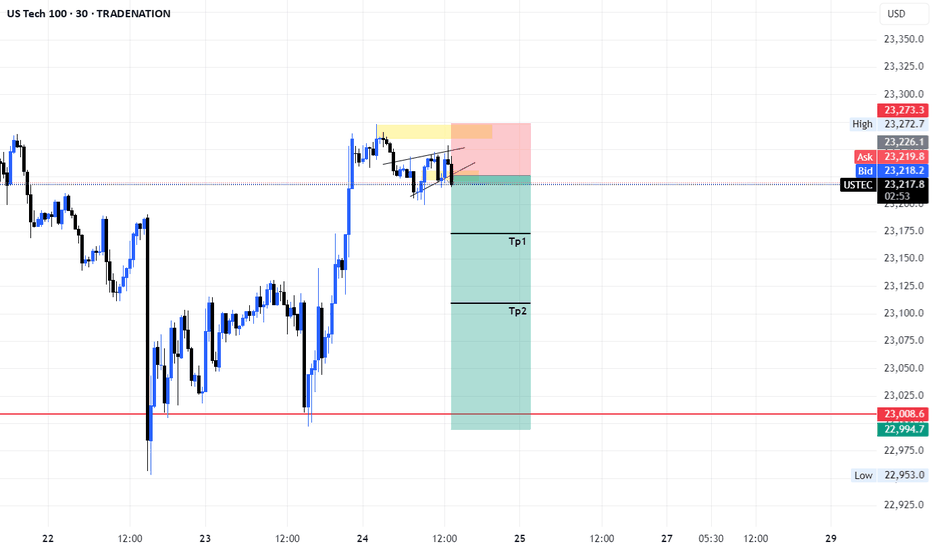
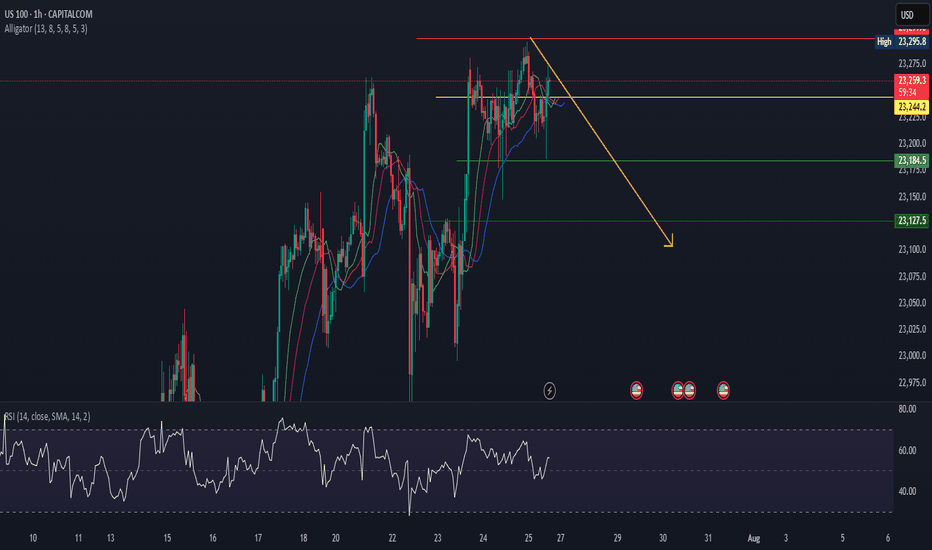
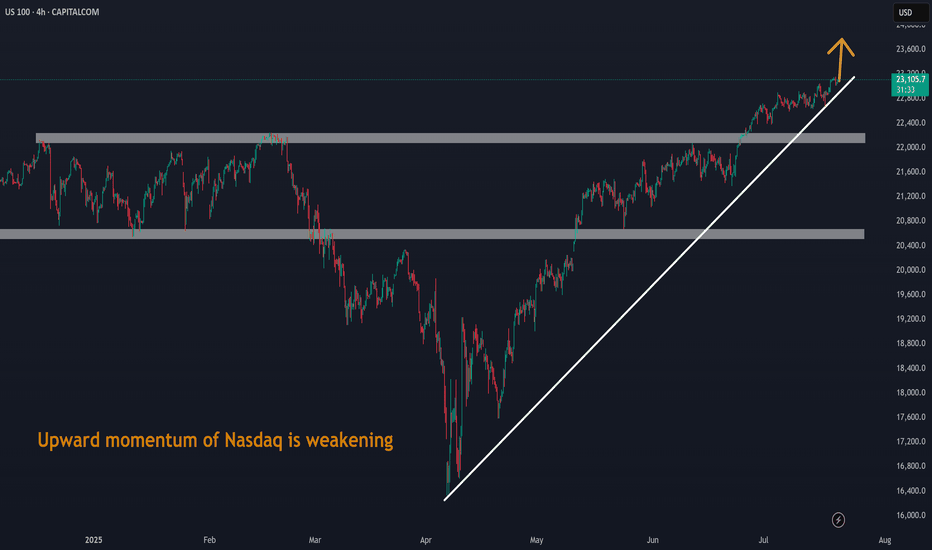
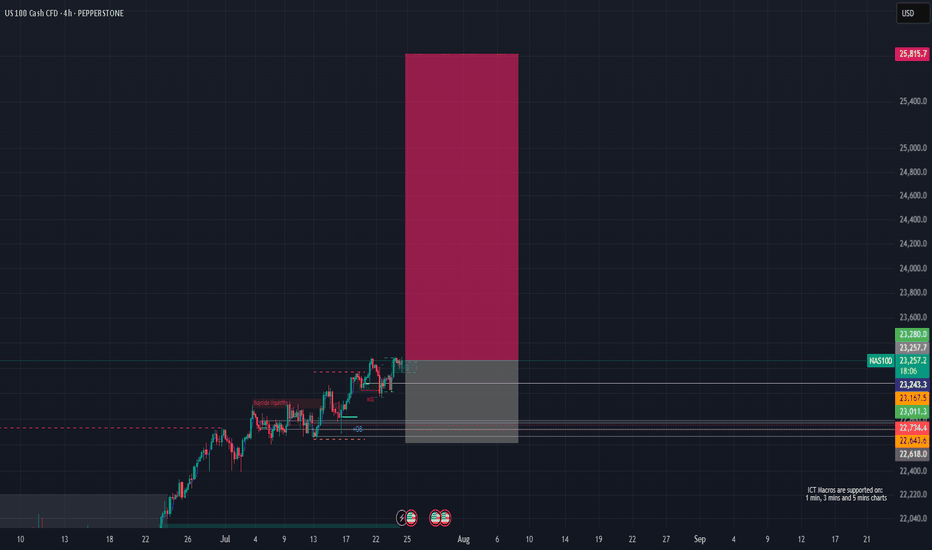
NASDAQ 100 outlook and the 90-day tariff pauseThe US has paused the highest tariffs for 90 days, but markets remain under pressure from global trade tensions, and the Nasdaq 100 remains bearish. So what are the levels we need to watch next?
This content is not directed to residents of the EU or UK. Any opinions, news, research, analyses, prices or other information contained on this website is provided as general market commentary and does not constitute investment advice. ThinkMarkets will not accept liability for any loss or damage including, without limitation, to any loss of profit which may arise directly or indirectly from use of or reliance on such information
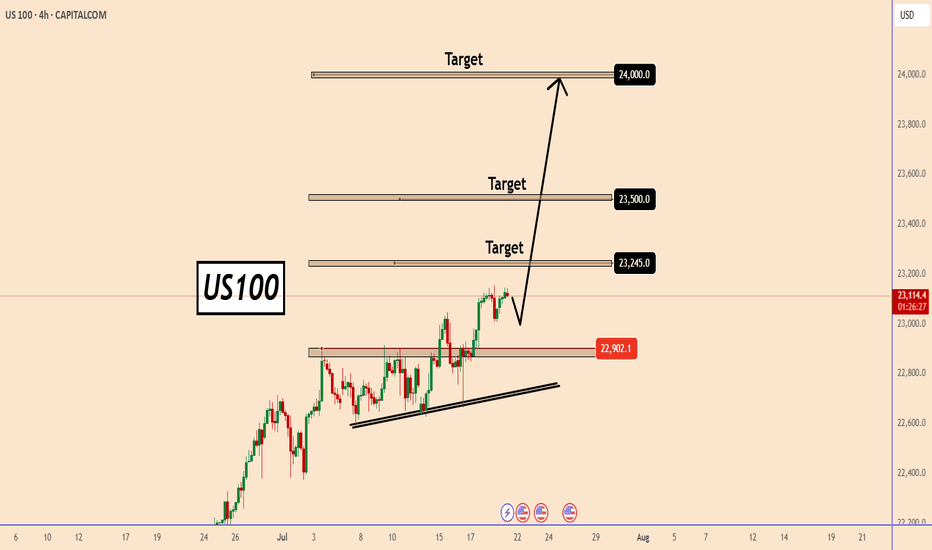
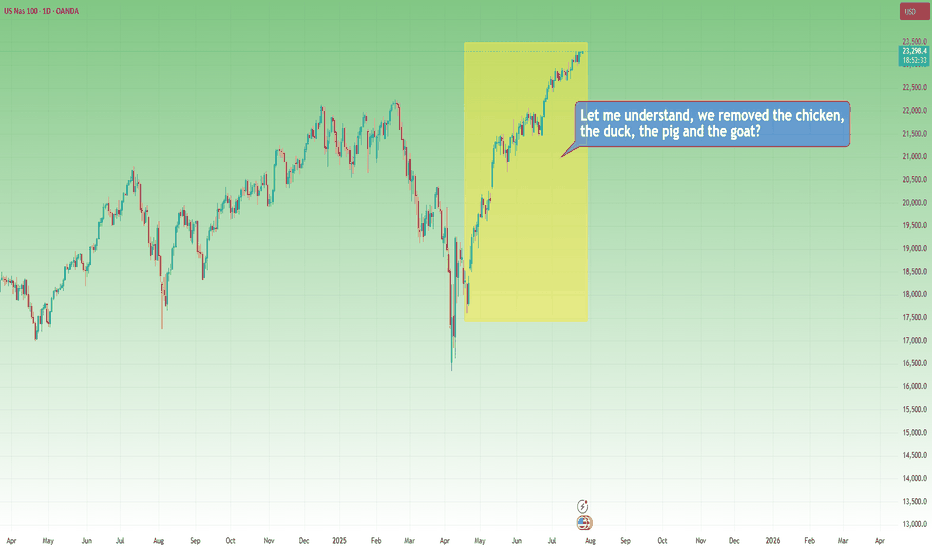
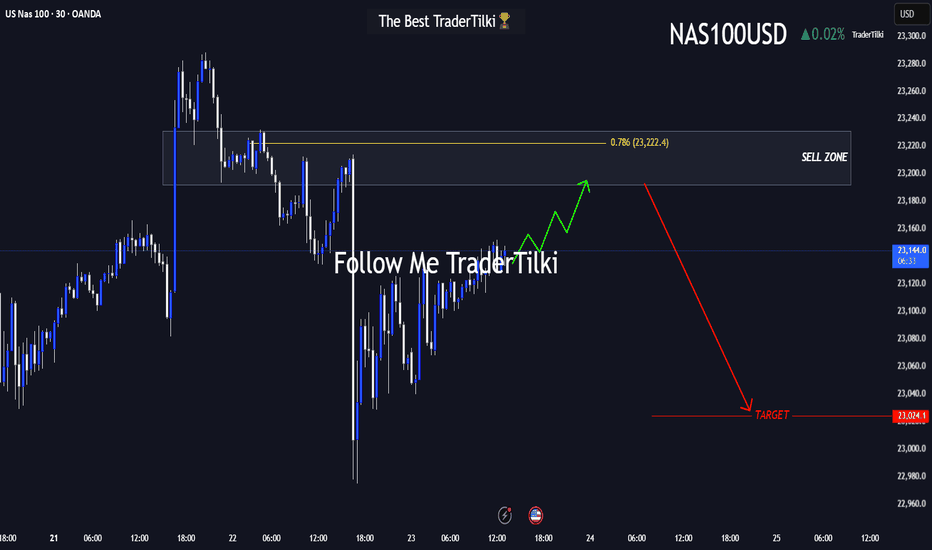
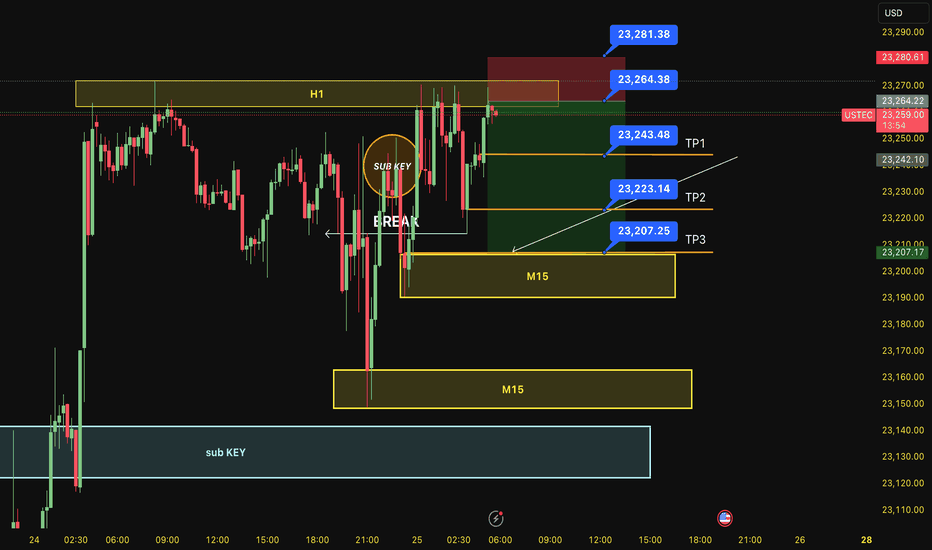
NAS100 trade ideas
US100 - Lots of opportunities unfoldingChart Overview:
This analysis focuses on the US 100 (NAS100) index, sourced from CAPITAL.COM . The chart highlights critical price levels, Fair Value Gaps (FVGs) , and a Buy side liquidity (BSL) , offering actionable insights for traders.
Key Observations:
1. Price Action & Structure:
- The index has shown significant volatility, with a clear Break of Structure (BSL) indicating a potential shift in market sentiment.
- The price is currently navigating between key support and resistance zones , marked by horizontal levels.
2. Fair Value Gaps (FVGs):
- Two prominent FVGs are visible on the chart, representing areas where price may revisit to fill imbalances. These zones often act as magnet levels for price retracements.
- Traders should monitor these FVGs for potential entry or exit opportunities , depending on price reaction.
3. Critical Price Levels:
- Resistance Zones:
- 20,250.0 : A major psychological barrier.
- 19,750.0 - 20,000.0 : Intermediate resistance cluster.
- Support Zones:
- 17,000.0 - 17,250.0 : Strong historical support.
- 16,000.0 : A pivotal level for long-term bias.
Trading Strategy:
- Bullish Scenario: A break above 20,250.0 could signal further upside, targeting 20,500.0 and beyond.
- Bearish Scenario: A drop below 17,000.0 may confirm a deeper correction, with 16,250.0 - 16,000.0 as the next target.
- FVGs as Confluences: Use the identified FVGs alongside volume and momentum indicators to refine entries.
Timeframe & Validity:
This analysis is based on the daily timeframe (Apr 19, 2025) and remains valid until key levels are breached or new structures form.
Final Notes:
Always pair this analysis with risk management (stop-loss, position sizing) and confirm with additional indicators (RSI, MACD, volume). The market may fill FVGs before continuing its trend.
Like, follow, and comment if you found this useful! Happy trading!
US 100 - At a Critical Crossroads The US 100 index shows intriguing price action as it navigates key technical levels. Currently trading at 18,967.2 , the market has formed a clear double top pattern at the resistance zone, suggesting potential exhaustion in the uptrend.
Key Technical Observations:
The chart reveals strong resistance near recent highs around 19,024.3 , with price struggling to break through this ceiling. Below current levels, we spot a double bottom formation that previously provided support, creating an interesting tension between these patterns.
Notable price levels include:
- Resistance: 19,024.3 (double top confirmation)
- Support: 18,961.7 (recent swing low)
- Critical zone: The weakened gap that remains to be filled below current prices
Market Dynamics:
The minimal +0.02% change indicates indecision at these levels. The presence of liquidity pools both above and below suggests potential for volatility when either side gives way.
Trading Considerations:
A break above the double top resistance could signal continuation of the uptrend, while failure to hold current levels may see price test lower supports to fill the gap. The tight range between 18,961.7 and 19,024.3 suggests an impending volatility expansion.
The market appears to be at an inflection point where the next directional move could be significant. Traders should watch for either a confirmed breakout above resistance or breakdown below support before committing to positions.
Final Note: This technical setup presents clear risk/reward opportunities, but requires confirmation before acting. The double top pattern would only be validated by a break below the interim support levels.
Disclaimer: Market conditions can change rapidly. This analysis represents one interpretation of current price action and should be verified with additional indicators. Always use proper risk management.
Mastering Volatile Markets: Why Reducing Position Size is Key █ Mastering Volatile Markets Part 1: Why Reducing Position Size is Key
Trading is always challenging, but how do you navigate today's markets? That's a whole different level. Today, we'll move away from the usual "Trump's tariffs are horrendous" discussions. We'll instead focus on how experienced traders profit in the current volatile market.
Right now, we're seeing extreme volatility across many assets. It's not uncommon for markets to move 3% to 10% in a single day , and for indices like NAS100 (Nasdaq), intraday swings of 300 to 500 points can happen in just 5 to 30 minutes.
This can seem like bad news, but as Warren Buffet said in 2008, "In short, bad news is an investor's best friend."
Volatile markets can shake even experienced traders — but they don’t have to. With 16 years of trading experience , we’ll show you exactly how to approach conditions like these with confidence and clarity.
█ Reducing position size is the key to surviving volatility:
The most critical adjustment in a volatile market is reducing position size.
Why? Because when the market moves faster and with bigger swings, your potential risk per trade automatically increases. The key is to keep your d ollar risk the same — even when volatility is exploding.
⚪ Let's take a look at how position size changes when markets change:
2 Weeks Ago — Stable Market:
NAS100 average move per trade = 50 to 100 points
Risk per trade = 100 points = $500 risk (for example)
Position Size = 5 contracts
Today — Volatile Market:
NAS100 average move per trade = 300 to 500 points
To maintain the same $500 risk per trade → Position Size = 1 contract
⚪ The Benefit:
With a smaller position, you can still earn the same profit because the price is moving much more. At the same time, your risk stays controlled , even in these wild markets.
This is exactly how professional traders survive and thrive in volatile conditions — by adjusting to what the market is giving them.
⚪ What Happens If You Don't Reduce Size?
Let's say you keep the same position size as in stable markets, but now the market moves 300-500 points against you instead of 50-100. Here's how it plays out (example):
In Stable Markets (NAS100 average move: 50-100 points):
Position Size: 5 contracts
Risk per contract: $10 per point
Risk per trade: 100 points x $10 x 5 contracts = $5,000 risk per trade
In Volatile Markets (NAS100 average move: 300-500 points):
Position Size: 5 contracts (unchanged)
Risk per contract: $10 per point
Risk per trade: 500 points x $10 x 5 contracts = $25,000 risk per trade
Without reducing position size, your risk increases dramatically as the market moves wildly. As a result, your losses will skyrocket when the market moves against you.
█ Summary:
Huge volatility = Smaller position size
Same risk = Same profit potential
Trade smarter, not bigger
This is rule number one when navigating wild markets like the ones we have today.
█ What's Coming Next in the Series:
Part 2: Liquidity Is the Silent Killer
Part 3: Patience Over FOMO
Part 4: Trend Is Your Best Friend
Stay tuned for the next part — and remember, adapting to volatility isn't just about managing risk, it's about mastering the market!
-----------------
Disclaimer
The content provided in my scripts, indicators, ideas, algorithms, and systems is for educational and informational purposes only. It does not constitute financial advice, investment recommendations, or a solicitation to buy or sell any financial instruments. I will not accept liability for any loss or damage, including without limitation any loss of profit, which may arise directly or indirectly from the use of or reliance on such information.
All investments involve risk, and the past performance of a security, industry, sector, market, financial product, trading strategy, backtest, or individual's trading does not guarantee future results or returns. Investors are fully responsible for any investment decisions they make. Such decisions should be based solely on an evaluation of their financial circumstances, investment objectives, risk tolerance, and liquidity needs.
Hanzo | Nas100 15 min / Time To Take A Seriouce Short 🆚 Nas100
The Path of Precision – Hanzo’s Market Strike
🔥 Key Levels & Breakout Strategy – 15M TF
🔥 Deep market insight – no random moves, only calculated execution.
☄️ Bearish Reversal – 19100 Zone
Price must break liquidity with high volume to confirm the move.
🩸 15M Time Frame Confluence
————
CHoCH & Liquidity Grab @ 16880
Key Level / Equal lows Formation - 16350
Strong Rejection from 16350 – The Ultimate Pivot
Strong Rejection from 16890 – The Ultimate Pivot
🔥 1H Time Frame Confirmation
Twin Wicks @ 16890 – Liquidity Engineered
Twin Wicks @ 17000 – Liquidity Engineered
☄️ 4H Historical Market Memory
——
💯 18 jan 2024 – Bearish Retest 16900
💯 11 jan 2024 – Bearish Retest 16900
💯 18 jan 2024 – Bullish Run After Break That level
👌 The Market Has Spoken – Are You Ready to Strike?
Likely Bullish Gap at Open Followed by a Sharp Drop📈 US100 – Likely Bullish Gap at Open Followed by a Sharp Drop 📉
On the 15-minute chart of the US100, we can see a corrective structure forming within an ascending channel, likely representing wave (B) of a larger correction. The price is currently near the top boundary of the channel, around 18,872.1.
🔍 Key Technical Highlights:
Clear prior bearish impulse.
Ongoing corrective move within a rising channel.
ABC correction forming inside the channel.
Potential rising wedge, suggesting bullish exhaustion.
📌 Main Hypothesis: I expect the market to open with a bullish gap, potentially reaching or briefly exceeding the 18,872.1 level, before starting a stronger downward move toward 17,411.8, which aligns with a key support zone and broader trendline confluence.
📊 Key Levels:
Resistance: 18,872.1 (ideal reversal area)
Target Support: 17,411.8
⚠️ Alternative Scenario: A strong breakout and consolidation above the channel could invalidate the bearish setup and suggest a continuation to the upside.
💡 Conclusion: This move would fit well within a broader corrective pattern, offering a technical pullback before any potential continuation. I’ll be watching the open closely for confirmation.
💼 Trade Idea:
🔹 Strategy: Short from resistance
🔹 Suggested Entry: 18,850 – 18,880 (potential gap zone and upper channel resistance)
🔹 Stop Loss: Above 18,920 (outside channel and above recent highs)
🔹 Take Profit: 17,500 – 17,450 (key support zone / technical target)
🔹 Risk/Reward Approximation: 1:4
🧠 Wait for price action confirmation (rejection, bearish engulfing candle, or intraday structure break before entering).
NAS100 Is Bullish! Buy!
Please, check our technical outlook for NAS100.
Time Frame: 1D
Current Trend: Bullish
Sentiment: Oversold (based on 7-period RSI)
Forecast: Bullish
The price is testing a key support 18,440.0.
Current market trend & oversold RSI makes me think that buyers will push the price. I will anticipate a bullish movement at least to 21,081.9 level.
P.S
The term oversold refers to a condition where an asset has traded lower in price and has the potential for a price bounce.
Overbought refers to market scenarios where the instrument is traded considerably higher than its fair value. Overvaluation is caused by market sentiments when there is positive news.
Disclosure: I am part of Trade Nation's Influencer program and receive a monthly fee for using their TradingView charts in my analysis.
Like and subscribe and comment my ideas if you enjoy them!
NAS100 - Potential TargetsDear Fellow Traders,
NASDAQ is in a sell-off phase - Extreme bearish behavior!
I have indicated a "Potential Reversal" Zone.
I am personally not looking for any potential entry at this stage.
(If I was scalping, I won't even consider buying - although they do look very inviting)
PLEASE HAVE A LOOK AT MY HIGH TIME FRAME ANALYSIS: Posted on March the 4th
Feel free to ask if anything is unclear.
Thank you for taking the time to study my analysis.
Nasdaq - This Is Still Not The End Yet!Nasdaq ( TVC:NDQ ) cannot resist bearish pressure:
Click chart above to see the detailed analysis👆🏻
Over the past three months, we saw such a harsh correction on the Nasdaq that a lot of people are freaking out entirely. However technicals already told us that something feels wrong and this is the result. If we see another -10% from here, buying the dip will most likely pay off.
Levels to watch: $16.000
Keep your long term vision,
Philip (BasicTrading)
NASDAQ Trump's 2 TRADE WARS are identical! What you need to knowNASDAQ (NDX) had a massive bullish reversal 1W candle last week as, despite a Lower Low opening, the intra-week rebound surpassed the opening of the previous week. The sell-off reached almost as low as the 1W MA200 (orange trend-line) , which has been the Support level of the late 2022 Inflation Crisis bottom and has been untouched for more than 2 year.
This is not the first time we see this pattern. In an interesting twist of events, we saw the exact same formation during Trump's 1st Trade War, which bottomed on the week of December 24 2018, near the 1W MA200 as well and exactly on the 0.382 Fibonacci retracement level from the Top.
The similarities don't stop there as both Trade War periods were manifested within Megaphone patterns. Their sell-off/ Bearish Leg was -25% (now) and -23% (2018) respectively, while the set-up leading to those Megaphones was a +103.50% and +113.50% Bull Cycle respectively. Also both sell-offs got an oversold (30.00 or lower) 1W RSI bottom.
So, since NDX has currently completed a -25% correction near the 1W MA200 and the 0.382 Fib with the 1W RSI bouncing off the oversold barrier, it is very likely that we've formed the pattern's bottom, especially if the global fundamentals point towards trade deals.
If this Low remains intact, we expect a similar +35% short-term Top at 22500 within a 3-4 month period and then long-term rally near the -0.382 Fibonacci extension at 29000.
-------------------------------------------------------------------------------
** Please LIKE 👍, FOLLOW ✅, SHARE 🙌 and COMMENT ✍ if you enjoy this idea! Also share your ideas and charts in the comments section below! This is best way to keep it relevant, support us, keep the content here free and allow the idea to reach as many people as possible. **
-------------------------------------------------------------------------------
💸💸💸💸💸💸
👇 👇 👇 👇 👇 👇
Mastering Volatile Markets: Why the Trend is Your Best Friend█ Mastering Volatile Markets Part 4: Why the Trend is Your Best Friend
In Part 1 , we covered reducing position size.
In Part 2 , we explored liquidity and execution strategies.
In Part 3 , we discussed the power of patience over FOMO.
Now,we're diving into one of the most important principles of all — especially in volatile, fast-moving markets: Follow the Trend. Trust the Trend. Trade With the Trend.
In wild markets like these, everything changes quickly. Indicators print overbought or oversold conditions well before the market even thinks about reversing.
Divergences can keep stacking up while the price continues trending for another 300, 500, or even 1000 points. Why? Volatility + Liquidity conditions = Extended trending behavior.
When liquidity is thin, and volatility is high, strong trends tend to last longer than usual:
Breakouts run further.
Breakdowns fall deeper.
And counter-trend trades? They're often a fast ticket to losses.
█ What Pro Traders Know Better Than Anyone:
In volatile markets, trend-following isn't optional — it's survival.
But wait, it is obvious that trends aren't perfect straight lines. So how can one even realistically “follow” a trend, especially in volatile markets.
Well, the key is to expect the unexpected. Experienced traders trade logically, we expect pullbacks, fakeouts, stop hunts, snapbacks and/or channel breaks. In fact, we prepare for them.
It is detrimental to assume the trend is over just because of these moves. Most of these are liquidity traps, not real reversals.
█ Here's What Pro Traders Do Differently:
⚪ They Identify the Core Trend Direction
Pro traders use price structure, trendlines, moving averages, VWAP , or higher timeframe levels to identify the trend direction. Once identified, every trade respects the trend.
Let me explain with an example.
→ Uptrend Identification:
Say you notice that the price of Gold (XAUUSD) has been consistently making higher highs and higher lows. What should you do?
You use the 100-period moving average (MA) and see that price is staying above it, indicating an uptrend. You wait for price to pull back to the MA, giving you a low-risk entry to join the uptrend rather than chasing the trend.
→ Downtrend Identification:
In a downtrend, USD/JPY keeps making lower highs and lower lows. You observe the 100-period moving average pointing down. This is your cue to look for short entries , avoiding countertrend buys that could trap you.
⚪ They ONLY Look for Entries at Key Trend Channel Levels
Professional traders don’t chase the price or try to catch every move. Instead, they patiently wait for price to return to key areas within a well-defined trend channel , either the upper boundary (in a downtrend) or the lower boundary (in an uptrend).
→ In an uptrend:
Pro traders draw a trend channel based on the price move. When price pulls back to the lower boundary of the channel (often aligning with demand zones), they start looking for long entries, aiming to trade with the trend and target a new high.
→ In a downtrend:
The same logic applies, but in reverse. Price pulls back to the upper boundary of the channel (supply area), offering a clean short opportunity to continue with the trend and target a new low.
But here’s what separates pros from amateurs:
→ They expect fakeouts, spikes , and temporary breaks beyond the trend channel — especially in volatile conditions.
→ They don’t panic when the price briefly moves outside the channel. Instead, they wait for confirmation signals (like a rejection candle, break of structure, or momentum shift) before entering.
→ This gives them both a logical entry point and a favorable risk-reward setup — aligning with the larger trend direction while staying protected if the trend fails.
⚪ They Treat Countertrend Moves as Opportunities to Enter WITH the Trend
When a countertrend move happens, pro traders see it as an opportunity to enter with the prevailing trend, rather than trying to catch a reversal.
→ Counter-Trend Move in an Uptrend:
Let's say S&P 500 is in a strong uptrend, and it experiences a sharp pullback of 5%.
While many retail traders panic and try to short the market, pro traders see this as a buying opportunity at a lower price, anticipating the trend will continue after the correction.
→ Counter-Trend Move in a Downtrend:
For Gold (XAU/USD) , if the price falls sharply from $1,900 to $1,850 and then retraces back to $1,875 (a previous support-turned-resistance level), pros see this as an opportunity to sell into the trend rather than buying into what could be a false recovery.
⚪ They Accept That Trends Can Look "Overbought" or "Oversold" for a Long Time
In volatile, trending conditions, RSI can stay above 70 for hours or even days, and divergences can build for a long time without price reacting.
→ RSI Above 70 in an Uptrend:
Bitcoin (BTC/USD) rallies from $40,000 to $60,000. Despite RSI being above 70 for a few days, pro traders don't fight the trend because momentum is strong. Instead, they look for a pullback to the 100-period MA for a safer entry.
→ Divergence in Downtrend:
The EUR/USD shows a bearish trend , but the RSI starts to build a divergence as the price keeps making lower lows. Pro traders ignore the divergence because the trend is still strong. They wait for a clear break of the trendline or confirmation that price has reversed before considering a long trade.
█ Summary of Part 4 — Trend is Your Best Friend
You can't control how far a trend will run…but you can control whether you're with or fighting against it.
And trust me, fighting a strong trend in a volatile market is a battle retail traders rarely win.
Here’s what you should take away from this article:
Volatile markets = Extended trends
Indicators can lie — trend structure tells the truth
Fakeouts & pullbacks are normal
Don't fight the trend — trade with it
Use counter-moves to enter the trend
Patience & trend-following = Survival + Profit
█ What We Covered:
Part 1: Reduce Position Size
Part 2: Liquidity Makes or Breaks Your Trades
Part 3: Patience Over FOMO
Part 4: Trend is Your Best Friend
That's it! You've now completed the Mastering Volatile Markets series.
Stay calm, adapt quickly, and trade smarter — that's how you survive (and thrive) in volatile markets.
-----------------
Disclaimer
The content provided in my scripts, indicators, ideas, algorithms, and systems is for educational and informational purposes only. It does not constitute financial advice, investment recommendations, or a solicitation to buy or sell any financial instruments. I will not accept liability for any loss or damage, including without limitation any loss of profit, which may arise directly or indirectly from the use of or reliance on such information.
All investments involve risk, and the past performance of a security, industry, sector, market, financial product, trading strategy, backtest, or individual's trading does not guarantee future results or returns. Investors are fully responsible for any investment decisions they make. Such decisions should be based solely on an evaluation of their financial circumstances, investment objectives, risk tolerance, and liquidity needs.
NAS100 (15min) – Bullish Entry Activated1. Symmetrical Triangle Formation
Price was compressing inside a symmetrical triangle, with a series of lower highs and higher lows, indicating indecision and buildup of pressure.
2. Downside Fake-out (False Breakout)
Price briefly broke below the lower trendline, suggesting a potential bearish breakout.
However, there was no strong follow-through; instead, price quickly reclaimed the trendline and pushed back inside the structure.
This is a classic fake-out, often trapping late sellers and providing liquidity for buyers.
The rejection from the lows resulted in a long wick, signalling strong buying interest and failure to break down.
3. Aggressive Bullish Reaction
After reclaiming the triangle support, price moved rapidly back to the top of the triangle.
The next key move was a strong breakout above the upper trendline, confirming bullish intent.
4. Break and Retest
Price action followed through with a clean breakout above resistance, followed by a minor pullback and retest of the broken trendline, which held as support.
This retest offered a textbook entry point based on price action principles.
5. Bullish Structure Confirmation
Post breakout, price formed a higher low and continued to make a higher high, confirming a trend shift.
This structural change strengthens the bullish outlook.
Where is the support level for Nasdaq?! Is the bloodbath over?Bearish fair value gap ranges are taking over this chart and when we rally up into them, they have been sending us down over and over.
This week we have had the advantage of a bearish gap from last week's low. This gave us clear reason to seek longs to fill the gap. Now we have a small cushion of long interest in this range after retesting the 2023 yearly candle's broken high.
As long as we remain above this yearly level--16.960ish (Using last year's low for NQ 17,570ish)-- we will see a neat consolidation and sitting upon these levels before the rally that may lead us out of this range.
That is what I expect, however, if we lose these levels, you already know we are headed to the dungeon of a true recession.
20 min breakdown:
USTEC,NAS100USTEC is still in a downtrend. The price has a chance to test the resistance zone 19588-19875. If the price cannot break through the 19876 level, it is expected that the price will drop. Consider selling in the red zone.
🔥Trading futures, forex, CFDs and stocks carries a risk of loss.
Please consider carefully whether such trading is suitable for you.
>>GooD Luck 😊
❤️ Like and subscribe to never miss a new idea!
QQQ FORECAST Q2 FY25: 13% RECOVERY APRIL FOOLSlike comment follow all the signals here are lit
comment your instrument below ill analyse it bonds crypto etf reits all dat paperwork
The recovery was swift exactly at our $16811 price level (great bargain) if you watched last call
now im calling bluff on this 90 day hype stop loss above entry targets set
there might be a bullish continuation by the mid point narrated by the path line
$17709 if confluence presents itself and necessary events present themselves im hopping out and longing these tariff games can go anyway in a heartbeat
Bearish opportunity if support is broken📉 US100 – Watching for a possible bearish breakout
After reaching the key level of 19,151.5, the US100 price has shown weakness by breaking out of an ascending wedge. It is currently testing a dynamic support zone at 18,695.4, just before a liquidity zone marked in red.
A break below this zone could trigger a move towards 18,434.1, and in extension towards 18,185.8, if bearish pressure continues.
This structure suggests that momentum is shifting in favor of the bears, especially if the blue support fails to sustain the price.
🧠 Action plan: Monitor a breakout with volume and a bearish structure to seek short entries with appropriate risk management.
NASDAQ Black Monday or a Massive Rally??Nasdaq (NDX) opened on early Monday futures trade below both its August 05 2024 and April 19 2024 Lows. All technical Supports have been broken and the market made new 12-month Lows. The market sentiment is extremely bearish, technically oversold, even the 1W RSI is below the 30.00 oversold barrier and the prevailing fundamentals regarding the back-and-forth Tariffs between nations don't leave much room for encouragement.
The index is more than -25% off the February 17 2025 All Time High (ATH), technically Bear Market territory, and the last time it dropped more this fast is during the lockdowns of the COVID crash (February 20 - March 23 2020). The market dropped by -32%, below also all known technical Supports (including its August low) before finding support and forming a bottom just above the 1W MA200 (red trend-line).
The two time events are virtually identical with the only notable difference is that Nasdaq is about to form the 1D Death Cross now while in 2020 it did about 1 month after the low.
The only technical development that leaves room for encouragement is that the 1W RSI during COVID got oversold just a day before the eventual market bottom.
Does today's 1W RSI drop into oversold territory mean that we are about to form a bottom? Unknown. But what we do know is that on March 03 and 16 2020 on two urgent, out-of-schedule meetings, the Fed stepped in to save the market from the free-fall (and save they did) by cutting the Interest Rates to near zero (first to 1.25% and then to 0.25% subsequently from 1.75% previously).
Perhaps that is the only thing that can restore investor confidence (certainly the only action that the Fed can do) and avoid a Black Monday below the 1W MA200, which would be catastrophic. On the other hand, if the U.S. government reach indeed trade deals with the rest of nations and the Fed do what they can from their end, we may even hit new ATH by August!
So what do you think it's going to be? Black Monday or Massive Rally?
-------------------------------------------------------------------------------
** Please LIKE 👍, FOLLOW ✅, SHARE 🙌 and COMMENT ✍ if you enjoy this idea! Also share your ideas and charts in the comments section below! This is best way to keep it relevant, support us, keep the content here free and allow the idea to reach as many people as possible. **
-------------------------------------------------------------------------------
💸💸💸💸💸💸
👇 👇 👇 👇 👇 👇
Symmetrical Triangle: Bullish or Bearish Breakout?Description:
The NASDAQ 100 (NAS100) has formed a symmetrical triangle on the 15-minute timeframe, indicating a consolidation phase after a 5.4% drop. The price is near the triangle's apex, suggesting that a significant directional move is imminent. Here are the key levels and possible scenarios:
Bullish Scenario:
Entry: Breakout above 18,500 on volume.
Target: 19,710.8 (138% Fibonacci).
Stop Loss: 17,800.
R/R: 1:2.
Bearish Scenario:
Entry: Breakout below 17,800 on volume.
Target: 17,341.3 (138% Fibonacci).
Stop Loss: 18,300.
R/R: 1:1.5.
Key Levels:
Resistance: 19,710.8.
Support: 17,341.3.
Intermediate Zones: 18,500 (resistance) and 17,500 (support).
Considerations:
Monitor volume during the breakout to confirm the breakout.
Review macroeconomic events (interest rates, inflation data) and tech company earnings, as the NASDAQ is sensitive to these factors.
Technology market sentiment will be key in determining the direction.
Warning: Trade at your own risk and ensure you have an appropriate risk management plan. Share your opinion in the comments!
Tags: #NASDAQ #NAS100 #SymmetricTriangle #Breakout #TechnicalAnalysis
Trade the Structure: NAS100 Possible Retrace & Buy OpportunityThe NAS 100 recently broke its market structure after a twist in trade policy—with Donald Trump delaying tariffs by 90 days—which sparked a robust rally. On the 4‑hour chart, we're looking for a bullish setup where the initial surge might be followed by a pullback into a sideways accumulation zone. This consolidation is expected to form a "spring" pattern—a brief retest that could trap sellers—followed by a clear break of market structure that signals a renewed upward move. The entry is ideally on the breakout, backed by supportive volume, while risk management is maintained with a stop-loss positioned just below the range if/when price retraces into support. 🚀📈💰
Nasdaq 100 Opens with Bullish GapTrump Exempts Electronics from Tariffs; Nasdaq 100 Opens with Bullish Gap
Despite the weekend, the news flow remained intense amid the escalating trade war. According to media reports:
→ Certain tech products, including those made by Apple, have been exempted from Trump’s tariffs.
→ Trump announced he would make a significant statement regarding semiconductor tariffs on Monday, 14 April.
Stock Indices React to Trump’s Tariff Moves
These announcements were taken positively by the markets. As shown on the chart of the Nasdaq 100 index (US Tech 100 mini on FXOpen), the new week opened with a bullish gap exceeding 1.5% – a stronger performance than the S&P 500 (US SPX 500 mini on FXOpen), which also saw a bullish gap.
This may suggest that market participants are cautiously optimistic that the sweeping tariff measures might be eased through exemptions, delays, or negotiation concessions. Nevertheless, the CNN Business Fear & Greed Index remains in "extreme fear" territory, despite inching higher compared to last week.
As of this morning, the Nasdaq 100 (US Tech 100 mini on FXOpen) has recovered approximately 15% from its 2025 low.
Technical Analysis: Nasdaq 100 (US Tech 100 mini on FXOpen)
Seven days ago, we plotted an ascending blue channel and suggested that its lower boundary could act as support – which has indeed played out.
With the latest data in hand, there is reason to believe that bulls may now be aiming to push the price up toward the channel’s median line. However, as indicated by the arrows on the chart, this median appears to have shifted from acting as support to acting as resistance.
Bulls may also face headwinds from the wide bearish candle to the left, which was formed in reaction to Trump's tariff announcements. According to Smart Money Concept methodology, this area – marked by a bearish Fair Value Gap (highlighted with a rectangle) – may now serve as resistance.
This article represents the opinion of the Companies operating under the FXOpen brand only. It is not to be construed as an offer, solicitation, or recommendation with respect to products and services provided by the Companies operating under the FXOpen brand, nor is it to be considered financial advice.