NAS100 Setup Locked In — Ride the Drop from the Order Block!Hey Guys,
I'm planning a sell trade on the NAS100 index from a designated order block. Once price reaches the sell zone, the position will be activated.
📍 Trade Details:
- 🟢 Entry Level: 22,869
- 🔴 Stop Loss: 22,930
- 🎯 TP1 – First Target: 22,839
- 🎯 TP2 – Second Target: 22,794
- 🎯 TP3 – Final Target: 22,671
📐 Risk-to-Reward Ratio: 3.24
Your likes and support are what keep me motivated to share these analyses consistently.
Huge thanks to everyone who shows love and appreciation! 🙏
NAS100 trade ideas

NASDAQ - Bullish BiasHTF Overview: 4H shows strong bullish intent with momentum driving price higher. Clear upside direction supported by sustained breaks in structure.
Liquidity Note: Noticed a key liquidity zone beneath current price (marked in blue). Although deeper mitigation was possible, price remained bullish.
MTF Refinement (30M): Dropped to the 30M for structural clarity and saw an earlier reaction. A bullish OB was formed and respected — now monitoring it for a potential mitigation.
LTF Execution Plan: If the 30M OB is revisited, I’ll be looking to the 1M/5M for confirmation (CHoCH or BOS) before executing long positions.
Mindset: Momentum is with the bulls — just waiting for smart money to confirm their next move.
Bless Trading!


"NASDAQ 100: THE TECH ROBBERY! – Quick Profits Before Reversal?"🔥 "The NDX NASDAQ 100 INDEX Heist: Bullish Loot & Escape Before the Trap!" 🔥
🌟 Hi! Hola! Ola! Bonjour! Hallo! Marhaba! 🌟
Dear Money Makers & Market Robbers, 🤑💰💸✈️
Based on the 🔥Thief Trading Style🔥 (technical + fundamental analysis), here’s our master plan to heist the NDX - NASDAQ 100 INDEX. Follow the strategy on the chart—long entry is the play! Aim to escape near the high-risk RED Zone (overbought, consolidation, potential reversal). The bears are lurking, so take profits and treat yourself—you’ve earned it! 💪🏆🎉
🚀Entry (The Vault is Open!)
"Swipe the bullish loot at any price!"
For precision, place buy limit orders within 15-30min timeframe (recent swing lows/highs).
Set alerts! Don’t miss the heist.
🛑 Stop Loss (Safety Net)
Thief-style SL at nearest swing low (4H timeframe) → 21,770.00 (adjust based on risk/lot size).
🏴☠️ Target 🎯: 22,800.00
Bullish momentum is fueling this heist—ride the wave but exit before the trap!
📰 Fundamental Backing (Why This Heist Works)
Macroeconomic trends, COT data, geopolitics, and sentiment align for bullish moves.
Full analysis? Check 👉🔗🌎
⚠️ Trading Alerts (News & Risk Mgmt)
Avoid new trades during high-impact news (volatility = danger).
Use trailing stops to lock profits and dodge sudden reversals.
💥 Boost This Heist!
Hit 👍 (Boost Button) to strengthen our robbery squad!
More heists = More profits—stay tuned for the next steal! 🚀🤑
See you soon, fellow thieves! 🤝🎉

US100 Market Open BuyLooking for a liquidity buy on US100 at market open. Allow the price to open a push a little down towards the trigger line at 22700. Target will be a +150 pip move up to 22850.

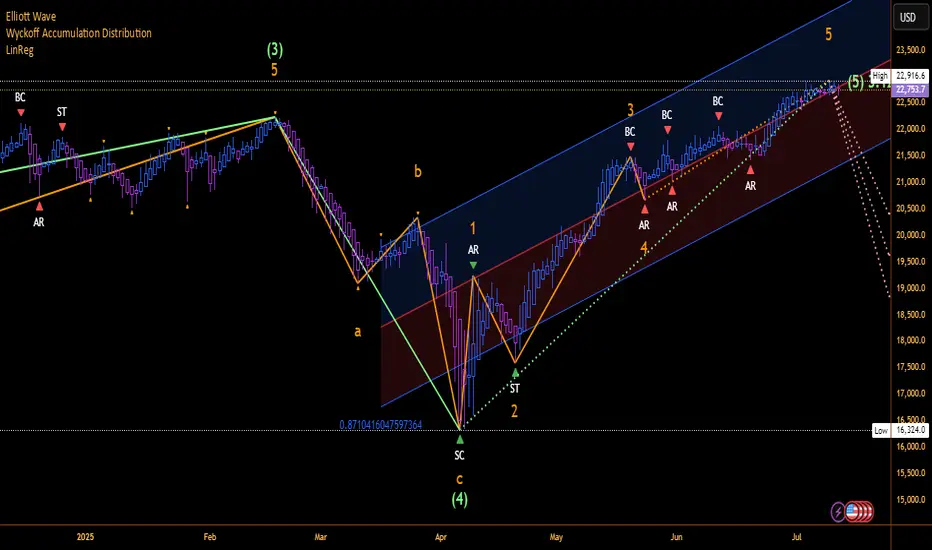
NASDAQ 100 MAJOR REVERSAL SETUP/VOLUME WANINGElliott Wave Theory is a wonderful forecasting tool that provides confluence in conjunction with many technical such as the MFI, Awesome Oscillator, and Bull Bear Power.
Indicators such as Moving averages and ALL Chart Patterns just to name a few, beautifully align painting an amazing roadmap of reversals.
Motive wave in Green, Corrective wave in Pink
Orange Waves are sub waves.
Solid lines are completed, whereas the dotted lines are in progress. The likelihood of a wave count becoming invalidated has a lower probability on higher timeframes for example Day/Week/Month, whereas on lower timeframes such as 1 minute to 5 minute. I've observed wave count invalidation/recalculation of the wave counts more frequently.
With all the news of Tariffs and such the Elliott Wave follows the data, buy/sell side, liquidity, and volume.
Speaking of volume:
April Vol was 15.39M
May Vol was 10.74M
June Vol was 9.04M
As of July 11th it is at 3.37M with 17 trading days to go.
Don't get BULL trapped!!
HAPPY TRADING
US100 Short From Resistance!
HI,Traders !
US100 is weaker than we
Expected and failed to break
The key horizontal level
Around 22868.6 and we are
Now seeing a bearish rejection
So we are locally bearish biased
And we will be expecting a
Further bearish move down !
Comment and subscribe to help us grow !

NASDAQ 100 | BearishNASDAQ has formed divergence on RSI.And NASDAQ plays divergence almost all the times.Considering it will honor the divergence then NASDAQ is going to enter into a strong correction phase and it may test its support zones.

Wedge Cracks + Tariff Heat = Bearish Setup On US100The US100 is showing signs of potential reversal after completing a harmonic ABCD pattern near the wedge resistance. The price has broken below the rising wedge support, indicating bearish momentum.
Bearish Confluences:
1) Completed the ABCD pattern
2) Rsisng Wedge Breakdown
3) Clear Bearish RSI Divergence, showing weakening momentum at highs.
Targets:
TP1: 22180
TP2: 22050
TP3: If the price breaks below 22050, then TP3 will be 21650

NASDAQ - BUYS📉➡️📈 USTEC 15min – Precision Long After Panic Drop
🎯 Reversal Detected | No Hesitation | Immediate Follow-Through
Markets don’t always give second chances. But when they do — you want to be ready.
This sharp drop on USTEC (NASDAQ 100) looked brutal to most...
But the ELFIEDT RSI + Reversion indicator calmly printed a double UP signal at the exact low.
🟢 The Signal: Two “UP” Prints at the Bottom
After a fast and aggressive drop, the system triggered two stacked UP signals right into the final selloff candle — giving clear guidance for a high-probability reversal.
🔹 Hypothetical Trade Setup:
Entry: On confirmation of the second UP signal
Stop-loss: Below the signal wick (minimal drawdown)
Reward: Price surged immediately, offering a strong rally of over 100 points in minutes
⏱️ No delay. No doubt.
✅ Traders were positioned before the herd caught on.
🧠 What Makes ELFIEDT Different?
This isn’t about standard indicators.
This is exhaustion logic fused with a proprietary RSI-based reversion model that works across indices, FX, metals, and more.
📌 Non-repainting
📌 Context-aware
📌 Built for real entries, not just “nice charts”
🔐 This is the public build.
The private builds include even more firepower:
Multi-timeframe confluence
Smart volatility filters
Divergence overlays
Breakout-retest logic
Institutional grade scalping layers
📩 DM to request access — limited spots, serious traders only.
#NASDAQ #USTEC #ReversalTrading #SmartSignals #ELFIEDT #RSIBounce #15MinStrategy #TradingView #Indices #Tech100

NQ: Upcoming Weekly analysis!FA Analysis:
1- Tariff On/Off: The noise will continue this week as well. Europe will be the target this week.
Uncertainty OR Eternity pause? Market might tend towards Eternity pause which is positive for stocks and equities.
2- New Earnings season: This will be on the driver seat for the next few weeks. Positive earnings for major stocks will impact positively NQ and vice-versa.
3- Macroeconomic data:
CPI and PPI will be relevant for July rate cut. Lower and inline inflation will be very good for July Rate cut; hence very good for Equities. Higher inflation data will be bad.
Also, Consumer sentiment and Inflation expectations, later in the week, will be very relevant.
So from FA Analysis, US equities might go either direction based on data outcomes.
TA Analysis:
Weekly TF: Direction is Buy!
The weekly close was irrelevant; it was inside the bullish green candle. Price must break and close below or above the master weekly candle to establish clear direction.
So nothing to trade from weekly perspective.
Daily TF: Direction is Neutral!
Same as weekly TF, we got an irrelevant daily close, inside the previous daily green candle (red dotted lines).
Price must break and close either below or above the dotted red lines for a clear direction.
Hourly TF: Direction is Neutral!
Based on the Weekly and Daily TF, clearly price is consolidating and looking for FA data to make decision on the next move.
Price is making LL-LH-HL-HH... and switching from one side to another reinforcing the consolidation.
Here are two scenarios:
Scenario 1: Good earnings, macroeconomic data and lower inflation will trigger a new ATH.
Scenario 2: Bad earnings, macroeconomic data and higher inflation will trigger a retrace.
Happy green week!

Upward momentum of Nasdaq paused by consolidationUpward momentum of Nasdaq paused by consolidation. Now resting on support of trendline. It may continue its upward momentum next week.

short on nas100I'm looking to short US 100 around the 22,840–22,850 supply zone, where price has previously shown strong rejection. I’m expecting a reversal from this resistance area, targeting the 22,660 level as my take profit. My entry is around the current price, and I’ve placed my stop loss just above the zone at 22,875 to manage risk. This setup gives me a clean structure and a solid risk-reward ratio for the move down.

SellTrend Line Break
Previous Day Volume
Weekly Rejection Point
Untapped Order Point
London - US Session
Three Tap High Structure/ Double Top

NasdaqNon-commercials (hedge funds, asset managers, etc.) are adding significant long exposure.
This usually reflects confidence in continued upside, often in line with strong tech earnings, soft landing narratives, or a dovish Fed.
Bias: Bullish
Large speculators significantly increased long exposure on Nasdaq futures, showing strong confidence in continued upside momentum. This aligns with recent tech-led rallies and soft-landing expectations.

NSDQ100 Bullish breakout retest?Donald Trump escalated trade tensions again, threatening a 35% tariff on Canadian goods shortly after reopening trade talks, and floated doubling global tariffs to 20%. This reinforces his aggressive protectionist stance and puts renewed pressure on allies like Canada and Vietnam, the latter blindsided by a 20% levy. Meanwhile, US-China relations may be entering a critical phase, with a possible Trump-Xi summit hinted at by Marco Rubio during talks in Malaysia.
On the geopolitical front, Trump is signaling a harder line on Russia, previewing a “major statement” and backing expanded sanctions as the US sends more weapons to Ukraine. This raises global uncertainty, especially for energy and defense sectors.
Conclusion for NSDQ100 trading:
Rising trade tensions and geopolitical risks may dampen market sentiment and lead to volatility in tech-heavy Nasdaq stocks, particularly those reliant on global supply chains. While traders have grown numb to tariff talk, the cumulative pressure suggests a downside risk is building. In the short term, maintain a cautious stance—watch for potential pullbacks and heightened intraday volatility as policy clarity remains elusive.
Key Support and Resistance Levels
Resistance Level 1: 22940
Resistance Level 2: 23060
Resistance Level 3: 23180
Support Level 1: 22410
Support Level 2: 22300
Support Level 3: 22130
This communication is for informational purposes only and should not be viewed as any form of recommendation as to a particular course of action or as investment advice. It is not intended as an offer or solicitation for the purchase or sale of any financial instrument or as an official confirmation of any transaction. Opinions, estimates and assumptions expressed herein are made as of the date of this communication and are subject to change without notice. This communication has been prepared based upon information, including market prices, data and other information, believed to be reliable; however, Trade Nation does not warrant its completeness or accuracy. All market prices and market data contained in or attached to this communication are indicative and subject to change without notice.

are we going ath? let us now~~indices looks green, so we rally?
no trump tariffs?
🐉We value full transparency. All wins and fails fully publicized, zero edit, zero delete, zero fakes.🐉
🐉Check out our socials for some nice insights.🐉
information created and published doesn't constitute investment advice!
NOT financial advice

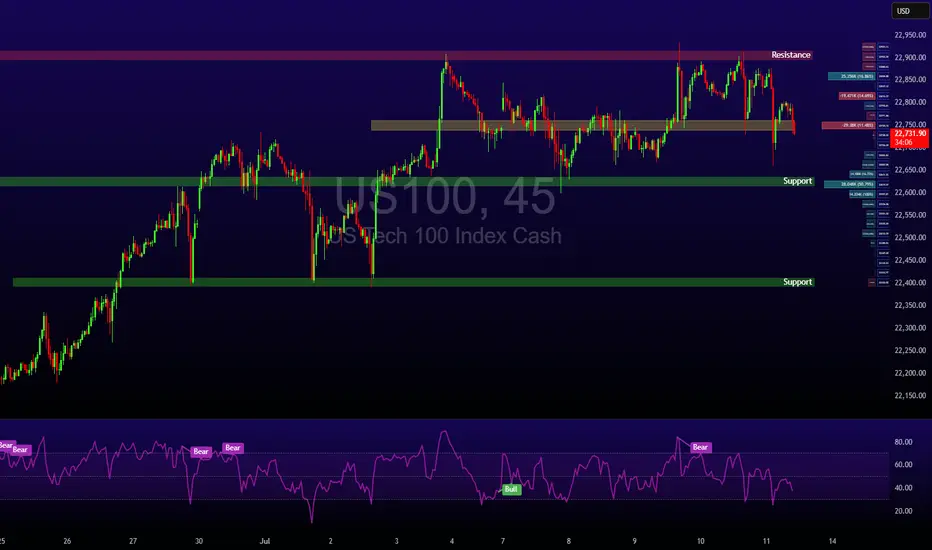
Bearish Momentum Builds Below pivot zone USNAS100 Analysis
Price has reversed from its ATH and now shows bearish momentum.
Below 22705, downside targets are 22615 and 22420.
Bullish scenario only valid if price breaks and holds above 22815.
Pivot: 22710
Support: 22615, 22420
Resistance: 22815, 22910


One last squeeze and NAS100 could explode into the next rallyThe NAS100 is currently coiling within a tight consolidation range, showing signs of tension building up. After a strong push upward, price has been moving sideways in a narrowing structure. This build-up around the high, a compression of buyers and sellers in a low-volatility squeeze could be an indication that we could use. This kind of price action typically signals that buyers are gaining control, squeezing out sellers with each dip.
The lack of deep pullbacks combined with increasingly shallow sell-offs shows fading bearish momentum. Which is often typical during a buildup phase before a breakout. If buyers can push price above with a strong close, it could trigger breakout momentum and lead to a continuation of the larger bullish trend.
Ideally, if price reacts positively and forms bullish confirmation, it would set up a solid continuation entry, with upside potential toward the next target of 23.400.
Until then, bulls are watching closely for signs of commitment. The breakout is yet to be confirmed, but the squeeze is on, and the pressure is building.
What will happen next?
Just sharing my thoughts for the charts, this isn’t financial advice. Always confirm your setups and manage your risk properly.
Disclosure: I am part of Trade Nation's Influencer program and receive a monthly fee for using their TradingView charts in my analysis.

Nasdaq-100 H4 | Swing-low support at 23.6% Fibonacci retracementThe Nasdaq-100 (NAS100) is falling towards a swing-low support and could potentially bounce off this level to climb higher.
Buy entry is at 22,509.40 which is a swing-low support that aligns closely with the 23.6% Fibonacci retracement.
Stop loss is at 22,250.00 which is a level that lies underneath a pullback support and the 38.2% Fibonacci retracement.
Take profit is at 22,921.84 which is a multi-swing-high resistance.
High Risk Investment Warning
Trading Forex/CFDs on margin carries a high level of risk and may not be suitable for all investors. Leverage can work against you.
Stratos Markets Limited (tradu.com ):
CFDs are complex instruments and come with a high risk of losing money rapidly due to leverage. 63% of retail investor accounts lose money when trading CFDs with this provider. You should consider whether you understand how CFDs work and whether you can afford to take the high risk of losing your money.
Stratos Europe Ltd (tradu.com ):
CFDs are complex instruments and come with a high risk of losing money rapidly due to leverage. 63% of retail investor accounts lose money when trading CFDs with this provider. You should consider whether you understand how CFDs work and whether you can afford to take the high risk of losing your money.
Stratos Global LLC (tradu.com ):
Losses can exceed deposits.
Please be advised that the information presented on TradingView is provided to Tradu (‘Company’, ‘we’) by a third-party provider (‘TFA Global Pte Ltd’). Please be reminded that you are solely responsible for the trading decisions on your account. There is a very high degree of risk involved in trading. Any information and/or content is intended entirely for research, educational and informational purposes only and does not constitute investment or consultation advice or investment strategy. The information is not tailored to the investment needs of any specific person and therefore does not involve a consideration of any of the investment objectives, financial situation or needs of any viewer that may receive it. Kindly also note that past performance is not a reliable indicator of future results. Actual results may differ materially from those anticipated in forward-looking or past performance statements. We assume no liability as to the accuracy or completeness of any of the information and/or content provided herein and the Company cannot be held responsible for any omission, mistake nor for any loss or damage including without limitation to any loss of profit which may arise from reliance on any information supplied by TFA Global Pte Ltd.
The speaker(s) is neither an employee, agent nor representative of Tradu and is therefore acting independently. The opinions given are their own, constitute general market commentary, and do not constitute the opinion or advice of Tradu or any form of personal or investment advice. Tradu neither endorses nor guarantees offerings of third-party speakers, nor is Tradu responsible for the content, veracity or opinions of third-party speakers, presenters or participants.

Nasdaq 100 Dips as Tariffs Spark CautionWhile crypto markets rally, U.S. equities have cooled. The Nasdaq 100 dropped by 0.6% following the announcement of new tariffs, particularly those aimed at Canadian goods. Tech stocks are reacting cautiously to these developments, although Nvidia’s record-breaking $4 trillion market cap continues to provide some support for the index.
With major financials such as JPMorgan and Wells Fargo reporting Q2 earnings next week, investors will soon get clarity on how corporate America is coping with higher input costs and global trade tensions.
Technical View (Nasdaq 100):
The index is consolidating between resistance at 22,900 and support at 22,600. A break above 22,900 could reignite the tech rally, while a drop below support may see price test 22,400 and potentially 22,000 in coming sessions.
NAS100 - Follow Progress 2Dear Friends in Trading,
How I see it,
I have summarized the progress and indicated all key levels
Keynotes:
1) I am starting to see strong quality red candles.
2) 22867 is a VERY strong Internal resistance level at this time.
3) 22725 is a VERY strong Internal support level at this time.
I'll keep you posted...please ask if anything is unclear.
I sincerely hope my point of view offers a valued insight.
Thank you for taking the time to study my analysis.
