US100Price broke daily resistance last week and now looks like a retracement is on the way. H4 gave a double top at the rising channel resistance. Pulling back to retest the neckline. target is 22,200.
NAS100 trade ideas

Weekly highs swept, aiming for weekly lows now.Liquidity Grab above Weekly Highs
Bearish Rejection Wicks
Trendline Break
Imbalance / Fair Value Gaps below
Reversion to Mean / Higher Timeframe Discount Zones

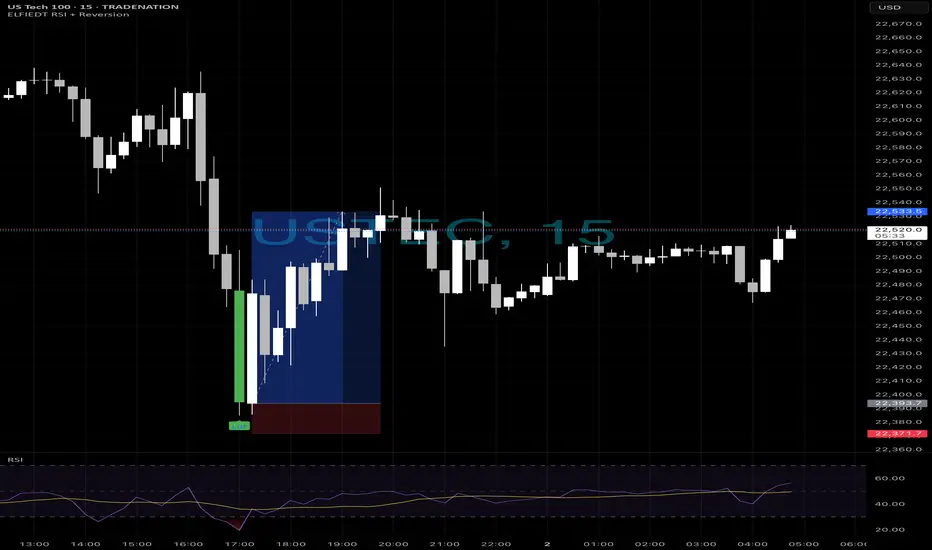
Usrec longs after drop📈 US Tech 100 | 15-Min Chart
✅ Live Trade Example using ELFIEDT RSI + Reversion
⸻
This setup was captured using the ELFIEDT RSI + Reversion indicator. A clean BUY signal was triggered after an extended move, followed by a sharp reversal — perfectly timed and visually confirmed by the indicator’s built-in logic.
💡 The result? A precise entry with a strong follow-through.
This tool is built to spot high-probability reversals with confluence — across timeframes, instruments, and volatility conditions.
⸻
👥 Want to trade with structure and clarity?
Join our community of traders who use this system daily to simplify their decisions and sharpen their edge.
📩 Comment “🔥” or send a DM to learn more.
Up Up Up... Nothing Can Stop NAS From RisingLet's take a look at the big picture in the NASDAQ: Do you see how nicely the spring crash landed on the 50% retracement of the upward movement since fall 2022?
Now that we've crossed the old ATH, the targets are clear, and they're way up in the NASDAQ.
The summer correction is therefore likely to fail and probably turn into a listless sideways slide. By September at the latest, however, the NAS should pick up speed again and head for targets between 25,000 and 26,000 - at the very least.
Clear skies!

USNAS100 Bullish Momentum Holds Above Key PivotUSNAS100 – Overview
The price successfully retested the 22,610 level and resumed its bullish trend, reaching 22,750 as anticipated in our previous idea.
Currently, the index needs to maintain stability above the 22,610 pivot line to sustain the upward momentum toward the next resistance at 22,790. A sustained move above this level may open the path toward 23,000.
However, a 1H candle close below 22,610 could trigger a corrective move down to 22,480. A break below this support would expose the next key level at 22,280.
Pivot: 22,610
Resistance: 22,790 – 23,000
Support: 22,480 – 22,280

Nas100With speculation about no rate cuts we can expect to see Nas100 plumet with Fed Powells upcoming speech.
If we look at the technical side we can see that Nas has been somewhat consolidating over the past 2 days creating a fair amount of Sell side liquidity. We can expect Powell to speak about rat cuts today in his upcoming speech and we will use this to our advantage waiting for early buyers to push up the market triggering our setup.
We can look for a plus minus 100 pip move before Nas turns around, we will however closely monitor the movement of Nas now until the speech so that we can execute a trade with the least amount of risk.
Remember to like and subscribe for more A+ setups.

London session long 01/07/2025Clear AMD, london manipulates into remaining 15min fvg, aim for asian highs.

Overfitting Will Break Your Strategy — Here’s Why█ Why Your Backtest Lies: A Quant’s Warning to Retail Traders
As a quant coder, I’ve seen it time and again: strategies that look flawless in backtests but fall apart in live markets.
Why? One word: overfitting.
Compare the signals in the images below. They’re from the same system, but one is overfitted, showing how misleading results can look when tuned too perfectly to the past.
⚪ Overfitting is what happens when you push a strategy to perform too well on historical data. You tweak it, optimize it, and tune every rule until it fits the past perfectly, including every random wiggle and fluke.
To retail traders, the result looks like genius. But to a quant, it’s a red flag .
█ Trading strategy developers have long known that “curve-fitting” a strategy to historical data (overfitting) creates an illusion of success that rarely holds up in live markets. Over-optimizing parameters to perfectly fit past price patterns may produce stellar backtest results, but it typically does not translate into real profits going forward.
In fact, extensive research and industry experience show that strategies tuned to past noise almost inevitably disappoint out-of-sample.
The bottom line: No one succeeds in markets by relying on a strategy that merely memorized the past — such “perfect” backtests are fool’s gold, not a future edge.
█ The Illusion of a Perfect Backtest
Overfitted strategies produce high Sharpe ratios, beautiful equity curves, and stellar win rates — in backtests. But they almost never hold up in the real world.
Because what you’ve really done is this:
You built a system that memorized the past, instead of learning anything meaningful about how markets work.
Live market data is messy, evolving, and unpredictable. An overfit system, tuned to every quirk of history, simply can’t adapt.
█ A Warning About Optimization Tools
There are many tools out there today — no-code platforms, signal builders, optimization dashboards — designed to help retail traders fine-tune and "optimize" their strategies.
⚪ But here’s the truth:
I can't stress this enough — do not rely on these tools to build or validate your strategy.
They make it easy to overfit.
They encourage curve-fitting.
They give false hope and lead to false expectations about how markets actually work.
⚪ The evidence is overwhelming:
Decades of academic research and real-world results confirm that over-optimized strategies fail in live trading. What looks good in backtests is often just noise, not edge.
This isn’t something I’ve made up or a personal theory.
It’s a well-documented, widely accepted fact in quantitative finance, supported by decades of peer-reviewed research and real-world results. The evidence is overwhelming. It’s not a controversial claim — it’s one of the most agreed-upon truths in the field.
█ Why Overfitting Fails
Let me explain it like I do to newer coders:
Random patterns don’t repeat: The patterns your strategy "learned" were noise. They won't show up again.
Overfitting kills the signal: Markets have a low signal-to-noise ratio. Fitting the noise means you've buried the signal.
Markets change: That strategy optimized for low-volatility or bull markets? It breaks in new regimes.
You tested too many ideas: Try enough combinations, and something will look good by accident. That doesn’t make it predictive.
█ The Research Backs It Up
Quantopian’s 888-strategy study:
Sharpe ratios from backtests had almost zero predictive power for live returns.
The more a quant optimized a strategy, the worse it performed live.
Bailey & López de Prado’s work:
After testing enough variations, you’re guaranteed to find something that performs well by chance, even if it has no edge.
█ My Advice to Retail Traders
If your strategy only looks great after a dozen tweaks… It’s probably overfit.
If you don’t validate on out-of-sample data… you’re fooling yourself.
If your equity curve is “too good” to be true… it probably is.
Real strategies don’t look perfect — they look robust. They perform decently across timeframes, markets, and conditions. They don’t rely on lucky parameter combos or obscure filters.
█ What to Do Instead
Use out-of-sample and walk-forward testing
Stick to simpler logic with fewer parameters
Ground your system in market rationale, not just stats
Risk management over performance maximization
Expect drawdowns and variability
Treat backtest performance as a rough guide, not a promise
Overfitting is one of the biggest traps in strategy development.
If you want your trading strategy to survive live markets, stop optimizing for the past. Start building for uncertainty. Because the market doesn’t care how well your model memorized history. It cares how well it adapts to reality.
-----------------
Disclaimer
The content provided in my scripts, indicators, ideas, algorithms, and systems is for educational and informational purposes only. It does not constitute financial advice, investment recommendations, or a solicitation to buy or sell any financial instruments. I will not accept liability for any loss or damage, including without limitation any loss of profit, which may arise directly or indirectly from the use of or reliance on such information.
All investments involve risk, and the past performance of a security, industry, sector, market, financial product, trading strategy, backtest, or individual's trading does not guarantee future results or returns. Investors are fully responsible for any investment decisions they make. Such decisions should be based solely on an evaluation of their financial circumstances, investment objectives, risk tolerance, and liquidity needs.

NASDAQ Possible short-term pull-back.Last time we analyzed Nasdaq (NDX) was a week ago (June 23, see chart below), giving a comfortable buy signal as the price was rebounding at the bottom of the 6-week Channel Up:
The price hit our 22300 Target and has now touched the top of the Channel Up. Based on the 4H RSI, it resembles the May 15 price action, which soon after pulled back to the 0.382 Fibonacci retracement level.
It is possible to see such relief profit taking on the short-term and a test of 22200 (Fib 0.382).
-------------------------------------------------------------------------------
** Please LIKE 👍, FOLLOW ✅, SHARE 🙌 and COMMENT ✍ if you enjoy this idea! Also share your ideas and charts in the comments section below! This is best way to keep it relevant, support us, keep the content here free and allow the idea to reach as many people as possible. **
-------------------------------------------------------------------------------
Disclosure: I am part of Trade Nation's Influencer program and receive a monthly fee for using their TradingView charts in my analysis.
💸💸💸💸💸💸
👇 👇 👇 👇 👇 👇

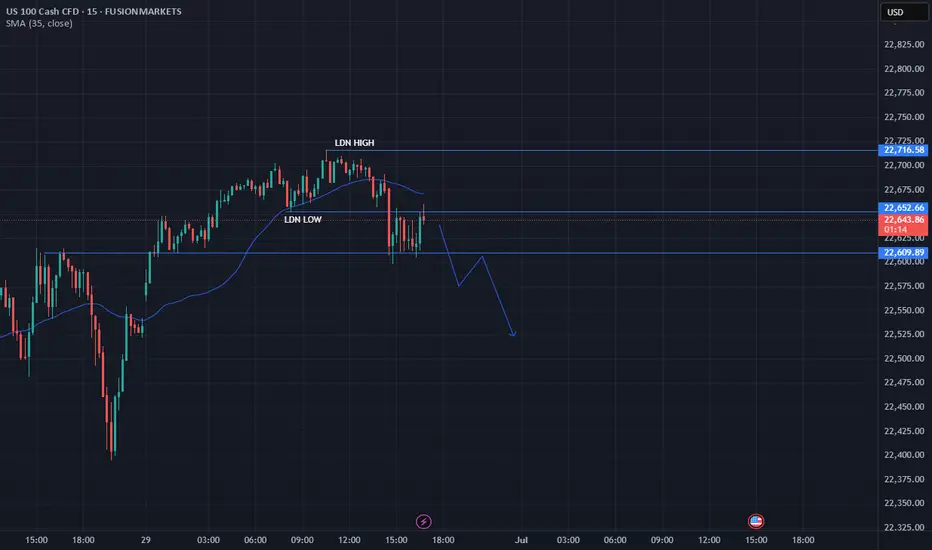
Bullish BiasMarked the LDN highs and lows, Waited for the sweep of sell side liquidity on LDN lows, waiting for BOS and CHoCH and FVG before we enter buys back to the SSL at the London highs.

USNAS100 |Bullish Trend Holds Above Pivot – Eyeing 22790 & 23000USNAS100 | Bullish Movement
The price has stabilized above the key pivot level at 22640, confirming a continuation of the bullish trend toward the next resistance at 22790.
As long as the index remains above 22640, the uptrend is expected to extend toward 22790 and potentially 23000, with minor pullbacks likely to retest the pivot.
Currently, USNAS100 is consolidating between 22640 and 22790.
A 1H candle close below 22640 would signal a bearish correction toward 22520 and possibly 22410.
Pivot Line: 22640
Resistance Levels: 22790, 23000
Support Levels: 22520, 22410
previous idea:

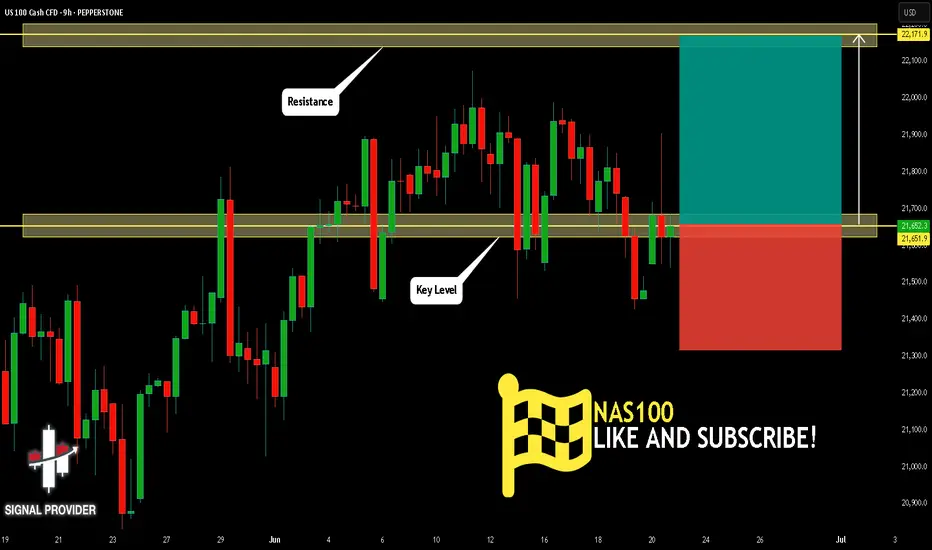
NAS100 Will Go Up From Support! Buy!
Please, check our technical outlook for NAS100.
Time Frame: 9h
Current Trend: Bullish
Sentiment: Oversold (based on 7-period RSI)
Forecast: Bullish
The market is approaching a key horizontal level 21,651.9.
Considering the today's price action, probabilities will be high to see a movement to 22,171.9.
P.S
We determine oversold/overbought condition with RSI indicator.
When it drops below 30 - the market is considered to be oversold.
When it bounces above 70 - the market is considered to be overbought.
Disclosure: I am part of Trade Nation's Influencer program and receive a monthly fee for using their TradingView charts in my analysis.
Like and subscribe and comment my ideas if you enjoy them!
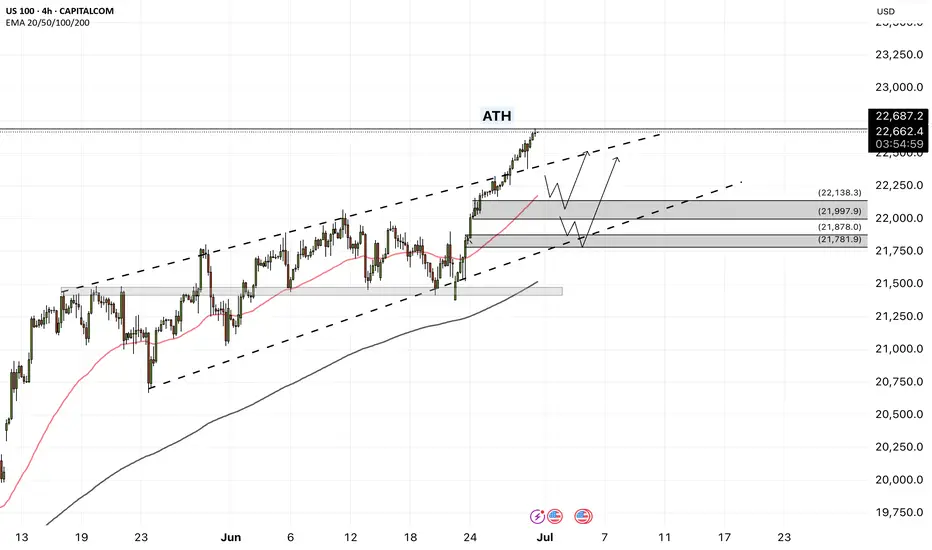
NAS100 - The stock market is breaking the ceiling!The index is above the EMA200 and EMA50 on the four-hour timeframe and is trading in its medium-term channels. If it does not increase and corrects towards different zone, it is possible to buy the index near the reward.
Following a strong rally in U.S.equities, the S&P 500 and Nasdaq indices both achieved new all-time highs on Friday. It marks the first time since February that the S&P 500 has surpassed its previous peak, while the Nasdaq entered fresh price territory for the first time since December.
Despite ongoing market focus on economic data and the Federal Reserve’s interest rate policy path, the simultaneous surge in both indices reflects a renewed appetite for risk in the stock market—an appetite that has been accelerating since mid-April, especially in tech stocks.
In contrast, the Russell 2000 index, which tracks small-cap U.S. companies, still remains significantly below its prior high. To return to its October levels, it would need to rise over 13.5%. However, Friday’s 1.7% gain suggests capital is beginning to flow more broadly into underrepresented sectors.
Analysts argue that a strong breakout in the Russell 2000 could signal a broader rotation toward increased risk-taking—possibly driven by optimism over future rate cuts, easing inflation, and improved business conditions in the second half of the year.
Now that the S&P 500 has reached new highs and the Nasdaq has joined in, attention turns to the Russell 2000. If it begins to accelerate upward, markets could enter a new phase of sustained bullish momentum.
Following a week focused on gauging U.S. consumer spending strength, the upcoming holiday-shortened week (due to Independence Day) will shift attention to key employment and economic activity data.
On Tuesday, markets await the ISM Manufacturing PMI and the JOLTS job openings report. Wednesday will spotlight the ADP private employment report, and Thursday—one day earlier than usual due to the holiday—will see the release of several crucial figures, including the Non-Farm Payrolls (NFP), weekly jobless claims, and the ISM Services Index.
Currently, investor reaction to Donald Trump’s tariff commentary has been minimal. Market participants largely believe that any new tariffs would have limited inflationary effects and that significant retaliation from trade partners is unlikely.
Friday’s PCE report painted a complex picture of the U.S. economy. On one hand, inflation remains above ideal levels; on the other, household spending is showing signs of fatigue—a combination that presents challenges for policymakers.
Inflation-adjusted personal consumption fell by 0.3%, marking the first decline since the start of the year and indicating a gradual erosion of domestic demand. While wages continue to rise, their impact has been offset by declining overall income and reduced government support. To maintain their lifestyle, households have dipped into their savings, driving the personal savings rate down to 4.5%—its lowest level this year.
On the inflation front, the core PCE price index—the Fed’s preferred inflation gauge—rose 2.7% year-over-year, slightly above expectations. Monthly inflation also increased by 0.2%. Although these figures appear somewhat restrained, they remain above the Fed’s 2% target, with persistent price pressures in services—particularly non-housing services—still evident.
Altogether, the data suggest the U.S. economy faces a troubling divergence: weakening household income and consumption could slow growth, while sticky inflation in the services sector—especially under a potential Trump tariff scenario—could limit the Federal Reserve’s ability to cut interest rates.
NAS100 weekly BiasI will be interested to see Monday drop to the Weekly Opening Gap and maybe retrace lower for the Friday low since high has been taken and from thereon we will see if the daily Bias will offer continuation or reversal going forth

NAS100!Nasdaq is clearly in either the start or the end of a consolidation
The trend is still up.
Trade with care use a stop loss

NASDAQNASDAQ If the price cannot break through the 22728 level, it is expected that the price will drop. Consider selling the red zone.
🔥Trading futures, forex, CFDs and stocks carries a risk of loss.
Please consider carefully whether such trading is suitable for you.
>>GooD Luck 😊
❤️ Like and subscribe to never miss a new idea!

NAS100 LongNow that we have an official strong bullish close breaking previous highs on the weekly and monthly time frame. We will look for a potential pullback. The 3M candle is currently on track to closing as a strong bullish engulfing. Also, a 1M morning start followed up by a bullish momentum candle.

NASDAQ| - Continuation Setup Fueled by Momentum📌 Pair: NAS100 (NASDAQ)
📈 Bias: Bullish
🕰 HTF View (4H):
Strong bullish momentum unfolding with structure showing clear intent to continue higher. No major signs of reversal—smart money appears to be driving price up.
🧭 MTF View (30M → 2H clarity):
Using the 2H for cleaner narrative. Waiting for a clean sweep of sell-side liquidity (SSL) into a refined OB to continue the move. 30M showing structural alignment with the bullish bias.
🎯 Entry Criteria:
LTF CHoCH → Liquidity sweep → OB mitigation
Confirm the shift and execute on the return.
🎯 Target: Structure highs above
🧠 Mindset Note:
Momentum is your ally—but don’t let speed replace structure. Follow your confirmation sequence, stay surgical, and let price do the work.
Bless Trading!

"NASDAQ 100: THE TECH ROBBERY! – Quick Profits Before Reversal?"🔥 "The NDX NASDAQ 100 INDEX Heist: Bullish Loot & Escape Before the Trap!" 🔥
🌟 Hi! Hola! Ola! Bonjour! Hallo! Marhaba! 🌟
Dear Money Makers & Market Robbers, 🤑💰💸✈️
Based on the 🔥Thief Trading Style🔥 (technical + fundamental analysis), here’s our master plan to heist the NDX - NASDAQ 100 INDEX. Follow the strategy on the chart—long entry is the play! Aim to escape near the high-risk RED Zone (overbought, consolidation, potential reversal). The bears are lurking, so take profits and treat yourself—you’ve earned it! 💪🏆🎉
🚀Entry (The Vault is Open!)
"Swipe the bullish loot at any price!"
For precision, place buy limit orders within 15-30min timeframe (recent swing lows/highs).
Set alerts! Don’t miss the heist.
🛑 Stop Loss (Safety Net)
Thief-style SL at nearest swing low (4H timeframe) → 21,000.00 (adjust based on risk/lot size).
🏴☠️ Target 🎯: 22,800.00
Bullish momentum is fueling this heist—ride the wave but exit before the trap!
📰 Fundamental Backing (Why This Heist Works)
Macroeconomic trends, COT data, geopolitics, and sentiment align for bullish moves.
Full analysis? Check our bio0 linkk! 👉🔗🌎
⚠️ Trading Alerts (News & Risk Mgmt)
Avoid new trades during high-impact news (volatility = danger).
Use trailing stops to lock profits and dodge sudden reversals.
💥 Boost This Heist!
Hit 👍 (Boost Button) to strengthen our robbery squad!
More heists = More profits—stay tuned for the next steal! 🚀🤑
See you soon, fellow thieves! 🤝🎉

US100 (NASDAQ) BREAKOUT BLUEPRINT: LOOT LIKE A SMART TRADER!🔥 NASDAQ 100 HEIST: STEAL THE TREND LIKE A MARKET BANDIT! 🚨💰
Locked & loaded for the US100 (NASDAQ 100) heist? This slick blueprint cracks the code to loot profits—blending killer technicals with macro intel. Ride the bullish wave, but dodge traps near the Overbought Zone. Bears lurk, so secure your bag before the reversal hits! 🐻💨
🎯 ENTRY: STRIKE LIKE A PRO THIEF
Long the breakout near 21,500.0 (or ambush pullbacks at 20,400.0 & 19600.0).
Set stealth alerts to catch moves in real-time. 🕶️🔔
🛡️ STOP LOSS: ESCAPE ALIVE
Hide stops under the last 4H swing low/wick—no reckless bets!
Adjust for your risk—survivors play smart. ⚡
💸 TAKE PROFIT: VANISH WITH THE LOOT
Main Target: 22,250.0 (or bail early if momentum fades).
Scalpers: Trail stops & ghost out with quick wins. 🏃♂️💨
📡 WHY THIS HEIST WORKS
NASDAQ 100’s on fire: Fundamentals + COT data + macro tides align.
Sentiment’s bullish, but stay sharp—links below for the full intel. 🔍🌐
⚠️ WARNING: NEWS = POLICE SIRENS
Avoid new trades during high-impact news. 📢
Lock profits with trailing stops if you’re already in. 🔐
🤝 JOIN THE TRADING MAFIA
Smash LIKE, drop a comment, & let’s dominate the US100! �
Ready for the next big move? Stay tuned. 👀
Happy hunting, chart pirates! 🏴☠️📉

Comprehensive Market Analysis: NAS100 Comprehensive Market Analysis: NAS100
1. Monthly Timeframe (The Long-Term "Big Picture")
Observation: The chart displays an incredibly powerful and long-standing uptrend. The price is consistently making higher highs and higher lows.
Candlestick Analysis: The most recent candles are strong, long-bodied bullish (green) candles. There are no significant bearish reversal patterns present whatsoever. This is a picture of strength.
Ichimoku Analysis: The price is trading far above the Kumo (Cloud), which is wide and bullish (green). The Tenkan-sen is far above the Kijun-sen, and the Chikou Span is in open space high above the price action from 26 periods ago. This is a textbook example of a very strong, healthy bull market.
Conclusion (Monthly): The long-term outlook is unequivocally Bullish.
2. Weekly Timeframe (The Dominant Trend)
Observation: The strength seen on the monthly chart is confirmed here. The trend is clearly defined and moving from the lower-left to the upper-right.
Heikin Ashi Interpretation: If we were to view this with Heikin Ashi, this chart would show a long sequence of green candles, with most of them having no lower wicks, which, according to your lesson, signifies a very strong and healthy uptrend.
Ichimoku Analysis: All five Ichimoku components are in perfect bullish alignment. The price is above the Tenkan-sen, which is above the Kijun-sen, and all are far above the Kumo. This confirms the trend is not only bullish but also has strong momentum.
Conclusion (Weekly): The dominant trend is Strongly Bullish.
3. Daily Timeframe (The Trading Trend)
Observation: The chart shows a clear uptrend. The most recent price action shows a slight pullback or pause after making a new high.
Candlestick Analysis: The last few candles are smaller and show some indecision (like Spinning Tops), which is very common after a strong upward move. This is more likely a "breather" or consolidation rather than a reversal. There are no major bearish reversal patterns like a Bearish Engulfing or Evening Star.
Ichimoku Analysis: The price is pulling back towards the Tenkan-sen, which is the first line of dynamic support. As long as the price holds above the Kijun-sen, the bullish trend is considered fully intact.
Conclusion (Daily): The trend is Bullish, currently in a minor pullback. The overall structure remains strong.
4. 4-Hour and 1-Hour Timeframes (The Intraday Trend)
Observation: These charts give a clearer view of the minor pullback seen on the daily chart. Here, the price action is moving sideways to slightly down.
Candlestick Analysis: We can see a few Long Upper Shadow candles near the recent top, which confirms the lesson that sellers stepped in to cause this short-term pause. However, there is no strong follow-through yet from the bears.
Ichimoku Analysis: On the 4H chart, the price is testing the Kijun-sen as support. This is a critical level. If it holds, the uptrend is likely to resume. If it breaks below, the correction could deepen, with the Kumo cloud being the next major support zone.
Conclusion (4H & 1H): The short-term momentum is corrective/sideways within a larger bullish trend.
5. Lower Timeframes (30M, 15M, 5M)
Observation: These charts show the corrective price action most clearly, appearing as a short-term downtrend.
Context is Key: Based on the overwhelming strength of the Monthly, Weekly, and Daily charts, this downtrend on the lower timeframes must be interpreted as counter-trend noise. It is a pullback, not a reversal of the major trend.
Harmonic Potential: This pullback could be forming the BC leg of a bullish ABCD pattern, or the AB leg of a bullish Gartley or Bat pattern, where traders would look for a buying opportunity at a key Fibonacci retracement level below.
Overall Synthesis and Final Conclusion
By performing a correct, top-down analysis of the NAS100 charts, the conclusion is the complete opposite of my previous mistaken analysis.
Long-Term (Monthly/Weekly): The market is in a powerful, secular bull market.
Medium-Term (Daily): The primary trend is up, but the market is taking a healthy and expected pause or pullback.
Short-Term (Intraday): The market is currently in a corrective phase.
Final Outlook: The multi-timeframe analysis is in strong alignment. The overwhelming evidence suggests that the primary trend for NAS100 is strongly Bullish. The current downward price action on the lower timeframes is very likely a temporary correction. Traders who align with the dominant trend would view this dip as a potential buying opportunity as the price approaches key support levels (like the Kijun-sen on the 4H/Daily chart), anticipating a resumption of the main uptrend.
For those interested in further developing their trading skills based on these types of analyses, consider exploring the mentoring program offered by Shunya Trade.
I welcome your feedback on this analysis, as it will inform and enhance my future work.
Regards,
Shunya Trade
⚠️ Disclaimer: This post is educational content and does not constitute investment advice, financial advice, or trading recommendations. The views expressed here are based on technical analysis and are shared solely for informational purposes. The stock market is subject to risks, including capital loss, and readers should exercise due diligence before investing. We do not take responsibility for decisions made based on this content. Consult a certified financial advisor for personalized guidance.

Nasdaq look out for weekly sellwe have look into all the tim frames all we see is sells happening next week
there was a trend going up since last week but this week we looking for sells stay turned
