Wait for the NAS100 to break the parallel lines before shortingPEPPERSTONE:NAS100 - Need the price on the 1H TF to break down the parallel lines before taking any short position. After than we could see the index going to 21,450. But till then hold your shorts.
NAS100 trade ideas

Nasdaq EMA and FVG AnalysisThe EMA 50 on the hourly chart at 21,810 has been an area of support. Breaking down blow this level will send the price searching for EMA 200 at 21,740. Above 21,900 there is an FVG from earlier today and breaking through the upper bound at 21,940 will likely send the price upwards beyond yesterday's swing high.

US100 Cautious ApproachThe US 100 is looking for direction to move. On the 1H TF previously it have broken downward trend and formed a HH and HL indicating bullishness. but after the first leg it have gone into consolidation.
Cautios appoach is required with patience as per on going geol political condition and uncertanity looming over.

QQQ - NASDAQ Has Never Been This ExpensiveQQQ relative to the money supply reveals that markets have never been this expensive in history. Despite the significant amount of money pumped in during the COVID-19 pandemic, the economy has not kept pace with all the zeros added to Gov debt.
If we can't lower deficits now at max employment, when will we?
Tulips!
Caution is in order despite what "experts" may tell you.
Click like Follow Subscribe, let's get to 5,000 followers.

NAS LONGNS longs to take out all the liquidity above. Last week's highs to be take out and also structural pattern.
Nasdaq has topped?Both charts and political situation of the globe is not good for risky assets.. Nasdaq bubble is about to pop..

NAS100 – Major Rejection from Weekly Supply Zone!The NASDAQ 100 is showing clear signs of weakness after tagging the strong supply zone near 21,927, an area previously respected as resistance. The market printed a bearish daily close after failing to break above, forming a potential double top pattern just below key resistance.
🔵 Key Zones to Watch:
🔼 Supply Zone: 21,765 – 21,927 (Strong institutional selling pressure)
🔽 Next Target 1: 19,185 (mid-structure support)
🔽 Next Target 2: 16,948 (high-volume demand zone)
📉 Bearish Scenario: If price continues to reject the supply area, we expect momentum to shift bearish targeting the 19,185 zone and possibly 16,948 if major U.S. economic data disappoints.
⚡ Why This Setup Matters:
Market is overstretched, showing distribution signs
Risk-off sentiment growing ahead of major economic reports
Volume profile confirms resistance overhead
🎯 Trading Plan:
Monitor for confirmation (bearish engulfing, breakdown of recent lows)
Short bias below 21,765
Watch for reaction at 19,185 and strong buy interest at 16,948 zone
📊 Let’s hear your thoughts: Will NAS100 hold or is a deeper correction coming? Comment below! ⬇️
#NASDAQ #US100 #Indices #BearishReversal #SupplyDemand #SmartMoney #PriceAction #TradingSetup #TradingView #LuxAlgo

NASDAQ 100 Bullish Breakout Potential: What to Watch NextI'm currently monitoring the NASDAQ 100 (NAS100) very closely. Building on yesterday’s outlook, we've now seen a clear bullish structural shift — price is holding firm above a recent higher high and higher low, suggesting the early stages of a potential trend continuation 📈
Zooming into the 30-minute chart, we can track price action more precisely. I’m watching for a decisive break above the current range high on this timeframe. If we get the break → retest → rejection pattern, this would confirm bullish momentum and provide a long opportunity 🚀
Should this scenario play out, we could also see JPY pairs strengthen to the upside, as a risk-on sentiment flows through the markets 🧭
🔍 This setup is developing — as always, patience and precision are key.

NAS - ACTIVE TRADE COMMUNITY - PLEASE BRING TO THE MOONTeam, we have successfully trade both LIVE trading on UK100 short yesterday and LONG both NAS AND DOWN yesterday.
Today we are entry small portion LONG for NAS.
WILL DOUBLE LONG if market drop low at 21650-21600
Target 1 - at 21850-21875
TAKE 50-70% volume on profit and bring stop loss to BE once target 1 hit
Target 2 remaining at 21900-21950
GOOD LUCK AND LET KILL THE BEAST TOGETHER

NADSDAQ BULLISH SETUP FOR THE WEEKTrade Idea: NASDAQ100 Long Bias (Weekly Setup)
Market Narrative:
The NASDAQ remains bullish across the quarterly, monthly, and weekly timeframes, supported by a strong market structure and ongoing macro sentiment. On Monday, we observed significant bullish displacement, confirming institutional interest and directional intent.
Tuesday Outlook:
A retracement is expected on Tuesday, potentially forming the weekly low. Ideal entries will form around liquidity runs on Asia session lows, offering a high-probability long setup if price reacts bullishly from that zone.
Entry Zone:
Optimal Buy Zone: From 21,700 and below, ideally after a liquidity sweep below Asia session lows or into a previous demand block.
Watch for bullish order flow or market structure shift confirmation around this zone before entering.
Stop Loss:
21,525 (below the liquidity run and protected low)
Take Profit:
Open Target: The market is poised to break all-time highs, so targets should trail based on structure. Consider:
TP1: 22,150 (Previous swing high)
TP2: 22,400+ (Discovery zone / ATH breakout)
Use trailing stop or structure-based exits beyond TP1.
Confluences:
Bullish displacement on higher timeframes
Weekly low likely to form Tuesday
Asia session liquidity below current price
Strong institutional flow into tech
Risk Management:
Risk only 1% of account equity per trade
Position sizing based on entry and SL distance

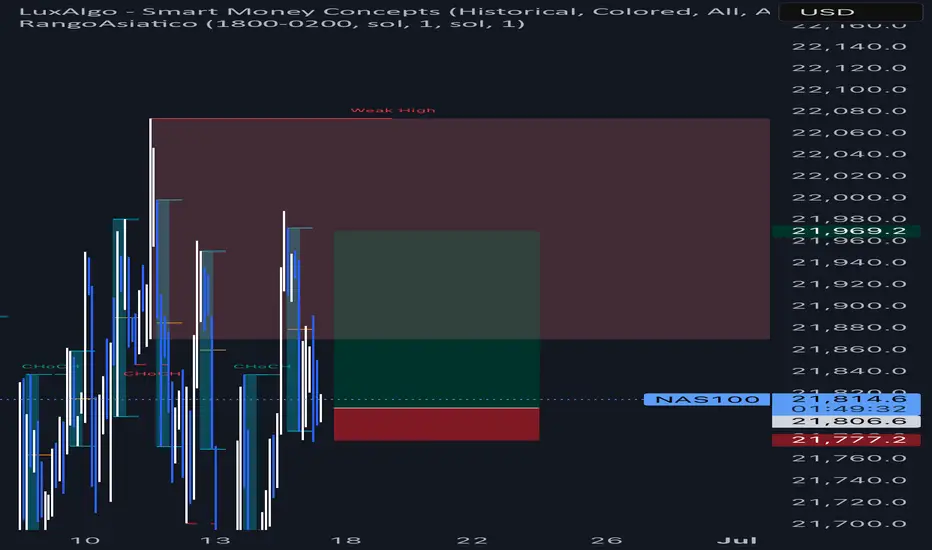
Nasdaq-100 (NDX) daily analysis Distribution & Accumulation Zone🧭 CAPITALCOM:US100
Market Interpretation & Scenarios
🟢 Accumulation Zone (Demand / Buy-Side Liquidity)
21,640–21,720 region
• Strong buying reaction post-CHoCH + bullish BOS.
• Green FVG + “Long” entry = Smart Money likely accumulating.
• Price made a new HH and is now retracing into the gray FVG & BB zone.
• 🔍 If 21,800–21,775 holds, price may push higher and retest or break 21,960.
• 🎯 Upside Targets: 22,000–22,050 (next liquidity grab).
🔴 Distribution Zone (Supply / Sell-Side Liquidity)
21,920–21,960 region
• Premium zone where HH formed, followed by retracement.
• Red FVG + rejection = Smart Money potentially distributing.
• Failure to close above suggests a temporary distribution range.
• ❗️ If gray FVG breaks down, expect a drop toward green FVG (~21,680) or lower.
• A CHoCH near 21,775 would confirm a bearish shift in structure

An update on my NAS100 trade idea I shared over the weekend.I analyzed over the weekend and ended up breaking down a weak high, my mistake was not considering some of the information the chart was communicating at that time.
I ended up not getting any entry opportunity on the POI I was targeting. As I was waiting, I noticed I was looking for entry on the push of a weak high which was now acting as an inducement then reevaluated my analysis and noticed price was going to look for liquidity above that weak high.

NAS100USDNAS100USD It’s still downtrend
If break support 19963 below then It’s going down till 16174, (extention is 15325)
The stock market is highly volatile. Please be very careful with your investments.


NASDAQ SWING SELLSWe have a major chOch on weekly and daily timeframe. We pulled back into extreme supply zone and chOch on M45 AND M30 AND pulled back again hence we expect a big drop from where the market is. Scale in more sells upon previous H1 candle low break. Hold for long

US100 is Currently trading in a clear bullish zoneUS100 Technical & Fundamental Outlook (4H Timeframe)
The US100 is currently trading in a clear bullish zone on the 4-hour chart. Despite underlying pressure due to cautious market sentiment, the index shows signs of resilience Geopolitical tensions in the Middle East persist but have yet to spark panic selling. Market uncertainty remains high ahead of this week's anticipated Federal Reserve outlook.
Technical View:
The index is showing strength, and a 4H candle close above the 22,000 level would be a significant bullish signal. A confirmed breakout above this level opens the door to the next potential target at 22,500
If you like this idea if find more better analysis from our team we need support from You Guys.

The "True Close" Institutions Don't Talk About — But Trade On█ My Story from the Inside
I worked at a hedge fund in Europe, where I served as a Risk Advisor. One thing I never expected before joining the institutional side of the market was this:
They didn’t treat the current day’s close as the "true" close of the market.
Instead, they looked at the first hour of the next day — once all pending flows had settled, rebalancing was done, and execution dust had cleared — that was the true close in their eyes.
Here’s why that changed everything I knew about trading:
█ Institutional Reality vs Retail Fantasy
⚪ Retail traders are taught:
“The daily close is the most important price of the day.” But institutions operate under constraints that most retail traders are never exposed to:
Orders too large to fill before the bell
Internal compliance and execution delays
Batch algorithms and VWAP/TWAP systems that extend into the next session
So while the market might close on paper at 17:30 CET, the real trading — the stuff that matters to funds — might not wrap up until 09:30 or 10:00 the next morning.
Although the official “close” prints here, institutional volume ends quickly. It drops off sharply, almost immediately. Once the books are closed and final prints are done, big players exit — and what's left is thin, passive flow or noise.
The first hour of the New York session reveals structured flows, not random volatility. This is where institutions finalize yesterday’s unfinished business, which is why many consider this the “true” close.
And that’s the price risk managers, portfolio managers, and execution teams internally treat as the reference point.
█ Example: The Rebalance Spillover
Let’s say a fund needs to offload €100 million worth of tech stocks before month-end. They start into the close, but liquidity is thin. Slippage mounts. They pause execution. Next morning, their algo resumes — quietly but aggressively — in the first 30 minutes of trade.
You see a sharp spike. Then a reversal. Then another surge.
That’s not noise. That’s structure. It’s the result of unfinished business from yesterday.
█ Why the First Hour is a War Zone
You’ve probably seen it:
Prices whip back and forth at the open
Yesterday’s key levels are revisited, sometimes violently
Big moves happen without any overnight news
Here’s what’s happening under the hood:
Rebalancing spillovers from the day before
Late-position adjustments from inflows/outflows
Risk parity or vol-targeting models triggering trades based on overnight data
The market’s not reacting to fresh news — it’s completing its old to-do list.
█ What the Research Really Says About Morning Volatility
The idea that "the true close happens the next morning" isn’t just insider intuition — it’s backed by market microstructure research that highlights how institutional behaviors disrupt the clean narrative of the official close.
Here’s what the literature reveals:
█ Heston, Korajczyk & Sadka (2010)
Their study on intraday return patterns shows that returns continue at predictable 30-minute intervals, especially around the open.
The key driver? Institutional order flow imbalances.
When big funds can’t complete trades at the close, they spill into the next session, creating mechanical, non-informational momentum during the first hour. These delayed executions are visible as persistent price drifts after the open, not random volatility.
█ Wei Li & Steven Wang (SSRN 2010)
This paper dives into the asymmetric impact of institutional trades. It shows that when institutions are forced to adjust positions — often due to risk limits, inflows/outflows, or model-based triggers — the market reacts most violently in the early hours of the day.
When funds lag behind the clock, the next morning becomes a catch-up window, and price volatility spikes accordingly.
█ Lars Nordén (Doctoral Thesis, Swedish Stock Exchange)
In his microstructure research, Nordén found that the variance of returns is highest in the early part of the session, not at the close. This is especially true on days following macro events or at the end/start of reporting periods.
The data implies that institutions “price in” what they couldn’t execute the day before, making the next morning more informative than the actual close.
█ Bottom Line from the Research:
The first hour isn’t wild because it’s full of emotion.
It’s wild because it’s full of unfinished business.
These studies reinforce that price discovery is a rolling process, and for institutional flows, the official close is just a checkpoint, not a final destination.
█ How to Use This as a Trader
⚪ Don't assume the official close is final
Treat it as a temporary bookmark. Watch what happens in the first hour of the next day — that’s when intentions are revealed.
⚪ Volume in the first 30–60 minutes matters
It’s not noise — it’s flow completion. Often non-price-sensitive. Often mechanical.
⚪ Design strategies around “true close” logic
Test fade setups after the first hour’s range is established. That’s often the real “settled” level.
⚪ Use the first-hour VWAP or midpoint as a reference
Institutions may anchor to that — not the official close — for mean reversion or risk metrics.
█ Final Thought
The first hour is not the start of something new.
It’s the conclusion of yesterday’s market.
And unless you understand how institutions truly close their books — and how long that takes — you’ll always be a step behind.
So next time you see chaos at the open, stop calling it random.
👉 It’s just the market putting yesterday to bed — late.
-----------------
Disclaimer
The content provided in my scripts, indicators, ideas, algorithms, and systems is for educational and informational purposes only. It does not constitute financial advice, investment recommendations, or a solicitation to buy or sell any financial instruments. I will not accept liability for any loss or damage, including without limitation any loss of profit, which may arise directly or indirectly from the use of or reliance on such information.
All investments involve risk, and the past performance of a security, industry, sector, market, financial product, trading strategy, backtest, or individual's trading does not guarantee future results or returns. Investors are fully responsible for any investment decisions they make. Such decisions should be based solely on an evaluation of their financial circumstances, investment objectives, risk tolerance, and liquidity needs.

NASDAQ Close to the 1st 1D Golden Cross in 2 years!Nasdaq (NDX) has been trading within a Channel Up since the December 2022 Low and is currently extending the gains of the latest Bullish Leg.
At the same time it is about to form the first 1D Golden Cross in more than 2 years (since March 08 2023). The last two major Bullish Legs of this pattern, before the previous one was interrupted by the Trade War, were pretty symmetrical, peaking at +49.21% and +47.47% respectively.
If the current one follows the +47.47% 'minimum', we should be expecting Nasdaq to hit 24000 by late Q3.
-------------------------------------------------------------------------------
** Please LIKE 👍, FOLLOW ✅, SHARE 🙌 and COMMENT ✍ if you enjoy this idea! Also share your ideas and charts in the comments section below! This is best way to keep it relevant, support us, keep the content here free and allow the idea to reach as many people as possible. **
-------------------------------------------------------------------------------
Disclosure: I am part of Trade Nation's Influencer program and receive a monthly fee for using their TradingView charts in my analysis.
💸💸💸💸💸💸
👇 👇 👇 👇 👇 👇

USTECH Long Opportunity USTECH is currently on a break out to the upside, resuming the bullish trend. Price broke out above $21820 and is currently on a retracement where it could potentially provide a break and retest level at $21820.
Price is trading above the 50 SMA and is currently showing bullish momentum coming out of the RSI.
There is bullish structure amidst the consolidation present thus its important to trade cautious. Looking to the ride the bullish wave from the $21820 to the resistance at $22050.

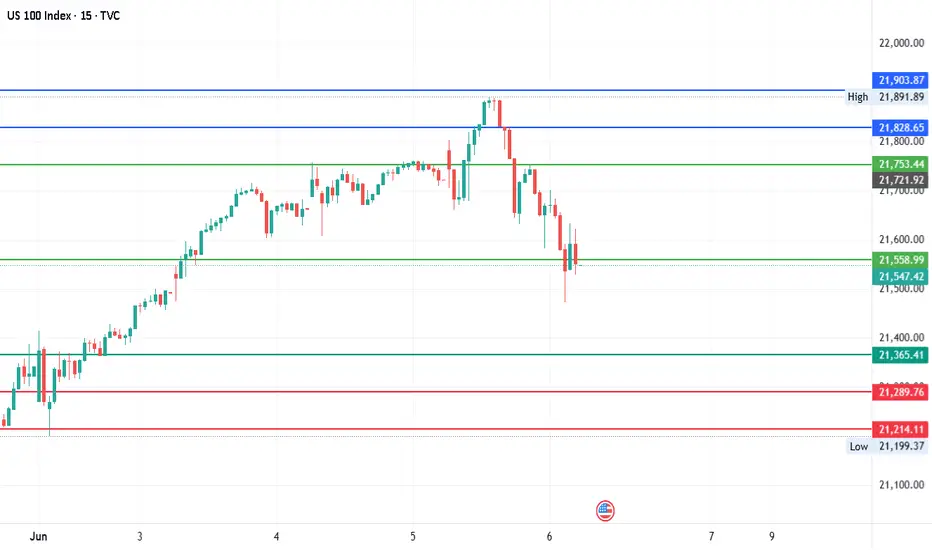
#NDQ - Daily | Pivot is 21547.43 Date: 06-06-2025
#NDQ Current Price: 21547.43
Pivot Point: 21558.99 Support: 21365.41 Resistance: 21753.44
Upside Targets:
Target 1: 21828.65
Target 2: 21903.87
Target 3: 22033.20
Downside Targets:
Target 1: 21289.76
Target 2: 21214.11
Target 3: 21084.78
Nasdaq Challenges Record HighsNasdaq continues to trade just below a one-month resistance line, which connects consecutive higher highs formed between May and June 2025. This line has capped the index just shy of the 22,000 mark, as price action navigates the push and pull between summer momentum, geopolitical tensions, and economic uncertainty.
To the upside, a decisive break and hold above 22,200 would be a bullish trigger, potentially opening the path toward the 23,700 resistance zone. This level notably aligns with the 0.618 Fibonacci extension, projected from the 2023 low, 2025 high, and 2025 retracement low.
On the downside, risks remain for a deeper correction if the index retraces toward the 21,000–20,600 region. This zone represents the neckline of the December–January double top, and stands as a critical threshold separating a bullish continuation scenario from the possibility of a deeper bearish pullback.
- Razan Hilal, CMT

Hanzo / Nas100 30 Min ( Accurate Tactical Break Out Zones )🔥 Nas100 – 30 Min Scalping Analysis (Bearish Setup)
⚡️ Objective: Precision Breakout Execution
Time Frame: 30-Minute Warfare
Entry Mode: Only after verified breakout — no emotion, no gamble.
👌Bullish After Break : 21810
Price must break liquidity with high volume to confirm the move.
👌Bearish After Break : 21640
Price must break liquidity with high volume to confirm the move.
☄️ Hanzo Protocol: Dual-Direction Entry Intel
➕ Zone Activated: Strategic liquidity layer detected — mapped through refined supply/demand mechanics. Volatility now rising. This isn’t noise — this is bait for the untrained. We're not them.
🩸 Momentum Signature Detected:
Displacement candle confirms directional intent — AI pattern scan active.
— If upward: Bullish momentum burst.
— If downward: Aggressive bearish rejection.
🦸♂️ Tactical Note:
The kill shot only comes after the trap is exposed and volume betrays their position.

NASDAQ Weekly Trading Strategy: Bullish Opportunities Amid Secto- Current Price: 21631.04
- Key Insights:
- NASDAQ’s mixed performance suggests an ideal opportunity for selective
trading, with robust long-term bullish trends juxtaposed against short-term
volatility.
- Traders should focus on support levels for entry and utilize resistance
targets for profit-taking. Technology stocks exhibit vulnerabilities but may
rebound if key supports hold. Tesla's relative strength over peers offers
additional momentum within the sector.
- Price Targets:
- Next Week Targets:
- T1: 22,000
- T2: 22,600
- Stop Levels:
- S1: 21,200
- S2: 20,800
- Recent Performance:
- The NASDAQ saw a -0.63% decline last week, performing better than the Dow
(-1.32%) but lagging behind the S&P 500 (-0.39%). Technology sector divergence
dominated trading, with weakness in Nvidia and Apple contrasting Tesla’s
resilience.
- Expert Analysis:
- Despite short-term challenges, investor sentiment remains optimistic based
on institutional data, provided that support levels hold firm. NASDAQ’s position
above crucial long-term moving averages suggests sustained bullish interest.
However, short-term signals warn of possible pullbacks due to broader risk
aversion.
- News Impact:
- Escalating geopolitical tensions in the Middle East contributed to increased
market volatility. Risk-off sentiment pushed investors toward safer assets like
gold and oil, impacting equity flows. As tensions persist, the market may face
heightened challenges next week.
