NSDQ100 INTRADAY awaits US CPI data Trade:
The US and China agreed on a basic plan to restart trade in sensitive goods. China will speed up rare earth exports, and the US may ease some export rules. The deal still needs approval from Trump and Xi. A court also ruled Trump can keep his global tariffs for now. Markets dipped due to the lack of details, and focus is now on US inflation data.
Protests:
LA had a quieter night after setting a downtown curfew. Anti-ICE protests spread to more cities. Trump’s move to send the military to LA is drawing controversy.
Key Support and Resistance Levels
Resistance Level 1: 22070
Resistance Level 2: 22370
Resistance Level 3: 22680
Support Level 1: 21300
Support Level 2: 21060
Support Level 3: 20820
This communication is for informational purposes only and should not be viewed as any form of recommendation as to a particular course of action or as investment advice. It is not intended as an offer or solicitation for the purchase or sale of any financial instrument or as an official confirmation of any transaction. Opinions, estimates and assumptions expressed herein are made as of the date of this communication and are subject to change without notice. This communication has been prepared based upon information, including market prices, data and other information, believed to be reliable; however, Trade Nation does not warrant its completeness or accuracy. All market prices and market data contained in or attached to this communication are indicative and subject to change without notice.
NAS100 trade ideas

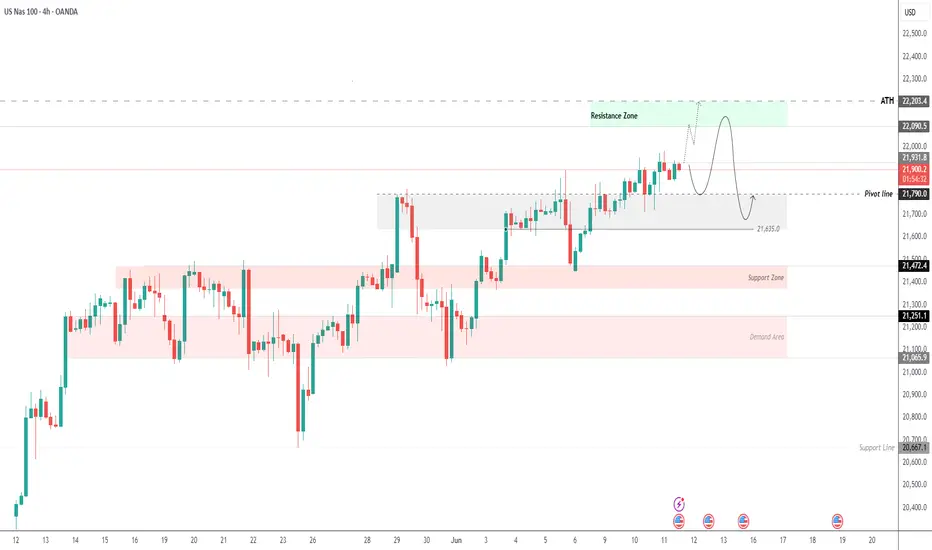
USNAS100 | CPI Data to Drive Next Move – Key Pivot at 21790USNAS100 | OVERVIEW
The index is showing sensitive price action, especially after stabilizing above the pivot level at 21790. The release of U.S. CPI data will likely dominate today's movements.
If CPI > 2.5%:
Stronger inflation could pressure the index lower. A drop toward 21790 is expected, and a break below this level may extend the bearish trend toward 21635, and possibly 21480. However, holding above 21790 may keep the bullish structure intact.
If CPI < 2.5%:
Weaker-than-expected inflation would support bullish momentum, with potential to push higher toward 22090 and test the all-time high at 22200.
Support Lines: 21790, 21635, 21480
Resistance Lines: 22090, 22200
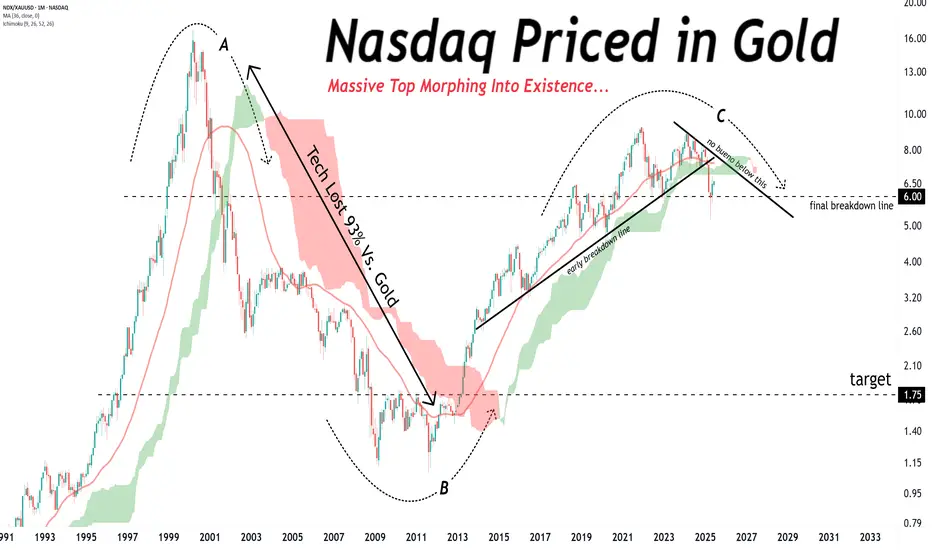
NASDAQ PRICED IN GOLD FORMING A MASSIVE TOP.NASDAQ PRICED IN GOLD FORMING A MASSIVE TOP.
If history rhymes… tech could bleed value while Gold continues to shine.
Final breakdown nearing, where you would expect the Nasdaq to fall as this gets confirmed.
Nasdaq 100 Approaching Breakout Zone! | Key Levels to Watch The Nasdaq 100 has been on a steady bullish trend since mid-April, respecting a beautiful ascending trendline shown in blue. As of now, the price is sitting at 21,905, right under a critical resistance zone around 21,920–21,950.
Here are the key levels marked on the chart:
🔹 Resistance:
21,920–21,950 (current testing zone)
21,139.82 (previous local high)
🔹 Support Zones:
20,599.44
20,056.10
19,889.50
18,161.32 (major swing low)
🔹 Trendline Support:
Starting from April lows, this trendline continues to hold as dynamic support, adding to the bullish momentum.
---
📊 Price Action Insights:
✅ Bullish structure with higher highs and higher lows
✅ Strong bullish candles leading into resistance
✅ Consolidation near the highs — potential breakout brewing
✅ Price staying above the 20,599 and 20,056 key support zones
---
🧨 Potential Trade Setups:
📈 Bullish Breakout Scenario:
A clean break and close above 21,950 on the 4H could trigger a bullish run toward 22,200+.
📉 Rejection Scenario:
Failure to break above this zone might lead to a retest of 20,599.44 or the trendline support for a better entry.
---
📌 Key Events to Watch:
🇺🇸 US Market Holidays and Data Releases (circled in red) could add volatility — stay alert!
---
🗣️ What’s Your Bias?
🔽 Do you think Nasdaq will break higher or retrace back to the trendline support?
💬 Drop your analysis below! Let’s discuss 💬
👍 Like & Follow if you find this helpful – more setups coming soon!
#NASDAQ100 #NDQ100 #TechnicalAnalysis #PriceAction #TradingView #StockMarket #BreakoutTrading #Trendline #SupportAndResistance #FrankFx14

US100 Local Short! Sell!
Hello,Traders!
US100 keeps growing but
The index will soon hit a
Horizontal resistance
Of 22,243 so after the
Retest we will be expecting
A local pullback and a
Local move down
Sell!
Comment and subscribe to help us grow!
Check out other forecasts below too!
Disclosure: I am part of Trade Nation's Influencer program and receive a monthly fee for using their TradingView charts in my analysis.

USTECUSTEC price is now near the resistance zone 21916-22226. If the price cannot break through the 22226 level, it is expected that the price will drop. Consider selling the red zone.
🔥Trading futures, forex, CFDs and stocks carries a risk of loss.
Please consider carefully whether such trading is suitable for you.
>>GooD Luck 😊
❤️ Like and subscribe to never miss a new idea!

Sniper Smart money NASDAQ 🎯 SNIPER SIGNAL – NASDAQ (NAS100)
📅 Date: June 11, 2025
⏱ Timeframe: 1H (H1)
📉 Type: Sell
📍 Entry (SELL): 21,950 – 21,970
⛔ Stop Loss: 22,050
🎯 Take Profit 1: 21,700
🎯 Take Profit 2: 21,450
📊 Risk/Reward ≈ 1:2
🧠 Smart Money Analysis:
✅ Liquidity sweep above 21,950–21,970
✅ Bearish BOS confirmed on 1H
✅ H1 imbalance zone not filled
✅ RSI shows bearish divergence
✅ Order block rejection at 21,900–21,950
💬 Confirmation: await H1 close below ~21,900
🔒 Always use effective risk management
📌 Signal by: **@Talion-Promosale**
(Personal analysis – not financial advice)
#NAS100 #NASDAQ #SniperSignal #SmartMoney #TradingView #TalionPromosale

Sniper NASDAQ 🎯 SNIPER SIGNAL – NASDAQ (NAS100)
📅 Date: June 11, 2025
⏱ Timeframe: 1H (H1)
📉 Type: Sell
📍 Entry (SELL): 19,270 – 19,300
⛔ Stop Loss: 19,370
🎯 Take Profit 1: 19,100
🎯 Take Profit 2: 18,950
📊 Risk/Reward ≈ 1:2
🧠 Smart Money Analysis:
✅ Liquidity grab above the 19,300 key level
✅ Bearish Break of Structure (BOS) confirmed on 1H
✅ H1 imbalance zone not yet mitigated
✅ Bearish RSI divergence
✅ Strong rejection from institutional order block on H1
💬 Confirmation: Wait for 1H candle to close below 19,250 for extra confirmation
🔒 Risk management is essential
📌 Signal posted by: **@Talion-Promosale**
(Personal analysis – not financial advice)
#NAS100 #NASDAQ #SniperSignal #SmartMoney #TradingView #TalionPromosale

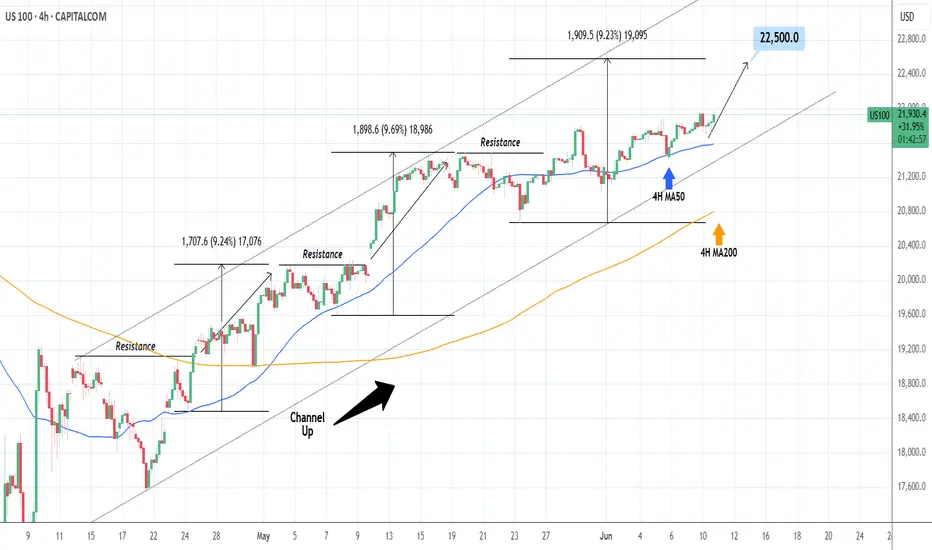
NASDAQ: Close to a strong bounce.Nasdaq is about to turn overbought on its 1D technical outlook (RSI = 68.736, MACD = 505.460, ADX = 18.046) as it is extending an uptrend since the 4H MA50 test/bounce. Such low paced price increase typically precedes strong breakouts. Since the long term pattern is a Channel Up, we are still on its 3rd bullish wave overall. The prior ones were +9.50% on avg, so we remain bullish on the short term, TP = 22,500.
## If you like our free content follow our profile to get more daily ideas. ##
## Comments and likes are greatly appreciated. ##
Hanzo / Nas100 15 Min ( Accurate Tactical Bullish Break Out )🔥 Nas100 – 15 Min Scalping Analysis
⚡️ Objective: Precision Breakout Execution
Time Frame: 15-Minute Warfare
Entry Mode: Only after verified breakout — no emotion, no gamble.
👌Bullish After Break : 21920 / Break out done
Price must break liquidity with high volume to confirm the move.
☄️ Hanzo Protocol: Dual-Direction Entry Intel
➕ Zone Activated: Strategic liquidity layer detected — mapped through refined supply/demand mechanics. Volatility now rising. This isn’t noise — this is bait for the untrained. We're not them.

long trade in NQ100 Simple analytics and quant analyticsDaily time frame we have area of accumulation .
4h TF realty market structure bullish .
30 TF we have multi area of resistance to support, Its mean
a signal of market next time go up .

Nasdaq will reach 25'000 still no body see it?Current level: 21,876
Previous ATH: 22,222.61
Next stop? Well… if you ask the pivot levels they're whispering "23347.20, baby."
What we’re looking at is not just a strong recovery it’s a market that refuses to take a breather. With weekly candles forming higher lows and pivot zones behaving like polite suggestions rather than resistance, it’s hard not to think the index is gearing up for a proper breakout.
Sure, skeptics will say we’re overextended. Bears will point to the volume spikes and say “exhaustion.” But momentum? She's dancing in stilettos on top of R3 like it's a catwalk.
Now, here's the fun part:
If this rhythm keeps up and if inflation, rates, and the Fed behave like decent background characters then 25,000 by the end of the year isn’t just possible. It's that slightly overconfident friend at the party who's already halfway into a celebratory toast.
So… who dares to trust the trend?
Because let’s be honest: being early is painful, being late is expensive but being in the trend? That’s just good business.
📈 Trade safe, manage risk, and don’t fight the trend. Unless you're into that kind of thrill.
#tradehills #Pscarfo

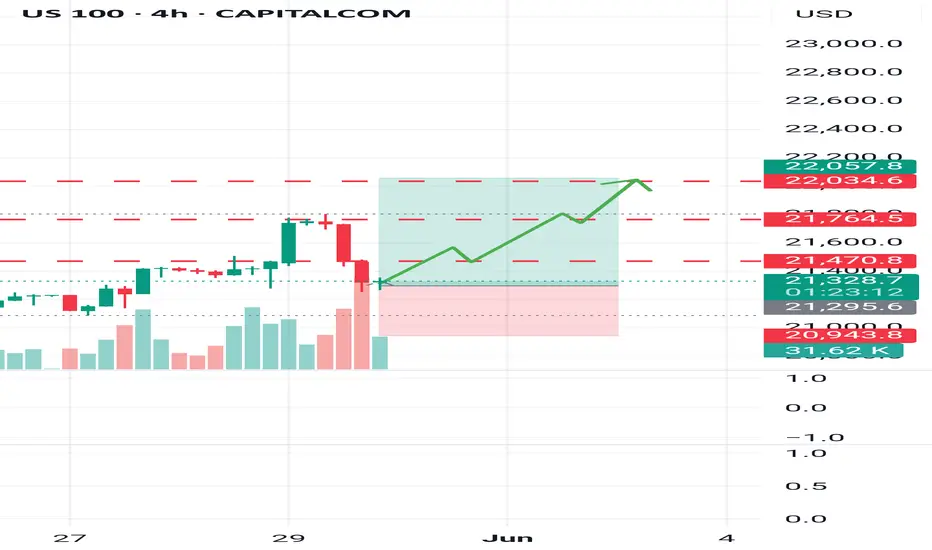
This is not a bull trap, US100 target 22kIm expecting Nas to climb after healthy pullback. You can enter now at 21319 and TP next week at 22K. If you decide to trade this idea, use a proper size. You can also average at the bottom of SL zone. TP partially at the red lines. Please check my previous ideas to know if-what are you trading. Wish you good luck.
Nasdaq at Supply Zone – Rejection or Breakout? (READ THE CAPTIONBy examining the #Nasdaq chart on the weekly timeframe, we can see that the price is still trading within the supply zone around 21,850. We are still waiting for a strong rejection from this level, which could lead to a short-term price correction in this index.
The potential downside targets are:
21,000, 20,700, 20,200, and 19,150.
The key supply range lies between 21,400 and 22,200.
Additionally, there is a possibility of a liquidity grab or stop-hunt above 22,200 before any real drop begins.
This analysis will be considered invalid if price closes above 22,400 in the next three weeks.
On the fundamental side, there are several macro factors to watch:
Interest Rate Expectations:
Although inflation in the U.S. has cooled compared to last year, the Fed remains cautious. If upcoming CPI or PPI prints show unexpected resilience, the likelihood of rate cuts this year could diminish, pressuring tech-heavy indices like Nasdaq.
Tech Sector Valuations:
Valuations in major tech names — such as NVIDIA, Apple, and Microsoft — have reached historically high multiples. This makes Nasdaq particularly vulnerable to correction, especially if earnings disappoint or growth expectations soften.
Geopolitical Risks:
Ongoing tensions between the U.S. and China over trade and technology, as well as potential instability in the Middle East, could contribute to a risk-off sentiment — further supporting the case for a short-term pullback.
Earnings Season Ahead:
Q2 earnings season is around the corner. Any signs of slowing revenue growth or reduced forward guidance from major tech firms could act as a catalyst for the expected correction.
Please support me with your likes and comments to motivate me to share more analysis with you and share your opinion about the possible trend of this chart with me !
Best Regards , Arman Shaban

Tight Stop LOSSlet's try this new strategy where you put your entry price at your has to be stop loss, to see that it actually works

Nasdaq-100 (NDX) Weekly Chart 2025 Chart Context
This weekly timeframe analysis of the Nasdaq-100 Index (NDX) forms a key pillar in our 2025 macro analysis series. Following the breakout structure seen in TOTAL, TOTAL2, BTC.D, and US10Y, this chart utilizes 2 Fibonacci tools (1 trend-based extensions and 1 retracement) to project potential corrective and expansion scenarios.
Fibonacci Tools Used:
Fibonacci Retracement : Applies to the recent smaller swing to determine micro retracement zones and cluster supports.
0=20674 and 100=10504
Trend-Based Fibonacci Extension: Drawn using a three-leg structure (point A= 3993 to B=16724 to C10504) to forecast upside targets beyond ATH.
All take-profit (TP) levels: TP1 (~23,400), TP2 (~26,700), and TP3 (~30,344.49)—are located at confluence zones where Fibonacci levels from different tools align, reinforcing their validity and strength.
There is a 4TP above all the Visible TPs
Key price references:
0% retracement: ~20,674.71
Next Resistance ~23,400 (confluence of extensions and psychological resistance)
Projected TPs:
1TP=~23,400,
2TP=~26,700,
3TP=~30,344.49,
4TP=44000
Support/Resistance:
Red zone: ~16,700–18,300 (historical S/R and correction target and Fib Confluences)
Resistance zone: ~23,000–23,400 ,
22000(ATH area)
Key Technical Observations:
Fibonacci Retracement from ~20674 to ~15732 marks the initial corrective range.
Trend-Based Extensions forecast:
TP1 (~23,400): First breakout resistance
TP2 (~26,700): Medium-term expansion zone
TP3 (~30,344): Long-term target if macro tailwinds persist
Scenario Pathways:
Bullish Continuation: Breaks above ATH to reach TP2/TP3
Healthy Correction: Pullback to ~20,600 or deeper ~18,300 before resumption
Deep Correction: Revisits ~16,700 zone if macro environment deteriorates
Fundamental Context:
Tech Stocks & Economic Sentiment: NDX is often the first to move during liquidity expansions. Its performance signals risk-on behavior across global equity markets.
Rate Cuts in 2025: With anticipated Fed rate cuts, tech stocks are primed for inflows. Forward earnings valuations rise, justifying extended upside in high-beta tech.
AI Boom & Earnings Growth: Nasdaq is heavily weighted toward AI, cloud, and semiconductors—sectors expected to lead earnings surprises.
NDX Influence on Gold and Crypto
When NDX rallies:
Crypto: Risk appetite improves. Capital rotation flows into altcoins and layer-1 assets.
Bitcoin: Often sees parallel inflows, especially during strong tech rallies (e.g., 2020).
TOTAL & TOTAL3: Begin breakout patterns if NDX continues to surge.
Gold: May stall or correct as investors favor risk assets. However, gold still holds due to macro hedging and real yield pressures.
When NDX corrects:
Crypto: Volatility spikes. Altcoins bleed faster.
Bitcoin: Short-term dip but may decouple if viewed as digital gold.
Gold: Benefits from flight-to-safety behavior.
US10Y: Often reacts inversely to NDX moves—used for confirmation.
Search Highlights (2024–2025):
Institutions view NDX correction as signal to rotate into commodities (incl. gold).
Cross-market correlations show NDX peaks often precede crypto mini-rallies.
De-risking from NDX often triggers gold strength, especially in geopolitical or inflationary backdrops.
Bias & Strategy Implication
Primary Bias: Bullish
Expecting upside continuation to 26,700–30,000 zone
Multiple correction opportunities are present even during rally
Strategic Actions:
Monitor for correction to yellow/red zones for accumulation
Use NDX behavior as leading macro signal for crypto rotations
Watch resistance at 23,400 closely; breakout confirms trend extension
Time Horizon
Short-Term (1–2 months): Watch for breakout or correction to ~20,600–18,300
Mid-Term (3–6 months): Probable test of ~26,700
Long-Term (6–12 months): Potential expansion to ~30,344.49

Nasdaq-100 H1 | Potential bullish bounce off 50% Fibo support?The Nasdaq-100 (NAS100) is falling towards a pullback support and could potentially bounce off this level to climb higher.
Buy entry is at 21,703.02 which is a pullback support that aligns with the 50.0% Fibonacci retracement.
Stop loss is at 21,400.00 which is a level that lies underneath a swing-low support and the 50.0% Fibonacci retracement.
Take profit is at 22,022.32 which is a resistance that aligns with the 127.2% Fibonacci extension.
High Risk Investment Warning
Trading Forex/CFDs on margin carries a high level of risk and may not be suitable for all investors. Leverage can work against you.
Stratos Markets Limited (tradu.com ):
CFDs are complex instruments and come with a high risk of losing money rapidly due to leverage. 63% of retail investor accounts lose money when trading CFDs with this provider. You should consider whether you understand how CFDs work and whether you can afford to take the high risk of losing your money.
Stratos Europe Ltd (tradu.com ):
CFDs are complex instruments and come with a high risk of losing money rapidly due to leverage. 63% of retail investor accounts lose money when trading CFDs with this provider. You should consider whether you understand how CFDs work and whether you can afford to take the high risk of losing your money.
Stratos Global LLC (tradu.com ):
Losses can exceed deposits.
Please be advised that the information presented on TradingView is provided to Tradu (‘Company’, ‘we’) by a third-party provider (‘TFA Global Pte Ltd’). Please be reminded that you are solely responsible for the trading decisions on your account. There is a very high degree of risk involved in trading. Any information and/or content is intended entirely for research, educational and informational purposes only and does not constitute investment or consultation advice or investment strategy. The information is not tailored to the investment needs of any specific person and therefore does not involve a consideration of any of the investment objectives, financial situation or needs of any viewer that may receive it. Kindly also note that past performance is not a reliable indicator of future results. Actual results may differ materially from those anticipated in forward-looking or past performance statements. We assume no liability as to the accuracy or completeness of any of the information and/or content provided herein and the Company cannot be held responsible for any omission, mistake nor for any loss or damage including without limitation to any loss of profit which may arise from reliance on any information supplied by TFA Global Pte Ltd.
The speaker(s) is neither an employee, agent nor representative of Tradu and is therefore acting independently. The opinions given are their own, constitute general market commentary, and do not constitute the opinion or advice of Tradu or any form of personal or investment advice. Tradu neither endorses nor guarantees offerings of third-party speakers, nor is Tradu responsible for the content, veracity or opinions of third-party speakers, presenters or participants.

Hanzo / Nas100 15 Min ( Accurate Tactical Break Out Zones )🔥 Nas100 – 15 Min Scalping Analysis
⚡️ Objective: Precision Breakout Execution
Time Frame: 15-Minute Warfare
Entry Mode: Only after verified breakout — no emotion, no gamble.
👌Bullish After Break : 21850
Price must break liquidity with high volume to confirm the move.
👌Bearish After Break : 21690
Price must break liquidity with high volume to confirm the move.
☄️ Hanzo Protocol: Dual-Direction Entry Intel
➕ Zone Activated: Strategic liquidity layer detected — mapped through refined supply/demand mechanics. Volatility now rising. This isn’t noise — this is bait for the untrained. We're not them.
🩸 Momentum Signature Detected:
Displacement candle confirms directional intent — AI pattern scan active.
— If upward: Bullish momentum burst.
— If downward: Aggressive bearish rejection.
🦸♂️ Tactical Note:
The kill shot only comes after the trap is exposed and volume betrays their position.

USNAS100 Bearish Below 21,790 – Key Levels to WatchUSNAS100 – Overview
The price remains under bearish pressure as long as it trades below the pivot level at 21,790. A continued move lower is expected toward the support at 21,635, and a 15-minute close below this level may extend the bearish trend toward 21,480.
To shift to a bullish outlook, the price must stabilize above 21,920, which could open the path toward 22,090.
Pivot: 21,790
Support Levels: 21,635 · 21,480 · 21,250
Resistance Levels: 21,920 · 22,090 · 22,200

Hanzo / Nas100 15 Min ( Accurate Tactical Break Out Zones )🔥 Nas100 – 15 Min Scalping Analysis (Bearish Setup)
⚡️ Objective: Precision Breakout Execution
Time Frame: 15-Minute Warfare
Entry Mode: Only after verified breakout — no emotion, no gamble.
👌Bullish After Break : 21825
Price must break liquidity with high volume to confirm the move.
👌Bearish After Break : 21690
Price must break liquidity with high volume to confirm the move.
☄️ Hanzo Protocol: Dual-Direction Entry Intel
➕ Zone Activated: Strategic liquidity layer detected — mapped through refined supply/demand mechanics. Volatility now rising. This isn’t noise — this is bait for the untrained. We're not them.
🩸 Momentum Signature Detected:
Displacement candle confirms directional intent — AI pattern scan active.
— If upward: Bullish momentum burst.
— If downward: Aggressive bearish rejection.
🦸♂️ Tactical Note:
The kill shot only comes after the trap is exposed and volume betrays their position.
Hanzo / Nas100 15 Min ( Accurate Tactical Break Out Zones )

New High. Flat Divergence Bearish Divergence due to highs within price action with a double top on our RSI index. Ultimately we're in a large chopping block waiting to be released. If you assess SPX prior to downfall, you don't see unusual large rejections, it's progressive and it has been for a while. Safe bets... to 21,400

NAS100 ATH or what? optimism coming back or no? Chyna CHyna CHyNAS100 ATH or what?
optimism coming back or no? Chyna CHyna CHyna? or no CHyna? let us know~~
we caught april bottom now run ATH?
🐉We value full transparency. All wins and fails fully publicized, zero edit, zero delete, zero fakes.🐉
🐉Check out our socials for some nice insights.🐉
information created and published doesn't constitute investment advice!
NOT financial advice

NASDAQ 100 at Heavy Supply – Time to Sell the Top?The US100 (NASDAQ) has entered a strong supply zone near 21,800, and history suggests this is no time to get greedy…
🧠 Key Observations:
Price is now inside a critical resistance area marked by LuxAlgo’s Supply & Demand indicator.
We've had multiple rejections at this level going back to March.
Momentum is slowing even as price pushes higher — divergence alert 🚨
📉 Potential Drop Zones:
21,765 = immediate resistance-turned-support to watch
19,185 = former consolidation + breakout base (likely bounce zone)
16,948 = demand cluster where bulls are likely to reload
📆 Timing Is Key:
With macro catalysts (⚡🌍📰) scheduled in the coming week — including inflation and Fed signals — volatility could spike and force a sharp move down if sellers take control.
---
📌 My Setup:
If price fails to break and hold above 21,800, I’m watching for bearish confirmation to short, targeting 19,185 short-term and 16,948 mid-term.
---
💬 What’s your take on NASDAQ?
Do you trust this breakout or is it just another bull trap?
👉 Comment below, leave a ❤️ if this helped, and follow for more chart breakdowns.
