Nas100NAS100 Safety Trade Setup
Strategy Name: Safety Trade — NAS100 (M5/M15)
Setup Description:
This is a momentum-based entry using the Safety Trade concept, identifying high-probability reversal or continuation zones based on layered confirmations across EMAs and price behavior.
Criteria:
• EMA Setup: 800 EMA (Trend), 200 EMA (Market structure), 50 EMA (Signal line), 5 EMA & 13 EMA (Entry signals)
• Zone Identification: Price pulls away from the 50 EMA and creates a significant gap (liquidity imbalance).
• Entry Signal:
• Red-Red-Green candle pattern for buys
• Green-Green-Red candle pattern for sells
• Confirmed by EMA re-alignment and RSI divergence (optional)
• Entry: After the third candle closes in the pattern.
• SL: Below/above the second candle wick.
• TP: 1:2 to 1:3 RR or key ADR zone.
• Preferred Session: New York (after 9:30 AM EST)
• Avoid: Major news releases or uncertain market conditions.
⸻
Disclaimer
This idea is for educational purposes only and does not constitute financial advice. Trading NAS100 and other indices involves significant risk and may not be suitable for all investors. Always use proper risk management, do your own research, and consult a licensed financial advisor before trading
NAS100 trade ideas

Nas100NAS100 Safety Trade Setup
Strategy Name: Safety Trade — NAS100 (M5/M15)
Setup Description:
This is a momentum-based entry using the Safety Trade concept, identifying high-probability reversal or continuation zones based on layered confirmations across EMAs and price behavior.
Criteria:
• EMA Setup: 800 EMA (Trend), 200 EMA (Market structure), 50 EMA (Signal line), 5 EMA & 13 EMA (Entry signals)
• Zone Identification: Price pulls away from the 50 EMA and creates a significant gap (liquidity imbalance).
• Entry Signal:
• Red-Red-Green candle pattern for buys
• Green-Green-Red candle pattern for sells
• Confirmed by EMA re-alignment and RSI divergence (optional)
• Entry: After the third candle closes in the pattern.
• SL: Below/above the second candle wick.
• TP: 1:2 to 1:3 RR or key ADR zone.
• Preferred Session: New York (after 9:30 AM EST)
• Avoid: Major news releases or uncertain market conditions.
⸻
Disclaimer
This idea is for educational purposes only and does not constitute financial advice. Trading NAS100 and other indices involves significant risk and may not be suitable for all investors. Always use proper risk management, do your own research, and consult a licensed financial advisor before trading

Nas100As we patiently wait for stock market to close. I'm technically waiting for price to hit ny entry on the OB . Looking for +250 points on the buying side once orders are triggered. Trade carefully

Nasdaq / long back to retest the topNasdaq / long back to retest the top.
Stop loss and take profit Levels on the chart, based on the 1hr engulfing candle.
trade with care/ updates will follow

X2: NQ/US100/NAS100 Long - Day Trades 1:2 RRX2:
Risking 1% to make 2%
NAS100, US100, NQ, NASDAQ Long for day trade, with my back testing of this strategy, it hits multiple possible take profits, manage your position accordingly.
Risking 1% to make 2%
Use proper risk management
Looks like good trade.
Lets monitor.
Use proper risk management.
Disclaimer: only idea, not advice

X2: NQ/US100/NAS100 Short - Day Trades 1:2 RRX2:
Risking 1% to make 2%
NAS100, US100, NQ, NASDAQ short for day trade, with my back testing of this strategy, it hits multiple possible take profits, manage your position accordingly.
Risking 1% to make 2%
Use proper risk management
Looks like good trade.
Lets monitor.
Use proper risk management.
Disclaimer: only idea, not advice

short us100flash manufacturing not looking too good. sellers slook abit strong, broken some new lows already. think got chance usa might retest the lows.
going to open 1 order on this.
entry is support turned resistence, with some seller comfirmation.

NAS100 Sell TradeAfter Yesterday free fall NAS100 Took Support at 21021 level and formed a bearish Flag Pattren, we will take a sell stop entry after the breakout of Pole at 20970 level with SL of LH 21175 our 1st TP will be at 20790 right up side of 1st support and 2nd TP at 20610 2nd Support

US100 Tests Uptrend: Bearish Signals Emerge❗️ US100 Bearish Alert ❗️
Technical Breakdown Incoming?
📉 The NASDAQ 100 has hit a new local low and is now testing the uptrend line.
🔴 A bearish block order has formed.
📉 RSI signals clear bearish divergence.
📉 MACD confirms momentum is fading for bulls.
🧲 A gap below is acting like a magnet for price action!
🚨 Trade Idea:
🔽 Sell US100 only on a confirmed break below 21070
🎯 TP1: 20745
🎯 TP2: 20188
📊 All indicators point to potential downside – are you prepared?

US NAS100Preferably suitable for scalping and accurate as long as you watch carefully the price action with the drawn areas.
With your likes and comments, you give me enough energy to provide the best analysis on an ongoing basis.
And if you needed any analysis that was not on the page, you can ask me with a comment or a personal message.
Enjoy Trading ;)

Hanzo / Nas100 15m Path ( Confirmed Breakout Zones )🆚 Nas100
The Path of Precision – Hanzo’s Market Strike
🔥 Key Levels & Breakout Strategy – 15M TF
☄️ Bearish Setup After Break Out – 21030 Zone
Price must break liquidity with high volume to confirm the move.
☄️ Bullish Setup After Break Out – 21215 Zone
Price must break liquidity with high volume to confirm the move.
🩸 15M Time Frame Confluence
————
CHoCH & Liquidity Grab @ 21000
Key Level / Equal lows Formation - 21050
Strong Rejection from 21210 – The Ultimate Pivot
Strong Rejection from 21100 – The Ultimate Pivot
🔥 1H Time Frame Confirmation
Twin Wicks @ 21200 – Liquidity Engineered
Twin Wicks @ 21050 – Liquidity Engineered
👌 The Market Has Spoken – Are You Ready to Strike?
Hanzo / Nas100 15m Path ( Confirmed Breakout Zones )

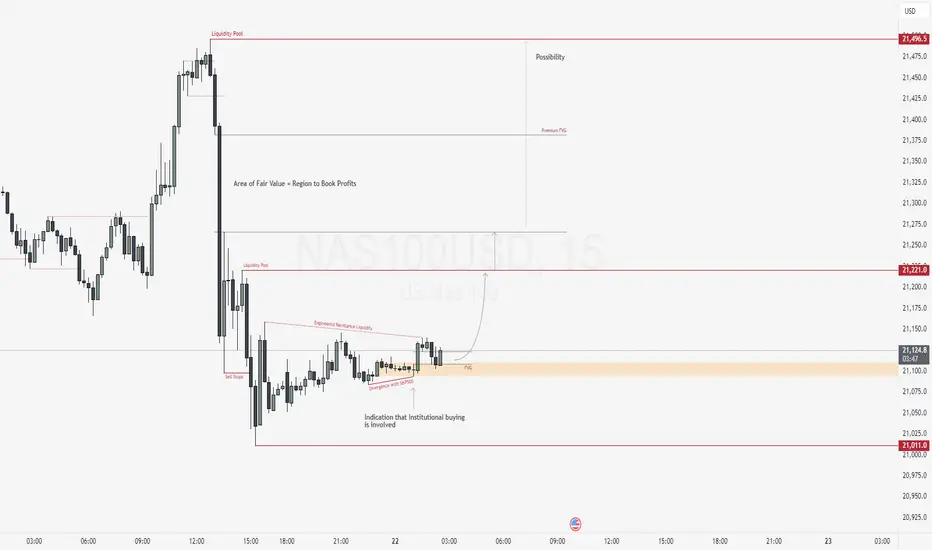
NAS100USD: SMT Divergence Signals Reversal from Discount PricingGreetings Traders,
In today’s analysis, we are closely monitoring NAS100USD for a potential reversal of bearish institutional order flow. While the broader trend has been bearish, current price action presents strong confluence for a bullish shift, suggesting an opportunity to align with a possible upside move.
Market Context:
NAS100USD is currently trading in deep discount territory, which historically presents favorable conditions for institutional accumulation. We’ve observed a liquidity sweep—price took out previous sell stops—suggesting institutions may have order-paired against willing sellers at these discounted levels.
Key Observations:
SMT Divergence with S&P500: While the S&P500 took out its previous low, NAS100USD remained above its corresponding low. This divergence signals underlying strength and institutional buying on NAS100USD, offering a strong indication of a reversal.
Bullish Structure Hints: Minor breaks in market structure to the upside are emerging, further validating the bullish narrative.
Institutional Support Zone: Price is currently trading inside a bullish order block that is also aligned with a Fair Value Gap (FVG)—a strong confluence zone that may act as support for continued upside movement.
Trading Strategy:
Await confirmation of support holding within the order block and FVG zone.
Target 1: Relatively equal highs just above current price action—an engineered liquidity pool where buy stops are likely resting.
Target 2: The premium FVG, a key area of institutional interest where longs accumulated at a discount will be offloaded for profit. The area of fair value is an region where the institutions start to book their profits.
By reading the divergence, price action, and institutional behavior, we can strategically position ourselves to capitalize on a high-probability reversal.
Happy Trading,
The Architect 🏛📊
Nasdaq-100 H1 | Potential bounce off a pullback supportNasdaq-100 (NAS100) is falling towards a pullback support and could potentially bounce off this level to climb higher.
Buy entry is at 20,898.76 which is a pullback support.
Stop loss is at 20,500.00 which is a level that lies underneath a swing-low support and the 50.0% Fibonacci retracement.
Take profit is at 21,471.38 which is a multi-swing-high resistance.
High Risk Investment Warning
Trading Forex/CFDs on margin carries a high level of risk and may not be suitable for all investors. Leverage can work against you.
Stratos Markets Limited (tradu.com):
CFDs are complex instruments and come with a high risk of losing money rapidly due to leverage. 63% of retail investor accounts lose money when trading CFDs with this provider. You should consider whether you understand how CFDs work and whether you can afford to take the high risk of losing your money.
Stratos Europe Ltd (tradu.com):
CFDs are complex instruments and come with a high risk of losing money rapidly due to leverage. 63% of retail investor accounts lose money when trading CFDs with this provider. You should consider whether you understand how CFDs work and whether you can afford to take the high risk of losing your money.
Stratos Global LLC (tradu.com):
Losses can exceed deposits.
Please be advised that the information presented on TradingView is provided to Tradu (‘Company’, ‘we’) by a third-party provider (‘TFA Global Pte Ltd’). Please be reminded that you are solely responsible for the trading decisions on your account. There is a very high degree of risk involved in trading. Any information and/or content is intended entirely for research, educational and informational purposes only and does not constitute investment or consultation advice or investment strategy. The information is not tailored to the investment needs of any specific person and therefore does not involve a consideration of any of the investment objectives, financial situation or needs of any viewer that may receive it. Kindly also note that past performance is not a reliable indicator of future results. Actual results may differ materially from those anticipated in forward-looking or past performance statements. We assume no liability as to the accuracy or completeness of any of the information and/or content provided herein and the Company cannot be held responsible for any omission, mistake nor for any loss or damage including without limitation to any loss of profit which may arise from reliance on any information supplied by TFA Global Pte Ltd.
The speaker(s) is neither an employee, agent nor representative of Tradu and is therefore acting independently. The opinions given are their own, constitute general market commentary, and do not constitute the opinion or advice of Tradu or any form of personal or investment advice. Tradu neither endorses nor guarantees offerings of third-party speakers, nor is Tradu responsible for the content, veracity or opinions of third-party speakers, presenters or participants.


This is why I am still Bullish until then The way I have been counting the market since march 23 th 2020 low this was the Bullish count . A diagonal I can come up with a lot of targets . I rather wait till I have 5 up I still think we break just above the BB bands we sure did at the low 4835 = was .786the wave 2 drop on Pct basis and was equal to on points . Best trades Wavetimer!
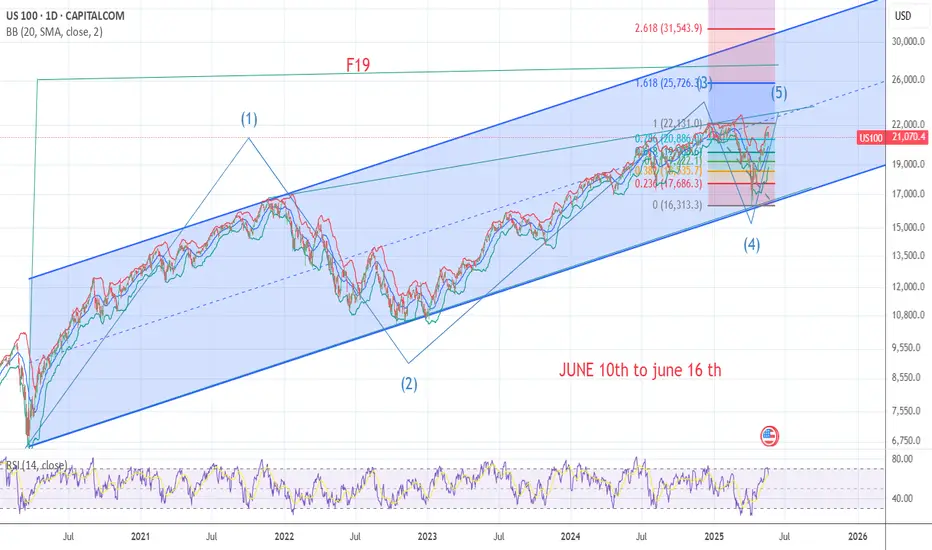
Going short on the Nasdaq 100CAPITALCOM:US100
The Nasdaq 100 has moved up impulsively on a 5-wave move over the past 6 weeks, which is very bullish long term. However, in the short term, it is overextended, with the RSI indicator over the 70 level.
I expect it to decline over the next couple of weeks to the area marked in the green rectangle, between the 50% and the 78.6% Fibonacci Retracement level.
I hope you find this interesting.
Good luck to you


Nas100Nas100 1H Analysis
• Peak Formation 1 = Start of the peak reversal cycle (Level 3 confirmed)
• Peak Formation High (PFH) or Low (PFL) = Price has likely reached the extreme zone and is reversing.
So, when you see:
• An M pattern on your chart
• And Peak Formation 1 on DashFix
It means:
The system has recognized a Level 3 stop hunt and shift, and it’s now marking this area as the potential high of the week (start of reversal cycle).
This is your confirmation zone that:
• The market has likely hit a weekly top
• It’s safe to look for short setups (after confirmation)
• It’s too risky to buy unless proven otherwise
⸻
3. What You Should Do (Execution Plan)
If you see M + Peak Formation 1:
Wait for:
• M pattern completion (two peaks, often 2–3 candles apart)
• 5 EMA & 13 EMA cross down on your entry time frame (M5 or M15)
• TDI confirmation (green crossing red downward near overbought)
• Price breaking the neckline of the M
Enter trade:
• Sell after confirmation (engulfing/rejection candle at M peak)
• Place stop loss above the high (trap candle or second leg)
• Target: 50–100 pips depending on ADR or prior support zones
⸻
4. Extra Tips
• Peak Formation 1 usually appears after New York session fakeouts or early Tuesday/Wednesday
• Avoid entering early during consolidation or inside the Asian range

Nasdaq Level 3 Behavior MAAWKey Trapping Techniques
• False Breakouts (above M or below W pattern)
• Session Open Spikes (especially NY open or London open)
• News Traps (spike during news, then reversal after)
⸻
3. TIMING: WHEN TO EXPECT LEVEL 3 MOVES
Look for session overlap (London/NY) — that’s often where the Level 3 “move away” happens.
⸻
4. WHAT TO LOOK FOR
Here’s your sniper checklist:
Before Entry
• Clear M or W pattern (preferably over 3 sessions)
• 3 levels or signs of MM cycle (Level 1, 2 already done)
• Price at ADR High/Low
• EMA Alignment (5/13 cross for confirmation)
• TDI Confirmation (green cross red, volatility band bounce)
• High Volume Candle showing shift
• Price is not at mid-range, but at extremes
⸻
5. WHAT TO AVOID
• Entering during consolidation
• Trading Level 1 (accumulation = trap zone)
• Trading directly at news time (wait for spike/reaction)
• Ignoring ADR (if ADR is already complete, expect reversal)
• Entering too early before confirmation candle
• Big stop losses — you want sniper entries with tight stops
Step 1: Mark the Previous Day’s High/Low
• Use ADR to mark extremes
• Expect stop hunt near these levels
Step 2: Identify M/W Forming
• Look for 3 peaks/bottoms
• Wait for the final push and reversal
Step 3: Watch Session Opens
• London/NY open is often the trigger zone
• Observe price action closely 15–30 mins after open
Step 4: Wait for Confirmation
• Engulfing / Pin bar / Rejection candle
• 5 & 13 EMA cross
• TDI green crossing red & bouncing off band or base
• Align with 800 EMA and 50 EMA direction
Step 5: Enter the Trade
• Enter at or near confirmation candle close
• Stop loss: Just outside the trap wick (10–20 pips)
• Take profit: 1:3 or ride with trailing stop
⸻
7. BONUS: HIDDEN TRICKS
• Draw M/Ws on the 5M but validate them on the 15M
• Use the 800 EMA to see where the overall bias is
• Mark the 1st leg of M/W — wait for trap above/below
• Timing matters more than signals — don’t force entries outside session windows
Disclaimer:
This idea is for educational and informational purposes only. It is not financial advice or an investment recommendation. I do not offer any financial services or paid mentorship. Always do your own research before making trading decisions.

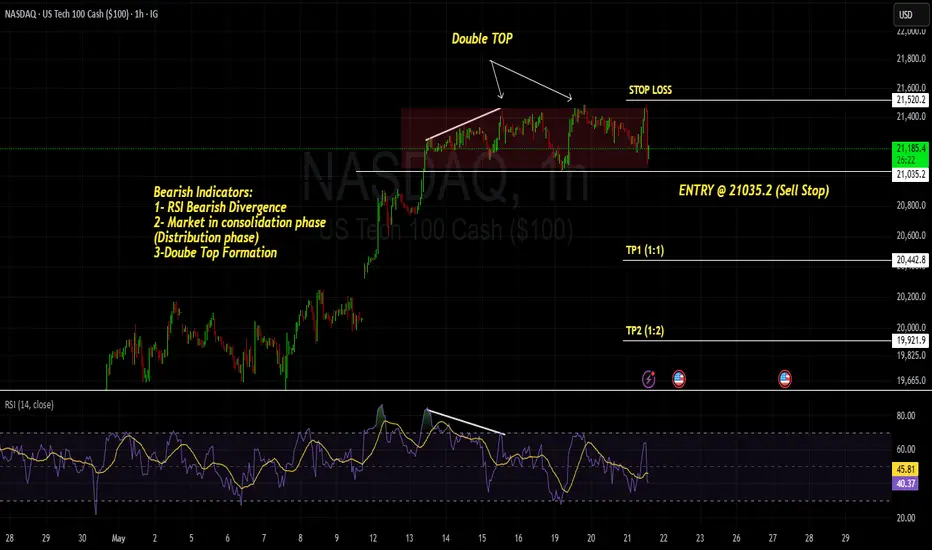
NASDAQ - SHORT SELL - AMAZING DOUBLE TOP PATTERN - REVERSAL patNASDAQ ; after forming series of HH and HLs is seem to be in distribution phase, we can see Divergence on RSI followed by Double TOP pattern which is a strong confluence for Reversal Pattern
we have a trade plan with our entry , once the accumulation phase (strong support) is broken as mentioned as ENTRY POINT (Sell Stop order) once our order is triggered we can place STOP loss above HL (or Resistance level) -
Our TPs would be TP1 with a Risk to Reward Ration 1:1 and other TP2 with R:R 1:2.
HAPPY TRADING GUYZ !!!!
"Better Trade your psychology and emotions, you will always be profitable"
Regards,
PROTRADEPROFESSOR
NASDAQ US100 - LONG IDEAThe next upward movement seems close, the upward trend line remains intact and we should have a breakout soon after days of accumulation.
BUY ZONE: 21.200 - 21.300
TAKE PROFIT 1: 21.750
TAKE PROFIT 2: 22.500
STOP LOSS: 20.990


