lazy bullsI guess we need something to make bulls work, cuz i don't know what we are doing if it is not buying.
NAS100 trade ideas

NASDAQ Bullish Breakout Above Channel;📈 Technical Analysis Overview
1. Breakout from Downtrend Channel
The price has clearly broken out of a descending channel, confirmed by a clean breakout above the upper trendline.
This is a bullish signal, indicating the end of the prior downtrend and the start of a possible uptrend or reversal.
2. Moving Averages (EMA 50 & EMA 200)
EMA 50 (Red): 18,965
EMA 200 (Blue): 19,409
Price is currently trading above both EMAs, which is another strong bullish indicator.
A bullish crossover (where EMA 50 crosses above EMA 200) is likely imminent if upward momentum continues—this would form a Golden Cross, further confirming bullish sentiment.
3. Structure and Market Behavior
After the breakout, price retested the breakout zone and showed a bounce, forming a higher low, which is characteristic of a bullish structure.
The chart includes projected price action with higher highs and higher lows—suggesting a bullish continuation pattern.
4. Volume & Momentum (Not shown but implied)
Breakouts are typically validated by volume. Although volume is not shown, the sharp upward movement and breakout above resistance suggest strong buying pressure.
🔍 Key Levels to Watch
Resistance: 20,000 psychological level; above that, 20,500–21,000 may act as resistance.
Support: 19,400 (near EMA 200), and 18,965 (EMA 50); a break below may invalidate the bullish setup.
📊 Conclusion
The chart shows a clear breakout from a descending channel, supported by the price moving above both key EMAs. The structure favors bullish continuation, especially if price holds above the 19,400–19,500 support zone. Upside targets lie around 20,500 to 21,000.

Nasdaq Bullish Reversal in Play !!📈 NASDAQ Outlook: Bullish Momentum Builds Up
✅ Breakout Confirmed: Price action has broken above the descending channel, signaling a reversal from the previous downtrend.
📊 EMA Crossover: The 50 EMA is crossing above the 200 EMA (a golden cross), historically a bullish indicator.
🔼 Momentum Strong: Price is accelerating above EMAs with a steep upward trajectory, suggesting buyers are in control.
🔮 Potential Target: With sustained momentum, price could aim for the 21,000+ region in the short term.
If the price sustains above the 19,500 zone, dips could be considered buying opportunities in the current bullish structure.

Nasdaq100/UsTech100 Higher Timeframe Analysis
Here we have my view, this is my first TV idea so don't butcher me please LMAO.
You can see on the chart we have had significant price moves to the upside over the past days after a huge decline in the index.
This decline was mostly driven by tarrif uncertainty to my understanding, followed me a huge panic sell off which spiraled the index further down.
However, with tarrifs seemingly easing and other factors driving the price increase, we will see 1 of 2 directions (Obviously).
Over the last few days we have been stuck in a major key level where buyers and sellers had a great fight. We have now broken that zone to the upside. I expect the index to have some sell pressure take over at around the 21,000 area give or take some points targeting the lower zone of 20,300 area.
This is where buyers had control pre tarrif implementation (21,000 PTS). Using the old saying of support becomes resistance and vice versa I expect the index to either stagnate in this zone for a while before breaking higher. Or it will simply sink back down to the lower key levels.
As it currently stands, The uptrend is back in tact on a higher time frame from what I can see. I am not saying here is a great place to long but with good risk management (For swing longs) this might be the confirmation we needed (Break of zone below) to enter long posistions with an SL of 20,000 area and TP of ATH giving a positive RRR trade.
I am personally a scalper hence why I do not post ideas. Usually the setup is done and dusted before I could even type it up XD.
Let me know what you think of the idea, Remember this is not financial advice. I am not liable for any losses incurred if you base your trades off my idea.
Remember trade what you see, not what you think.

NAS100 PRINTING REVERSALTechnically:
US100 printing double top
US100 printing bearish divergence
DXY is printing double top
DXY is printing bearish divergence
$NAS100 / $QQQ – The 200 SMA Breakout... or Bull Trap?📈 Nasdaq just charged through the 200-day moving average like it wasn’t even there. But if you zoom out, this level has acted as a brick wall before — and we may be walking straight into a trap.
🔍 Key Observations:
The last failed breakout above this zone led to a major rejection.
We're back at horizontal resistance from prior tops.
Price action resembles a Rope-a-dope move — run up, suck in longs, then rug pull.
⚠️ No real breakout without confirmation + volume. Don’t let the short-term green candles distract you from the macro ceiling above.

Silver Bullet 10am-11amPrior to previous idea shared. Setup to go long and fill FVG in 1hr-30min 930 Est. With no key level sweep, it was clear but risky as price needs to be balanced before challenging the highs or lows. As there was not clear Bearish BOS in NY. The NY low made after 930 used as sweep to enter and challenge FVG.
Trade managed well, secured profits at CE of 30min FVG in NY
5min IFVG in leg of sweep + counter FVG confirming bulls stepping in wit lows being manipulated. +- 1:2 secured.
Tomorrow same thing...$$$ ;)

NASDAQ broke above its 1D MA200 after 2 months! Target 22000.Nasdaq (NDX) broke today above its 1D MA200 (orange trend-line) for the first time in more than 2 months (since March 06), following the U.S. - Chine trade deal. This trend-line also had the March 26 rejection under its belt, which initiated the most aggressive part of the 'Trade War' correction.
The last time the index broke above its 1D MA200 on a similar pattern was when it was recovering after the bottom of the 2022 Inflation Crisis. The February 01 2023 break-out produced an instant rise to the 1.382 Fibonacci extension before a short-term correction to re-test the 1D MA200.
As a result, we expect 22000 (1.382 Fib ext) to come as early as this week before any discussions can be made for a new pull-back.
-------------------------------------------------------------------------------
** Please LIKE 👍, FOLLOW ✅, SHARE 🙌 and COMMENT ✍ if you enjoy this idea! Also share your ideas and charts in the comments section below! This is best way to keep it relevant, support us, keep the content here free and allow the idea to reach as many people as possible. **
-------------------------------------------------------------------------------
Disclosure: I am part of Trade Nation's Influencer program and receive a monthly fee for using their TradingView charts in my analysis.
💸💸💸💸💸💸
👇 👇 👇 👇 👇 👇

X2: NQ/US100/NAS100 Short - Day Trades 1:2X2:
Risking 1% to make 2%
NAS100, US100, NQ, NASDAQ Short for day trade, with my back testing of this strategy, it hits multiple possible take profits, manage your position accordingly.
Risking 1% to make 2%
Use proper risk management
Looks like good trade.
Lets monitor.
Use proper risk management.
Disclaimer: only idea, not advice

Hanzo : NAS100 15m: Bearish Confirmed After Liquidity Trap Done🔥 NAS100 – 15 Min Scalping Analysis (Bearish Setup)
Bias: Bearish
Time Frame: 15 Min
Entry Type: Confirmed Entry After Liquidity Sweep 20720
🩸 Key Reasons for Entry:
☄️Price manipulated above previous high (liquidity grab trap).
☄️Strong rejection from key supply zone with SMC confluence.
☄️Bearish order block + break of market structure.
☄️Entry respects higher timeframe resistance level.
🔤 Fair value gap / imbalance completed.
🔻Setup aligned with institutional reversal window
Target: Next 15M demand zone / 1:3+ RR
Status: trade active 👌

NASDAQ Fall? US100 AnalysisHello everyone.
We had a volatility at stock market last 2 month, it looks like market had good correction and found new buyer. BUT I DON'T THINK LIKE THAT.
After MR. Trump inauguration we saw bear market signals, it was like hedge funds dumped stocks, but after strong sell new buyers came at market and show us pretty good market correction but what will be next? The last 2 months brought intense volatility post-Trump’s inauguration. Hedge funds sold off heavily (S&P 500 dropped ~8% from its December high), but buyers stepped in, pushing a 5% retracement. RSI on SPY shows oversold conditions fading, yet I’m skeptical of this bounce.
Why? Bearish signals linger. VIX remains elevated (>20), and volume on up days is weaker than selloffs. Plus, geopolitics could derail this rally. Over the weekend, Ukraine and Russia discussed a 30-day ceasefire. If talks fail, the West’s new sanctions could spike oil prices (Brent crude already testing $80) and hammer energy-heavy indices like XLE or European markets (DAX).
I’m watching SPY’s 200-day MA (~510) as key support. A break below could signal a deeper pullback to 480. Energy and tech (QQQ) look vulnerable if sanctions hit. What’s your take—buying this dip or bracing for more downside?
Here is my 2 scene what i am expect from market, for me Scene and technical view scene 2 is more logical bur we will see what will be next step for stock market.
For collaboration text me in DM!!!
Always make your own research!!!

NAS100USD: Is this a False Break?Greetings Traders,
In today’s analysis on NAS100USD, we observe sustained bullish volatility, indicating that the institutional order flow remains decisively bullish. As such, our objective is to align with that momentum and seek opportunities to position ourselves accordingly.
Current Market Context:
Now entering the New York session, we can anticipate continued upward movement. A key technical development is the recent liquidity sweep—price action took out a set of sell stops, creating the appearance of a potential bearish break of structure. However, this movement aligns with a classic “Turtle Soup” scenario, where a false break is engineered to trap liquidity before the market resumes in its dominant direction.
Institutional Insight:
This sweep suggests that institutions have likely order paired against willing sellers, using their stops as entry liquidity. With that liquidity now absorbed and price rejecting lower levels, we look for bullish confirmations to join the smart money narrative.
Trading Focus:
We are now monitoring for lower-timeframe confirmation entries to validate bullish setups, ideally supported by institutional arrays or bullish order blocks that hold as support.
Let the market reveal the footprints of smart money—our role is to read and respond with discipline.
Regards,
The Architect

USTECH - LONG Market is in bullish trend with a trend line respect-
Entry Point at Fib Golden Level 0.382 and SL below last LH and TP 1 and TP2 (1:1) and (1:2)

Trade Idea - possible to outcomes2 potential scenarios. If the price action closes below the 1st dotted red line(MSS), we would expect the 30min iFVG to be respected as resistance, which would serve as our MSS + Displacement. The subsequent candle would then provide confirmation regarding the validity of the candle at 9am NY Time in relation to the next FVG to trade off to London Low.

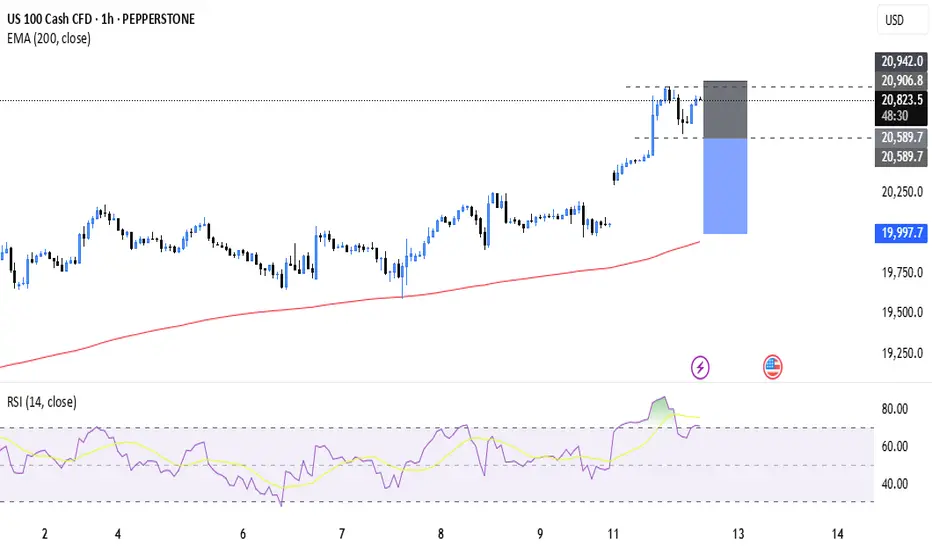
US100: Ready to Explode !!US100: Ready to Explode !!
Hey Traders,
Price is showing a bullish momentum on Nasdaq and created some bullish configurations, suggesting continuation to the upside.
Target : 20898.1 - 23599.4
#US100 #Nasdaq #BullishSetup #PriceAction #TechnicalAnalysis #FXTrading #Indices #ChoCH #TradeIdeas #StockMarket

USTEC on fireNAS/USTEC will show you a bullish move upto 22K, today we will witness a sharp move in NAS

US100 (4H): Short Position OpportunityHello Traders.
You may find more details in the chart!
Good Luck!
TP1: 18250
TP2: 17500
TP3: 16550
Please support with a like or comment if you find this analysis useful.❤️

5 May Weekly NAS100 Forecast USTECH: Trade Talks and Fed Decision in Focus
Analysis:
Markets are at a pivotal juncture as investors monitor two critical developments: the potential resumption of U.S.-China trade negotiations and the Federal Reserve's upcoming policy decision.
Trade Negotiations: Renewed dialogue between the U.S. and China could alleviate tariff pressures, stabilize global supply chains, and bolster investor confidence, thereby reducing recession risks.
Federal Reserve Decision: The Federal Open Market Committee (FOMC) is scheduled to meet on May 6–7, 2025. While the Fed is widely expected to maintain the current interest rate range of 4.25%–4.50%, market participants are keenly awaiting Chair Jerome Powell's commentary for insights into future monetary policy directions.
Market Bias: Cautiously Bullish
The confluence of potential trade resolutions and a steady monetary policy stance supports a cautiously optimistic outlook. However, market volatility may persist pending concrete developments.
Key Levels to Watch:
USTECH (NASDAQ 100):
Resistance: 20 531
Support: 19 481
Conclusion:
Investors should remain vigilant, monitoring both geopolitical developments and central bank communications, as these factors will significantly influence market trajectories in the near term.
---
Disclaimer: This analysis is for informational purposes only and does not constitute investment advice. Always conduct your own research before making trading decisions.
---

Stock Markets Rise Amid US–China Trade Deal ProgressStock Markets Rise Amid US–China Trade Deal Progress
As the chart shows, the Nasdaq 100 index (US Tech 100 mini on FXOpen) formed a bullish gap at Monday’s market open and, as of this morning, is trading at its highest level since early March.
This is driven by the announcement from the Trump administration of progress in securing a trade deal with China, following weekend negotiations held in Switzerland. Treasury Secretary Scott Bessent described the two-day talks with Chinese officials in Geneva as “productive”, adding that more detailed information would be shared on Monday.
As a reminder, the US imposed tariffs of 145% on Chinese goods, to which Beijing responded with a 125% levy on American imports.
Technical Analysis of the E-mini Nasdaq 100 Chart
The chart is showing bullish signals:
→ The downward trendline (shown in orange) was broken around the 19,666 level, which has since acted as support (indicated by the blue arrow).
→ Today, the Nasdaq 100 has moved above last week’s resistance near the 20,175 level.
→ Market fluctuations are forming an upward channel (shown in blue) from the April lows, with the price currently sitting in the upper half of the channel—typically a sign of strong buying pressure.
Further updates on the US–China trade deal may reveal key details, potentially reinforcing the current bullish sentiment in the equity markets.
This article represents the opinion of the Companies operating under the FXOpen brand only. It is not to be construed as an offer, solicitation, or recommendation with respect to products and services provided by the Companies operating under the FXOpen brand, nor is it to be considered financial advice.

NAS100 - Stock Market Expects a Devastating Week!The index is trading above the EMA200 and EMA50 on the 4-hour timeframe and is trading in its ascending channel. I expect corrective moves from the specified range, but if the index corrects towards the demand range, we can look for the next Nasdaq buy positions with a good risk-reward ratio.
U.S. stock futures responded positively to signals from both Chinese and American officials. Looking ahead to the coming week, investor focus is squarely on the Consumer Price Index (CPI) report from the United States—marking the first chance to assess the impact of the new tariffs implemented on April 9.
Meanwhile, ongoing trade negotiations between the U.S. and China remain a crucial factor, with significant implications for inflation, Federal Reserve policy, and overall market expectations. In addition to inflation data, retail sales figures and the preliminary results of the University of Michigan sentiment survey could influence market outlook regarding interest rates—especially since price stability and full employment remain core mandates of the Federal Reserve. At present, Fed officials are working to maintain a cautious stance in order to anchor inflation expectations. However, if clear signs of economic weakness emerge, that stance could shift rapidly—something that several Fed officials have already openly acknowledged.
Retail sales, in particular, could provide a different narrative about the health of the economy. After a notable 1.5% jump in March, estimates suggest that growth in April slowed to just 0.1%. This deceleration may reflect consumer reluctance to spend, stemming either from inflationary pressures or broader economic uncertainty.
Thursday’s data release will include the Producer Price Index (PPI), industrial production, and the Philadelphia Fed manufacturing index—offering a clearer picture of supply-side dynamics and the performance of the industrial sector.
On Friday, attention will turn to a fresh batch of economic indicators: building permits, housing starts, the New York (Empire State) manufacturing index, and especially the University of Michigan’s preliminary consumer sentiment survey. This survey has gained importance in recent months due to notable increases in both one-year and five-year inflation expectations. As recent charts indicate, while consumer confidence has plummeted to multi-year lows, inflation expectations have trended upward—a worrisome combination that could limit the Fed’s ability to ease monetary policy.
Although concerns about a U.S. recession persist, recent data suggest more of a “gradual slowdown” rather than signs of an imminent crisis. In March, both the CPI and PCE indices declined, indicating a temporary easing of inflationary pressures. However, this trend may reverse in April, as the broad implementation of reciprocal tariffs likely raised import costs—particularly for Chinese goods, which now face duties as high as 145%.
New estimates indicate that these tariffs could add 2.25% to core inflation over the next year, effectively reversing the progress made in 2024 on taming price pressures.Prior to the Trump administration’s tariff announcements, economists had differing views on inflation, with some expecting it to approach the Fed’s 2% annual target by year-end. Contrary to trade experts, Trump claimed that sellers would not pass these price increases on to consumers.
Goldman Sachs’ analysis this week suggests that Trump’s tariffs could push inflation to levels not seen since the post-pandemic price surge. The broad import taxes announced between February and April may have a substantial impact on the economy, and consumers are likely to feel the effects first at the checkout counter. Goldman economists estimate that the tariffs could drive annual inflation—as measured by core Personal Consumption Expenditures (PCE)—to 3.8% by December, marking the highest rate since 2023. The Fed’s preferred inflation gauge rose 2.6% last year.
This metric remains above the Fed’s 2% target and has shown limited progress toward that goal since 2023. The last time inflation was below this benchmark was in January 2021.
A renewed wave of price increases could severely strain American household budgets—particularly if the labor market also weakens, as many economists anticipate. This would also represent a significant setback for the Federal Reserve, which has kept interest rates elevated since 2022 in an effort to combat post-pandemic inflation.
While inflation hovered around 3% at the beginning of 2024 with little change, it saw a notable drop in March. Many analysts forecast that inflation will continue to decline and approach the 2% target by the end of 2025.
Walker and Peng’s analysis factored in both the direct effects of tariffs—most of which will likely be passed on to consumers—and several indirect consequences. The trade war has unexpectedly weakened the U.S. dollar, reducing Americans’ purchasing power.
Moreover, some manufacturers may shift production away from China, where tariffs are particularly severe, to locations with higher production costs. As a result, American consumers may end up paying significantly more for imported goods, especially in categories like consumer electronics and apparel.

Technical Breakdown on US 100 | 1H TimeframeTechnical Breakdown on US 100 Cash CFD (1H) using Volume Profile, Gann, and CVD + ADX
1. Key Observations (Volume, Gann & CVD + ADX Focused)
a) Volume Profile Insights:
Value Area High (VAH): 20,500
Value Area Low (VAL): 20,000 (approx. based on volume shading)
Point of Control (POC): 20,062.08
High-volume nodes: Dense around 20,050–20,100 – indicative of value acceptance.
Low-volume gaps: Sharp price movement through 20,150–20,250 – price could revisit here swiftly.
b) Liquidity Zones:
Stop Cluster Zones:
Order Absorption Zones:
c) Volume-Based Swing Highs/Lows:
Swing High Volume Spike: Near 20,500 – rejection occurred with CVD flattening.
Swing Low Volume Spike: 20,000 – strong reversal point, indicates buyer interest.
d) CVD + ADX Indicator Analysis:
Trend Direction: Uptrend currently, but potential divergence forming.
ADX Strength:
CVD Confirmation:
2. Support & Resistance Levels
a) Volume-Based Levels:
Support:
Resistance:
b) Gann-Based Levels:
Recent Confirmed High: 20,506
Recent Confirmed Low: 20,000
Retracements:
3. Chart Patterns & Market Structure
a) Trend: Short-term Bullish, but with early signs of divergence (based on projected price/CVD path)
Confirmed by breakout above POC with rising CVD initially.
b) Notable Patterns:
Ascending Channel Breakout: Strong push above upper boundary on momentum.
Volume Gap Fill Potential: Price may return to 20,250 or lower on exhaustion.
POC Retest Scenario: High probability of price testing 20,062 if strength fades.
4. Trade Setup & Risk Management
a) Bullish Entry (If uptrend sustains):
Entry Zone: 20,250–20,300 (channel midpoint or pullback after breakout)
Targets:
Stop-Loss (SL): 20,150 (below volume gap midpoint)
RR: Minimum 1:2
b) Bearish Entry (If divergence confirms):
Entry Zone: 20,500–20,525 (fakeout/stop hunt zone)
Target:
Stop-Loss (SL): 20,600
RR: Minimum 1:2
c) Position Sizing: Risk 1–2% of capital per trade.

Shot opportunities Nasdaq has been on uptrend so today let look for that pullback. Keep in mind that you will be going against the trend .
Another thing most traders knows that gap down there must be filled before moving taking a very long trend 😉

NAS100 Reaches Major Supply Zone – Will Bulls Hold or Fade?The NAS100 has just broken into a major supply zone around 20,139 – 20,470, previously tested in late April and early May. This zone has historically triggered sell-offs, as seen from the previous price reactions.
Key Levels:
Resistance Zone: 20,139 – 20,470 (Visible Supply Zone)
Mid Support: 18,830 (Strong bounce level in April)
Demand Zone: 16,948 – 17,300 (Price base with historical accumulation)
What I'm Watching:
If bulls break and hold above 20,470, we could see a new bullish leg higher.
Failure to hold this zone could bring a sharp retracement toward 18,830 or even 16,948.
Upcoming U.S. economic events marked on the chart may be the catalyst for the next move.
Trade Ideas:
Short-Term Bears: Look for rejection candles or fake breakouts at current highs.
Trend Traders: Wait for a confirmed breakout and retest above 20,470 for longs.
Swing Buyers: Watch for bullish setups around 18,830 or the demand zone at 16,948.
Volume Profile + LuxAlgo Zones confirm this supply and demand setup. Smart money tends to react at these extremes—watch closely!
