US100: Ready to Explode !!US100: Ready to Explode !!
Hey Traders,
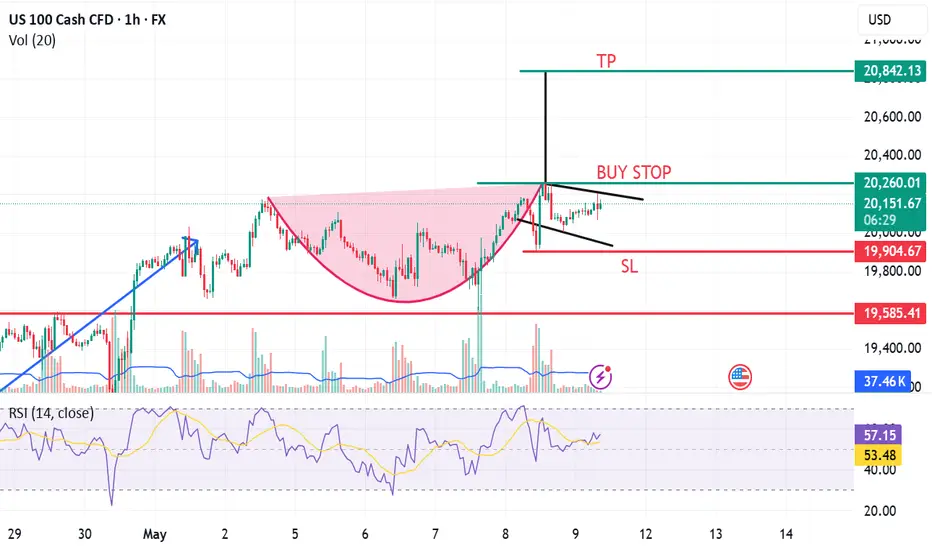
Price is showing a bullish momentum on Nasdaq and created some bullish configurations, suggesting continuation to the upside.
Target : 20898.1 - 23599.4
#US100 #Nasdaq #BullishSetup #PriceAction #TechnicalAnalysis #FXTrading #Indices #ChoCH #TradeIdeas #StockMarket
NAS100 trade ideas

will the technical indicators catch up for the great melt up?!its my first published chart where i look at the broader picture. Weekly+ indicators dont seem to support the popular melt up, although the market is moving up but the TA isnt backing up the rocket rise. Maybe another flush on the way to finalize it!

swing entry modellooking into a range gives you access to directions. proper selection of the valid liquidity pull allowing access to opposing liquidity pull. This works in both bullish and bearish cases. This is also known as market structure
Fingers didn't want to work today with typing my apologies

4h Range - 1h raid and m5 PAMy standard model of the flow. Accumulation / Manipulation/ Distribution

NQ: Upcoming Weekly Analysis!FA Analysis:
1- We have two forces (Trump's team, policy and tweets and the FED) as market movers.
2- Trump's Team: Maintaining the UNCERTAINTY
- Minimum tariffs is 10% which is at least 500% of the original tariffs.
- Have a clear strategy: One screaming very high and the other one, the nice guy, offers 10-25% tariffs
- All the deals won't be binding deals; so they might change at any time. So uncertainty is still there.
- It's all about PR and looking good and winning
- Market understands very well what is happening. Market sees the 10% tariffs as a huge barrier.
=) So all what Trump is doing, including the final/big deals, are bad for stocks and equities.
3- The FED:
- Last FED did not provide any hint about June rate cut. FED is data related.
- Last macro-economic data did not help the FED Rate cut. Hence, the upcoming data is very relevant.
- This week, we have key inflation data: CPI and PPI. Higher Inflation data means NO June Cut which is very bad for stocks and equities. Inline and lower inflation data will help FED Cut which is good for stocks and equities.
=) From now on, Good macro-economic data is bad for stocks and equities and vice-versa.
TA Analysis:
Weekly TF:
- From weekly perspective, we got a bullish weekly candle than closed inside a bullish candle.
- Price seems exhausted and toppish. There is no need to go further up. But in any case, the chart shows two higher levels that price might reach in the case of bad economic data.
Daily TF:
- Friday candle was unable to close above the latest HH.
- Price always closed inside the consolidation area.
- Price will test the previous swing low (highlighted by a circle) in case Monday or US-China talks does not close above the latest HH.
=) From weekly and daily TF, NQ should go south.
Wish you a green week Everyone! GL!
(Note: I won't be around this week beside quick in and out; So I won't post most likely)

REPEATING 2022 PATTERN?We humans love to see patterns so we can try to understand our own existence and our perception of almost everything.
Very interesting comparison between 2022 and 2025. Though market conditions seem different we can see clearly the failed attempt to break above de 200 SMA in 2022. It may repeat again.

NASDAQ 100 on dayly This NASDAQ 100 chart shows an inverted Head and Shoulders pattern. The "head" is near 18,800, with the "left shoulder" and "right shoulder" around 19,200-19,400. The neckline is at approximately 19,800, and the price has broken above it, indicating a bullish reversal. The measured target is around 22,800, based on the pattern's height projected upward.

nas100 next move? 📈 NAS100 Market Update
NAS100 is currently trading around 19,500 and is forming a running flat wave pattern.
This structure is setting up for a potential move towards the 20,000 target.
Stay alert — the breakout could be strong!

US100 - Correction Required Before Next Major Rally PhaseThe US Tech 100 index is showing signs of exhaustion after a strong recovery rally from April lows, with price action now facing resistance at the upper blue box around 20,200. The index appears to be forming a short-term top as momentum wanes, evidenced by recent candle patterns displaying indecision and inability to sustain new highs. The downward-pointing red arrow suggests a likely move toward the middle support zone around 19,000, which would represent a healthy correction of about 5-6% from current levels. This pullback would help reset overbought technical indicators and potentially shake out weak hands before establishing a stronger foundation for the next leg higher. Given the sharp rally we've witnessed from the April lows near 16,400, this correction would be technically justified and provide a more sustainable launching pad for continuation of the longer-term uptrend once complete.
Disclosure: I am part of Trade Nation's Influencer program and receive a monthly fee for using their TradingView charts in my analysis.

US NAS100Preferably suitable for scalping and accurate as long as you watch carefully the price action with the drawn areas.
With your likes and comments, you give me enough energy to provide the best analysis on an ongoing basis.
And if you needed any analysis that was not on the page, you can ask me with a comment or a personal message.
Enjoy Trading ;)


The RangeThe area at which Nas100 is ranging is a very manipulative area whereby there is a high possibility that continuation of buys might occur, induction of sellers by sweeping lows within a premium area might cause us trouble

US100 BEARS ARE STRONG HERE|SHORT
US100 SIGNAL
Trade Direction: short
Entry Level: 20,075.8
Target Level: 19,221.3
Stop Loss: 20,643.2
RISK PROFILE
Risk level: medium
Suggested risk: 1%
Timeframe: 9h
Disclosure: I am part of Trade Nation's Influencer program and receive a monthly fee for using their TradingView charts in my analysis.
✅LIKE AND COMMENT MY IDEAS✅

US100 continues its bullish TrendUS100 continues its bullish Trend. Fundamental & sentiments after FOMC meeting appears to be favorable for equity markets.


X2: NQ/US100/NAS100 Long - Day Trades 1:2X2:
Risking 1% to make 2%
NAS100, US100, NQ, NASDAQ Long for day trade, with my back testing of this strategy, it hits multiple possible take profits, manage your position accordingly.
Risking 1% to make 2%
Use proper risk management
Looks like good trade.
Lets monitor.
Use proper risk management.
Disclaimer: only idea, not advice

NSDQ100 INTRADAY uptrend continuationUS-China Trade Talks:
The Trump administration is considering cutting tariffs on Chinese goods to below 60% during upcoming talks. China may reciprocate. Chinese exports to the US have already dropped sharply following earlier steep tariffs.
Global Market Reaction:
Germany's DAX index hit a new high, recovering losses from the trade war. European stocks are rising on hopes of lower tariffs and potential rate cuts from the European Central Bank.
US Tax Policy:
Trump is urging Congress to raise taxes on the wealthy, proposing a 39.6% rate for individuals earning $2.5 million or more (or $5 million for couples).
Panasonic Job Cuts:
Panasonic plans to cut 10,000 jobs to improve profitability by focusing on growth areas and reducing operations in weaker sectors like TVs and industrial devices.
Key Support and Resistance Levels
Resistance Level 1: 20530
Resistance Level 2: 20730
Resistance Level 3: 20950
Support Level 1: 19640
Support Level 2: 19325
Support Level 3: 19030
This communication is for informational purposes only and should not be viewed as any form of recommendation as to a particular course of action or as investment advice. It is not intended as an offer or solicitation for the purchase or sale of any financial instrument or as an official confirmation of any transaction. Opinions, estimates and assumptions expressed herein are made as of the date of this communication and are subject to change without notice. This communication has been prepared based upon information, including market prices, data and other information, believed to be reliable; however, Trade Nation does not warrant its completeness or accuracy. All market prices and market data contained in or attached to this communication are indicative and subject to change without notice.

NAS100USD: Discount Reversal & Bullish Continuation NarrativeGreetings Traders,
In today’s analysis on NAS100USD, we observe the market operating within a bullish institutional order flow—a clear signal for us to align with the prevailing momentum and look for high-probability buying opportunities.
Market Context:
The market has established a well-defined bullish swing, followed by a retracement that delivered price action deep into discount territory. Within this zone, a prior low was taken out, serving as a liquidity grab where institutions could execute order pairing—buying against the willing sellers (sell stops) positioned at discounted prices.
Key Observations:
Optimal Entry Zone: Price retraced into the 62%–79% Fibonacci levels, historically considered the optimal reversal zone. Following this, we observed a rejection—an early indication of bullish re-engagement.
Breaker Block Alignment: The rejection coincides with a breaker block array, a zone where previous selling orders are mitigated and fresh institutional buying begins. This strengthens the validity of the expected reversal.
Bullish Continuation Signs: Post-rejection, price action confirmed a shift in market structure, and prior order blocks have now begun to act as bullish support arrays.
Trading Strategy:
With institutional footprints aligning at key technical zones, I am anticipating further upside. Upon receiving confirmation on the lower timeframes, I will look to enter buy positions, aiming to target the liquidity pools resting in premium prices—the next logical draw for institutional interest.
Stay focused, follow the smart money, and let the structure guide your entries.
Kind Regards,
The Architect


Technical Breakdown on US 100 | 1H TimeframeTechnical Breakdown on US100 Cash (NASDAQ CFD) – 1H Timeframe using Volume Profile, Gann, and CVD + ADX
1. Key Observations (Volume, Gann & CVD + ADX Focused)
a) Volume Profile Insights:
Value Area High (VAH): 19,964.8
Value Area Low (VAL): 19,799.3
Point of Control (POC): 19,936.4 (current session), 19,817.5 (previous session)
High-volume nodes: 19,850 – 19,950 (sustained consolidation and acceptance)
Low-volume gaps: 20,000 – 20,070 (inefficient move up; could act as a magnet on retrace)
b) Liquidity Zones:
Stop clusters likely at:
Above 20,125 (recent high and breakout level)
Below 19,800 (previous rejection and consolidation)
Absorption zones: Near 19,820–19,850, where strong wicks and CVD upticks indicated passive buyers stepping in
c) Volume-Based Swing Highs/Lows:
Swing High: 20,125.8 (sharp rejection, low follow-through volume)
Swing Low: 19,713.4 (high absorption, spike in CVD)
d) CVD + ADX Indicator Analysis:
Trend Direction: Bullish (CVD rising, price confirming higher highs)
ADX Strength: ADX ~22, DI+ > DI- → Confirmed uptrend
CVD Confirmation:
Rising CVD + rising price = strong demand
Momentum stalling near 20,125, signaling potential short-term pullback
2. Support & Resistance Levels
a) Volume-Based Levels:
Support:
VAL: 19,799.3
POC: 19,936.4
Swing low: 19,713.4
Resistance:
VAH: 19,964.8
Swing high: 20,125.8
b) Gann-Based Levels:
Recent swing low: 19,713.4
Retracement levels (from 20,125.8 high to 19,713.4 low):
1/3: 19,850.9
1/2: 19,919.6
2/3: 19,988.3
3. Chart Patterns & Market Structure
a) Trend: Bullish (ADX > 20 with CVD and price agreement)
b) Notable Patterns:
Bullish channel breakout forming
Retest of 19,936 POC aligning with previous breakout level
Potential continuation pattern (ascending wedge forming within purple projection channel)
4. Trade Setup & Risk Management
a) Bullish Entry (CVD + ADX confirm uptrend):
Entry Zone: 19,925 – 19,940 (POC + Gann midpoint)
Targets:
T1: 20,070 (gap fill)
T2: 20,125 (recent high)
Stop-Loss (SL): Below 19,799 (VAL / swing low)
RR: Minimum 1:2
b) Bearish Entry (If rejection near swing high + falling CVD):
Entry Zone: 20,120 – 20,125
Target:
T1: 19,936 (POC)
Stop-Loss (SL): Above 20,150
RR: Minimum 1:2
c) Position Sizing:
Risk only 1-2% of capital per trade

Nas100 buy London sessionI'm more focused on the 15min orderblock to be respected. anything outside that I'm not taking trades.

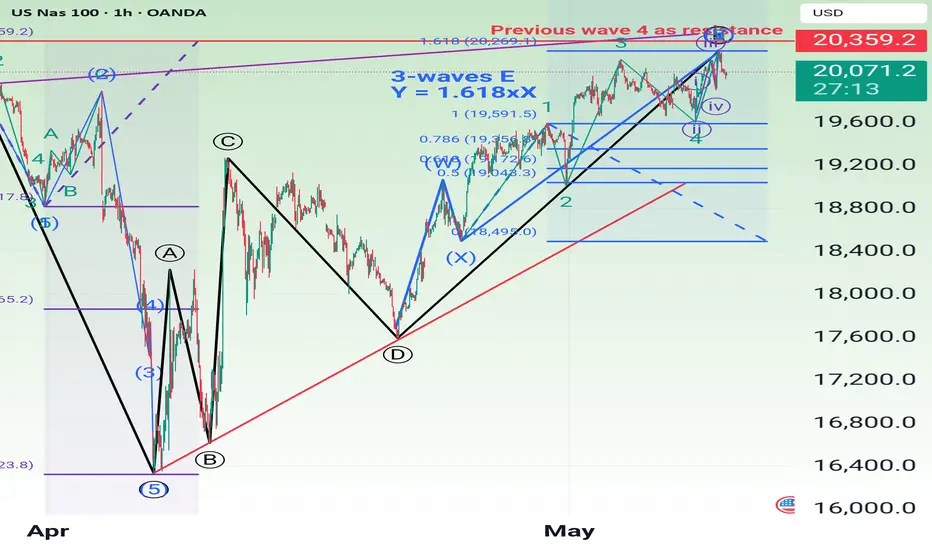
Nasdaq Short: completion of wave structureA few days back, on the weekend, I posted an idea about pending short but price went down first to create a 4th wave before going back up to complete the price target last night. So, this is the updated wave count. Wait for retracement to short. Stop above the high.