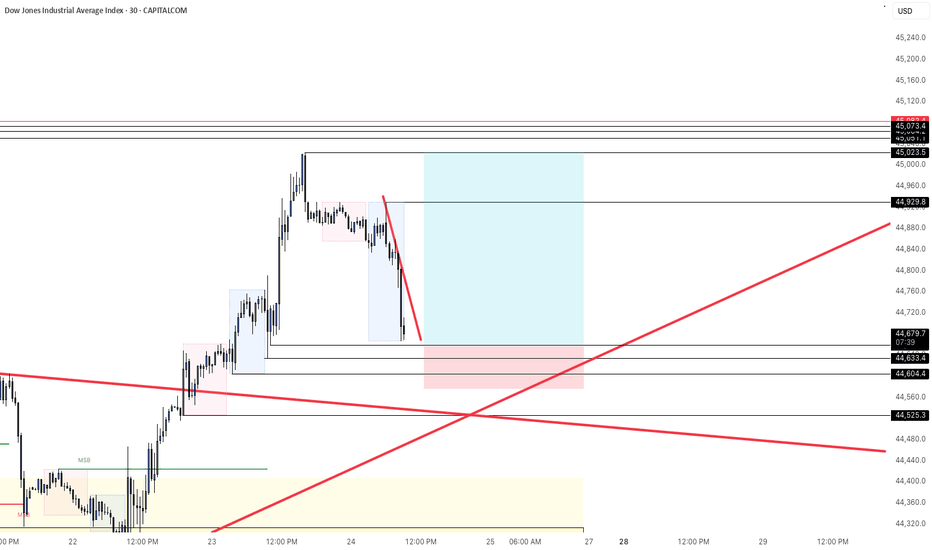
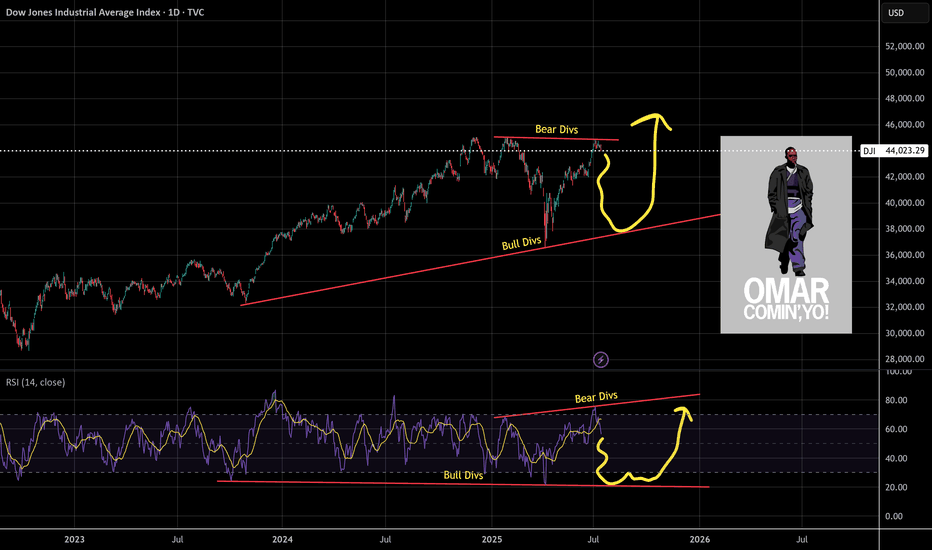
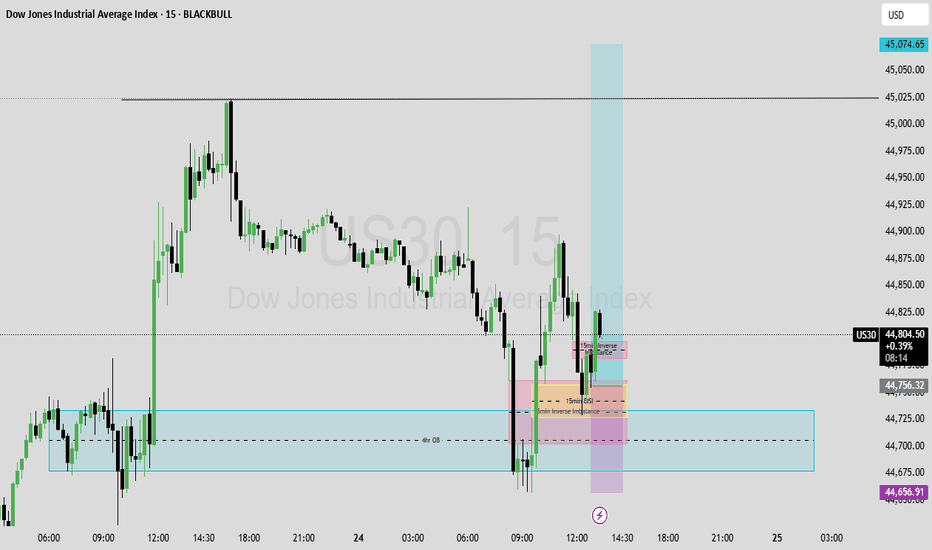
US30 3D IdeaPotential for a bearish pullback on the US30 3D which could lead to a price movement towards the support level at 38400. SELL levels from 41900Shortby GOLDFXCC2
US30 Sells Idea for the New York SessionUnless we see some news come out on tariffs, we could see some downside on US30 today. It is falling inside a wedge pattern right now, and I expect the price action to fall within that wedge with a potential to go down during the New York session. I will be waiting for a break of the upper green zone (around 42150), then a pullback and rejection, to take sells down towards the 42000 (and possibly lower) areas. I am not looking for any buys on US30 today, unless I see some really big green candles towards the upside during the 9:30 am EST.Shortby CandleStickGuruUpdated 4
Moustafa! My analysis and view for US 30! on 16.03.2025!- I expected a huge bearish wave would hit the index by end of December and also in January and I sat an idea for it and it was right and that is the new idea - On the weekly frame, you would notice that the index is in a rising channel - Formed a double top pattern and even broke the neckline of it and is supposed to go to minimum the Take profit 2 then after the retrace towards the take profit 3 - The index retraced to the upside due to the uptrend line in green and there is a possibility that it could continue the bullish run but I do not expect here that a weekly candle would close above the neckline before reaching to the below TPs - The lower weekly candles wicks from 15.04.2024 and 05.08.2024 must be filled anyway, which is giving another confirmation to the validation of this idea concept and the continuation of the bearish wave on the weekly chart! we could see on the way some retracements on the daily frame and the lower frames, but that will not have any influence on the bigger bearish image! - The index had broken already the uptrend line (in red) which was not broken from October 2023! and the last week candle closed under the moving average 50! - By reaching to the TP3, means that the index would go to the lower line of the rising channel -- Conclusion is that we are in a bearish market on the weekly chart and the real target is exactly when the index will reach to the line (in yellow) I sat also another idea for Nasdaq which I see also there the continuation of the big bearish wave on the weekly chart! so feel free to have a look on too! so all is going in harmony together! Shortby moustafa_mareiUpdated 1111
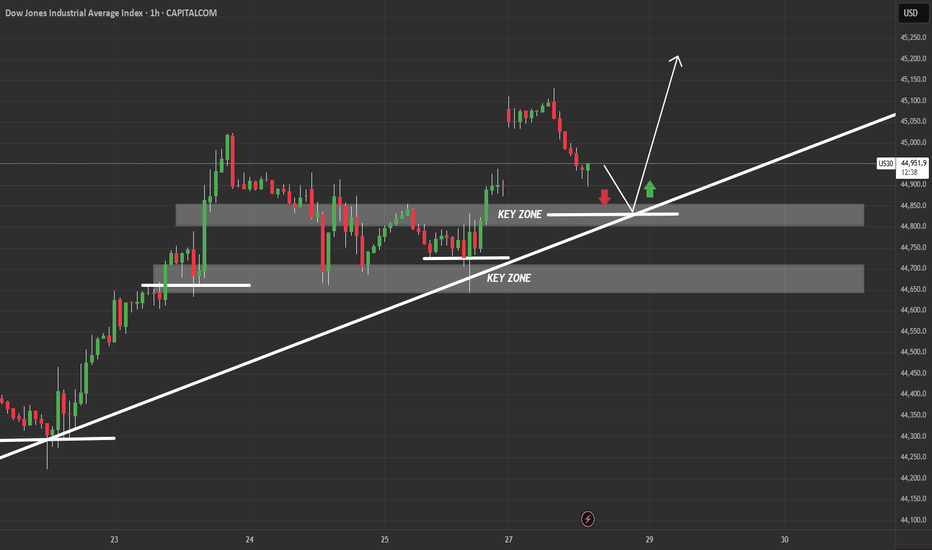
Dow Jones ChannelEverything seems ready for the climb. On the one-hour timeframe, the 200 MA and the channel floor are ready to support the price, and a great rally is likely in store for the Dow Jones. Longby habinator3
US30 Trade Outlook – 31/03/2025🚨 US30 Trade Outlook – 31/03/2025 🚨 📊 Market Structure & Key Levels US30 is currently consolidating after a steep selloff from the 42,800s. Price is sitting near short-term support at 41,434, but momentum remains bearish unless bulls step in fast. 🔍 Key Observations: 🔻 Strong Bearish Momentum – Sharp drop from resistance zones 🔹 Support Holding (for now): 41,400 🔻 Breakdown Risk: Below 41,400 opens the door toward 40,678 🎯 Trade Plan: 🔻 Short if 41,400 fails → Target 40,678 🔹 Long only if price reclaims 41,800+ and EMAs flip bullish ⚠️ Wait for clean confirmations – no chasing moves. by h4rVey1
Dow Jones on the weekly chartAs you can see, due to recent economic news and Trump's economic approaches, we have unfortunately witnessed a decline in major indices, including the Dow Jones. We are currently at the last available support level, which is the bottom of the Dow Jones long-term channel, and we need to see how it reacts to this level in tomorrow's news and the CPI release.Longby AbedEkhlaspoorUpdated 5
Dow Jones: Double-Top Signals Heightened VulnerabilityThe Dow Jones Industrial Average (DJI) closed at 41985 on Friday, up 0.08%, maintaining its position above critical support at 41330. The index has dropped more than 6% since the start of the pullback from highs of 45073 in January 2025. The long-term bullish price structure that has lasted over two years remains intact; however, a double-top formation at recent highs and the observed weakness in the current quarter suggest a vulnerability in the long-term price structure, particularly around 42732 and 42248. Should it fail to maintain support at 41330, the index could collapse below the bullish structure. If it holds above this critical support, a temporary rebound targeting 42248, 42732, and 43388 is possible before the price declines again. Reflecting on past market corrections, the index fell 38% in February 2020 and 22% in January 2022. This time, the situation may differ due to the current political and economic climate shaped by the US administration. If we experience a four-stage pullback, the index could decline to 39062, 36794, and 34526, resulting in a correction of over 23%. Should it fall below 34526, there is potential for a deeper dive into bear territory, reaching 32257 with a correction exceeding 28%.Shortby Rotuma2
US30 Analysis SCENARIO 1 (sells) Gold is in a bullish momentum, so the current bearish move in conjunction with the trump tariffs should have us see a good retest zone back to the upside with continious bad news occuring in the US Recent high impact events have been in the red (when you see a red number that means that the release of certain data was lower than what was expected) In the upcoming weeks, we have the Standard & poors global manufacturing PMI and the S&P Global services PMI with the consensus for each to be 51.9 and 51.2 which is accounting for a drop in the S&P Manufacturing PMI but a 0.2 % increase in the S&P global services PMI for beginners, understand that these are economic indicators to show people how a courntries economy is doing with Manufacturing PMI leading towards the production of goods in the US. Now I believe that both actual results when released will be negative due to the fact that the current tariff hits have been hurting the US. This will lead to a bearish market open on the Nasdaq and US30 indices and a buy on gold. Why this is so is a lower number than the consensus (the consensus refers to a healthy number for the economy to "be at" for that month) meaning a lower result than what they have put will lead to a brief economic panic with investors taking sells on their postitions on the top 30 and 100 businesses (nasdaq and US30) and the further sells on the US market from retail investors will cause a greater bearish move on Monday. Now the reason why Gold goes up is because it is a security, safe haven for investors. When Investors take their cash out of their stocks and when their is more economic stress then there will be more reason to invest into a safe commodity like gold. More news to note is the tesla stock crash which is a driving factor of the current losses in the Nasdaq and the S&P and the Dow jones. The upcoming tariffs will see a downturn in the market. Now that is my bet, we need to add these fundamentals in with perfect technical anlysis entry points SCENARIO 2 (buys) For buys everything oposite to the sells will occur meaning that if a positive number above consensus happens then there may be a brief period of buysShortby StellenboschCapital4
US30 4h swing bearish 4h fractal just shift to bearish from clear supply 15 min swing gonna shift to bearish , liq-swept , waiting for confirmation.. if condition fullfil then will definitely go short but in kill-zone hours.Shortby skk158346
US30USD - 5 year old analyse Letting my 5 year old chart :) Looks like we have a consensus that the market is "poo poo" and there is a lot of crying, rainbows and storms arising. The elephant could be interpreted as "Trump"by Gold_Fish_Trading4424
Dow Jones Analysis for the Coming DaysEntering a buy position on the Dow Jones requires confirmation on the 15-minute timeframe after breaking out of the classic triangle, with a risk-free position around the 42,500 level. If the price breaks out of the triangle and then pulls back with strong momentum—most likely intended to shake out retail traders and trigger stop hunts—it is possible to enter with a larger-than-usual position and a very tight stop-loss. If the support level is broken, the analysis will be considered invalid. The "strong momentum pullback" to the support level refers to the red rectangle. If the price returns to the support zone with very strong momentum, an entry can be taken with a very tight stop-loss.by Trdbhm2000Updated 2
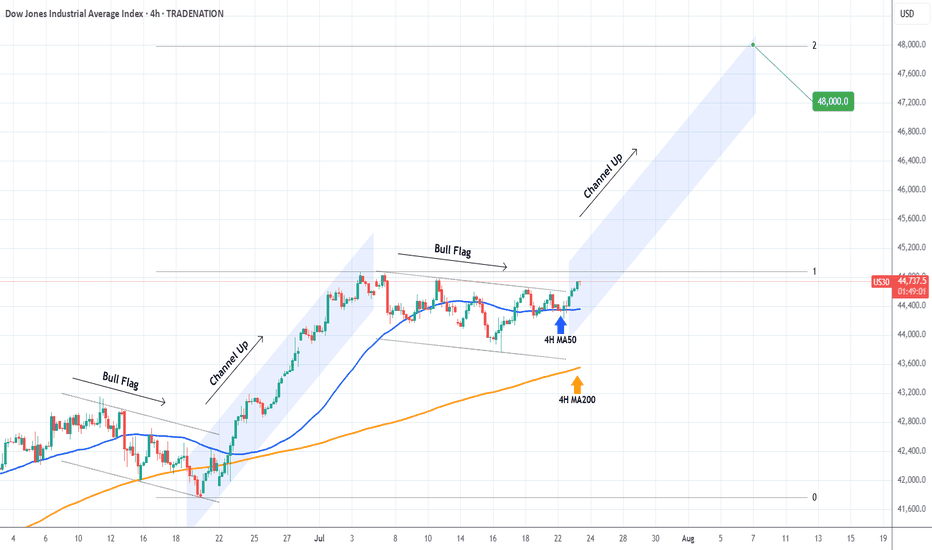
DOW JONES targeting 50000 on this final Bull yearDow Jones / US30 posted the first green weekly candle after hitting last week the 1week MA50. This is obviously a critical support level as it has been holding since the October 30th 2023 rebound. As this chart shows, Dow has been repeating the same patterns, Cycle after Cycle. Right now it has entered the Final Year of Bull, which is the part where it rises aggressively to form the Top before the new Bear begins in the form of a Megaphone pattern. The previous Bull peaked on the 2.382 Fibonacci extension of the Megaphone. This means that a 50000 Target for Dow is perfectly plausible by the end of 2025. Follow us, like the idea and leave a comment below!!Longby TheCryptagon119
Dow Jones INTRADAY Bearish oversold bounce backKey Support and Resistance Levels Resistance Level 1: 42488 Resistance Level 2: 43067 Resistance Level 3: 43575 Support Level 1: 40657 Support Level 2: 40109 Support Level 3: 39584 This communication is for informational purposes only and should not be viewed as any form of recommendation as to a particular course of action or as investment advice. It is not intended as an offer or solicitation for the purchase or sale of any financial instrument or as an official confirmation of any transaction. Opinions, estimates and assumptions expressed herein are made as of the date of this communication and are subject to change without notice. This communication has been prepared based upon information, including market prices, data and other information, believed to be reliable; however, Trade Nation does not warrant its completeness or accuracy. All market prices and market data contained in or attached to this communication are indicative and subject to change without notice. by TradeNation2
Order Block @41594|Buy SignalPrice created a Break of structure and retested to an order block and went on to create another break of structure and the retraced to sweep liquidity and mitigate an order block. Now I'm waiting for a confirmation in order to open a buy position.Longby Freddie_Smart_Money4
US30This is our View on US30, we do believe US30 will be playing around sideways before tapping close to 40K level and then will give us a buy setup for long term. Disclosure: We are part of Trade Nation's Influencer program and receive a monthly fee for using their TradingView charts in our analysis.by WeTradeWAVES1
US30 Short - Broke Ascending TrendUS30 has broke ascending trendline. I'm monitoring FVG's to fill orders. US30 currently trading below Daily Open price which is also in favor for a short.Shortby ASRIELFX4
High Probability or Nah?Is this setup justified, or is it just a seen Gap that SMT default settings had us spot? by TheDemoTrader_SA224
Dow Jones Industrial Average ($US30): Market Mover or Stumbling?(1/9) Good afternoon, everyone! ☀️ Dow Jones Industrial Average ( BLACKBULL:US30 ): Market Mover or Stumbling Block? With the Dow at $42,407.80, is this blue-chip index a steady climber or a shaky step? Let’s chart the course! 🔍 (2/9) – PRICE PERFORMANCE 📊 • Current Price: $ 42,407.80 as of Mar 24, 2025 💰 • Recent Move: Up 0.8% from $41,985.35 on Mar 21, per data 📏 • Sector Trend: Mixed with tech, aerospace gains 🌟 It’s a bumpy climb—let’s see what’s driving it! ⚙️ (3/9) – MARKET POSITION 📈 • Composition: 30 U.S. blue-chip firms, all sectors but transport, utilities 🏆 • Trend: Volatile but up 1.2% weekly as of Mar 21, per data ⏰ • Sentiment: Cautious optimism amid trade tensions 🎯 Firm but tested by macro winds! 📊 (4/9) – KEY DEVELOPMENTS 🔑 • Fed Update: Rates steady, economic uncertainty up, per data 🌍 • Sector Gains: Boeing up 7% on Air Force deal, per data 📋 • Market Reaction: Dow up after tariff reprieve hopes 💡 Navigating a stormy market! 🌪️ (5/9) – RISKS IN FOCUS ⚡ • Trade Tensions: U.S.-China tariffs spark inflation fears 🔍 • Economic Slowdown: Consumer sentiment at 2022 lows 📉 • Policy Shifts: Trump tariffs add uncertainty ❄️ It’s a rocky path—watch the curves! 🛑 (6/9) – SWOT: STRENGTHS 💪 • Blue-Chip Base: 30 industry leaders 🥇 • Sector Gains: Tech, aerospace lift index 📊 • Resilience: Up 12.7% from 52-week low 🔧 Got a sturdy engine under the hood! 🏦 (7/9) – SWOT: WEAKNESSES & OPPORTUNITIES ⚖️ • Weaknesses: Volatility, 5.9% off peak 📉 • Opportunities: Rate cut hopes, tech rebound 📈 Can it climb higher or stall out? 🤔 (8/9) – POLL TIME! 📢 Dow at $42,407.80—your take? 🗳️ • Bullish: $44,000+ soon, rally resumes 🐂 • Neutral: Steady, risks balance out ⚖️ • Bearish: $40,000 looms, correction deepens 🐻 Chime in below! 👇 (9/9) – FINAL TAKEAWAY 🎯 Dow’s $42,407.80 price shows cautious gains 📈, but volatility’s in the air 🌿. Dips are our DCA fuel 💰—buy low, ride high! Gem or bust? Longby DCAChampion3
US30 Trade Outlook – 27/03/2025📊 Market Structure & Key Levels US30 is showing signs of exhaustion after a strong bullish leg. Price is currently consolidating below 42,787 – 42,872, a key resistance zone. Bulls must break this area cleanly to maintain momentum. 🔍 Key Observations: ✅ EMAs Flipping – Price dancing around EMAs, showing indecision. ✅ Resistance Holding – 42,787 – 43,021 still capping upside. ✅ Support Zones – 42,200 and 41,529 are levels to watch for a deeper pullback. 🎯 Trade Plan: 🔻 Short if price fails to break 42,872 → Target 42,200, then 41,600 🔹 Long if price clears 43,021 with strength → Target 43,400 – 43,600 ⚡ Let price lead. No bias. Confirmation is key. by h4rVey1
us30This Analysis Can Change At Anytime Without Notice And It Is Only For educational Purpose to Traders To Make Independent Investments Decisions. Disclaimer The information and publications are not meant to be, and do not constitute, financial, investment, trading, or other types of advice or recommendations supplied or endorsed by TradingView Shortby kF_pippinright1
US30 SELL?The market is currently testing the current Weekly 0.618 Fib Area and based on 4HR TF, the market seems to be forming a possible reversal pattern which could lead to a possible reversal. We could see SELLERS coming in strong should the current level hold. Disclaimer: Please be advised that the information presented on TradingView is solely intended for educational and informational purposes only.The analysis provided is based on my own view of the market. Please be reminded that you are solely responsible for the trading decisions on your account. High-Risk Warning Trading in foreign exchange on margin entails high risk and is not suitable for all investors. Past performance does not guarantee future results. In this case, the high degree of leverage can act both against you and in your favorShortby WiLLProsperForex2
US30/DJI "Dow Jones" Index CFD Market Heist Plan (Day or Swing)🌟Hi! Hola! Ola! Bonjour! Hallo! Marhaba!🌟 Dear Money Makers & Robbers, 🤑 💰💸✈️ Based on 🔥Thief Trading style technical and fundamental analysis🔥, here is our master plan to heist the US30/DJI "Dow Jones" Index CFD Market. Please adhere to the strategy I've outlined in the chart, which emphasizes long entry. Our aim is the high-risk Red Zone. Risky level, overbought market, consolidation, trend reversal, trap at the level where traders and bearish robbers are stronger. 🏆💸Book Profits Be wealthy and safe trade.💪🏆🎉 Entry 📈 : "The heist is on! Wait for the MA breakout (42200) then make your move - Bullish profits await!" however I advise to Place Buy stop orders above the Moving average (or) Place buy limit orders within a 15 or 30 minute timeframe most recent or swing, low or high level. 📌I strongly advise you to set an alert on your chart so you can see when the breakout entry occurs. Stop Loss 🛑: Thief SL placed at the recent/swing low level Using the 1H timeframe (41400) swing trade basis. SL is based on your risk of the trade, lot size and how many multiple orders you have to take. 🏴☠️Target 🎯: 43100 (or) Escape Before the Target 🧲Scalpers, take note 👀 : only scalp on the Long side. If you have a lot of money, you can go straight away; if not, you can join swing traders and carry out the robbery plan. Use trailing SL to safeguard your money 💰. US30/DJI "Dow Jones" Index CFD Market Heist Plan (Swing/Day) is currently experiencing a bullishness,., driven by several key factors. 📰🗞️Get & Read the Fundamental, Macro, COT Report, Geopolitical and News Analysis, Sentimental Outlook, Intermarket Analysis, Index-Specific Analysis, Positioning and future trend targets.. go ahead to check 👉👉👉 📌Keep in mind that these factors can change rapidly, and it's essential to stay up-to-date with market developments and adjust your analysis accordingly. ⚠️Trading Alert : News Releases and Position Management 📰 🗞️ 🚫🚏 As a reminder, news releases can have a significant impact on market prices and volatility. To minimize potential losses and protect your running positions, we recommend the following: Avoid taking new trades during news releases Use trailing stop-loss orders to protect your running positions and lock in profits 💖Supporting our robbery plan 💥Hit the Boost Button💥 will enable us to effortlessly make and steal money 💰💵. Boost the strength of our robbery team. Every day in this market make money with ease by using the Thief Trading Style.🏆💪🤝❤️🎉🚀 I'll see you soon with another heist plan, so stay tuned 🤑🐱👤🤗🤩Longby Thief_TraderUpdated 11