Dollar on the move now after the news - as expectedQuick follow up on other videos
Dollar is heading strong towards our target as outlined for the last few weeks. If you followed all my videos you would see where markey technicals came into play the last few weeks
Beautiful read on this
USDX trade ideas

Dollar Index Eyes FVG Breakout Ahead of CPIDXY 11/06 – Dollar Index Eyes FVG Breakout Ahead of CPI | Reversal Risk After 100.31?
The US Dollar Index (DXY) continues to consolidate within a rising channel on the H2 timeframe, with price tightening just ahead of a key macro event — the US CPI report. DXY is now approaching a critical Fair Value Gap (FVG) zone, where liquidity hunts and potential reversals become highly probable.
🌐 MACRO OUTLOOK & MARKET SENTIMENT
📌 US CPI (June 12):
The main macro driver for DXY this week.
A hotter-than-expected print → strengthens the Fed’s hawkish stance → DXY likely to spike.
A weaker-than-expected CPI → boosts rate cut expectations → downside pressure on DXY.
📌 Risk Sentiment:
Institutions are readjusting their exposure ahead of CPI and FOMC. This has caused DXY to hover near EMA89 — a sign of indecision.
📌 Cross-asset Flows (Bonds & Gold):
Treasury yields are stable, but surprises in CPI could lead to capital rotation between gold and USD, increasing volatility in XAUUSD and DXY simultaneously.
📈 TECHNICAL ANALYSIS
Trend Structure:
DXY is following a clean ascending channel on H2, with higher lows respecting the lower trendline.
EMA Confluence (13–34–89–200)
Price is consolidating near EMA89 and below EMA200 (99.40), forming a neutral short-term bias.
A clean breakout above EMA200 could trigger acceleration into the FVG zone.
Key FVG Zone (H2):
99.63 – 100.31 is an unfilled Fair Value Gap.
This zone may act as a magnet for price before any meaningful rejection or breakout.
Potential Reversal Area:
A rejection at 100.31 could trigger a sharp pullback toward the liquidity zone around 98.68.
🧠 STRATEGIC OUTLOOK
CPI will set the tone for DXY’s mid-term trend.
Watch the 99.63 – 100.31 FVG zone for liquidity sweeps and potential rejection.
Wait for confirmation, not prediction — especially in macro-sensitive environments.

Dollar - Slowly Drifting downQuick video on Yesterdays/Todays price action in relation to our target

CRYPTO CORRELATION WITH DXYThe U.S. Dollar Index (DXY) is probing 99-100—the same lower-rail support of its 14-year ascending channel that caught the 2011, 2015 and 2021 inflection points and launched the 2016 and 2022 dollar surges
macrotrends.net
forex.com
. History shows that when the dollar sinks beneath this zone (April 2017 and June 2020) Bitcoin has ripped 10-fold or more within months
cointelegraph.com
, whereas a sharp bounce from here (September 2022 above 110) coincided with BTC’s plunge to the cycle low near $16 k
forex.com
coindesk.com
. The macro backdrop currently favours at least a reflex rally: the Fed’s latest survey and dot-plot point to “higher-for-longer” policy with only two cuts pencilled in for 2025
reuters.com
finance.yahoo.com
, 10-year Treasuries still yield about 4.7 %—a near-cycle high that supports dollar carry demand
wsj.com
, and U.S. growth has just been revised up to 2.7 % for 2025 while euro-area PMIs languish in contraction and the ECB is already easing
mdm.com
ecb.europa.eu
. Add in lingering negative BTC-DXY correlation metrics
coindesk.com
and the structural importance of the psychologically charged 100 level, and this pivot becomes a practical timing gauge: a sustained break below 99 would clear the way for the next broad crypto bull-phase, whereas a confirmed dollar rebound warns that any exuberance in digital assets could mark a cyclical top.

DXY Analysis - Framing TradesHere is a DXY analysis and more guidance on how to frame trades using ICT concepts, at least the way I use it.
-R2F Trading

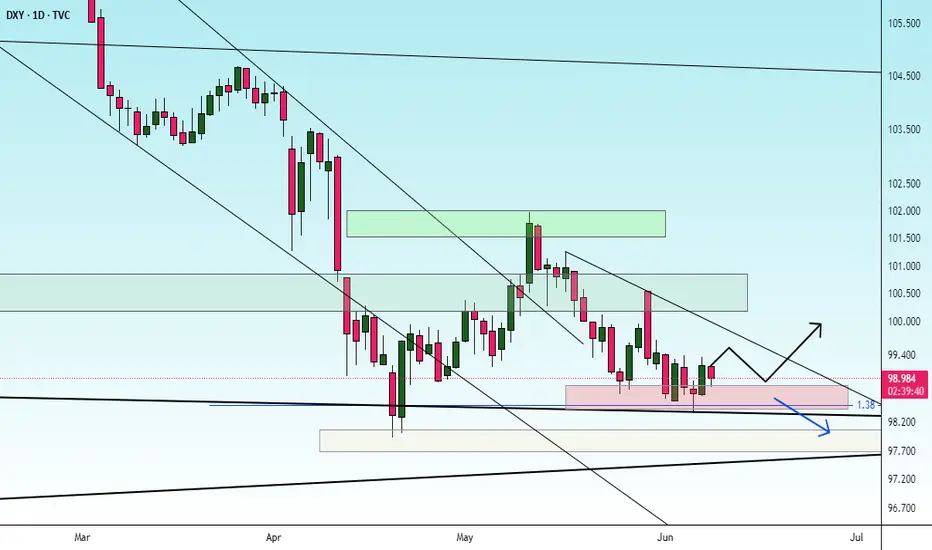
Possibility of uptrend It is expected that after some fluctuation and correction in the support area, a trend change will take place and we will witness the start of an upward trend. A break of the green resistance area will be a confirmation of the upward trend. Otherwise, the continuation of the corrective trend to the support areas will be possible.

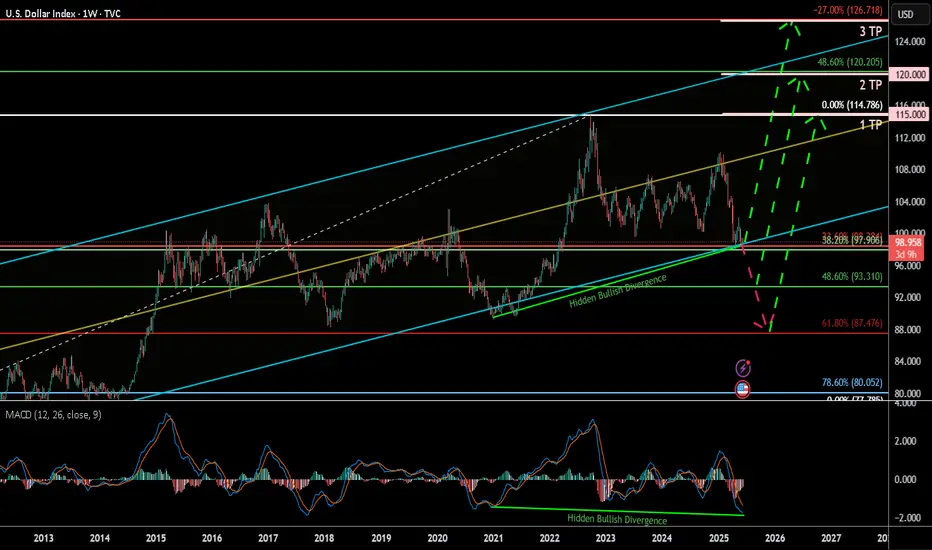
U.S. Dollar Index (DXY) Weekly 2025Summary:
The U.S. Dollar Index (DXY) has corrected down to the key 38.60% Fibonacci retracement zone and is currently showing signs of a potential bullish reversal, bolstered by a clear hidden bullish divergence on the MACD. This may signal a renewed rally toward key upside targets, especially if the 93.3–99.9 support Zone holds.
Chart Context:
Current Price: 98.864
Key Fib Support: 38.60% @ 99.906, 48.60% @ 93.310, 61.80% @ 87.476
Support Zone: 93.3–99.9 USD
Hidden Bullish Divergence: Observed both in 2021 and now again in 2025 on the MACD
Trendline Support: Long-term ascending trendline holding since 2011
Fib Extension Targets (Trend-Based):
TP1: 115.000
TP2: 120.000
TP3: 126.666
Key Technical Observations:
Fibonacci Confluence: DXY is bouncing from a strong Fib cluster between 93.310 and 99.906, historically acting as a reversal zone.
Hidden Bullish Divergence: Suggests potential upside despite price weakness.
Downtrend Retest: Price may revisit 93.3–87.4 before confirming full reversal.
Breakout Pathway: Green dashed arrows outline the likely recovery trajectory toward 114–126 range.
Indicators:
MACD: Showing hidden bullish divergence and potential signal crossover.
Trendline Support: Holding intact from 2021 low.
Fib Levels: Used for retracement and trend-based extension.
Fundamental Context:
Interest Rate Outlook: If U.S. inflation remains controlled and Fed signals future hikes or sustained high rates, DXY strength may persist.
Global Liquidity & Recession Risk: If risk aversion returns, the dollar may rise as a safe haven.
Geopolitical Risks: Conflicts, trade tensions, or BRICS dedollarization efforts may create volatility.
Our Recent research suggests the Fed may maintain higher-for-longer rates due to resilient labor markets and sticky core inflation. This supports bullish USD bias unless macro shifts rapidly.
Why DXY Could Continue Strengthening:
Robust U.S. economic performance & monetary policy divergence
U.S. GDP growth (~2.7% in 2024) outpaces developed peers (~1.7%), supporting stronger USD
The Fed maintains restrictive rates (4.25–4.50%), while the ECB pivots to easing, widening the policy and yield gap .
Inflation resilience and Fed hawkishness
Labor markets remain tight, keeping inflation “sticky” and delaying expected rate cuts; market-implied cuts for 2025 have been pushed into 2026
Fed officials (e.g. Kugler) emphasize ongoing tariff-driven inflation, suggesting rates will stay elevated.
Safe-haven and yield-seeking capital flows
With global risks, capital favors USD-denominated assets for yield and stability
Why the Dollar Might Face Headwinds
Fiscal expansion & trade uncertainty
Ballooning U.S. deficits (~$3.3 trn new debt) and erratic tariff policy undermine confidence in USD
Wall Street’s consensus bearish position.
Major banks largely expect a weaker dollar through 2025–26. However, this crowded bearish sentiment poses a risk of a sharp rebound if data surprises occur
barons
Tariff policy risks
Trump's new tariffs could dampen dollar demand—yet if perceived as fiscal stimulus, they could unexpectedly buoy the USD .
Synthesis for Our Biases
A bullish DXY thesis is well-supported by:
Economic and policy divergence (U.S. growth + Fed vs. peers).
Hawkish Fed commentary and sticky inflation.
Safe-haven capital inflows.
Conversely, risks include:
Deteriorating fiscal/trade dynamics.
Potential Fed pivot once inflation shows clear decline.
A consensus that could trigger a short squeeze or reversal if overstretched.
Philosophical / Narrative View:
The dollar remains the world’s dominant reserve currency. Periodic dips often act as strategic re-accumulation phases for institutional capital—especially during global macro uncertainty. A return toward 120+ reflects this persistent demand for USD liquidity and safety.
Bias & Strategy Implication:
1. Primary Bias: Bullish, contingent on support at 93.3–99.9 holding.
2. Risk Scenario: Breakdown below 93.3 invalidates bullish thesis and targets 87.4–80 zones.
Impact on Crypto & Gold and its Correlation and Scenarios:
Historically, DXY has had an inverse correlation to both gold and crypto markets. When DXY strengthens, liquidity tends to rotate into dollar-denominated assets and away from risk-on trades like crypto and gold. When DXY weakens, it typically acts as a tailwind for both Bitcoin and gold.
Correlation Coefficients:
DXY vs. Gold: ≈ -0.85 (strong inverse correlation)
DXY vs. TOTAL (crypto market cap): ≈ -0.72 (moderate to strong inverse correlation)
Scenario 1: DXY Rallies toward 115–126 then, Expect gold to correct or stagnate, especially if yields rise. Crypto likely to pull back or remain suppressed unless specific bullish catalysts emerge (e.g., ETF flows or tech adoption).
Scenario 2: DXY ranges between 93–105 then Gold may consolidate or form bullish continuation patterns. Then Crypto may see selective strength, particularly altcoins, if BTC.D declines.
Scenario 3: DXY falls below 93 and toward 87 Then Gold likely to rally, possibly challenging all-time highs. Crypto could enter a major bull run, led by Bitcoin and followed by altcoins, fueled by increased liquidity and lower opportunity cost of holding non-USD assets.
Understanding DXY’s direction provides valuable insight for portfolio positioning in macro-sensitive assets.
Notes & Disclaimers:
This analysis reflects a technical interpretation of the DXY index and is not financial advice. Market conditions may change based on unexpected macroeconomic events, Fed policy, or geopolitical developments.
DXY for short *The content on this analysis is subject to change at any time without notice, and is provided for the sole purpose of assisting traders to make independent investment decisions.

USXUSD Potential HOTWI would like to see a H4 BOS on USX.
IF we get the H4 BOS, I am looking at a CPI & PPI Delivery lower for DXY towards April Lows.
Let's see....

Dollar Still on TargetWe have come back to the NFP high and last weeks high again. Stabbed through them but still below the order block as higlited last week before NFP.
Looking for a run lower now on USD.


DXY Asia delivery to London Delivery Analysis DXY
Asia delivery to London Delivery Analysis
JUNE 10 FRAMEWORK
*Monday was a sell off
*Current range is premium
*Previous range is a discount
*Minor buy side taken in dealer range
*Sell side liquidity was taken at open of Asia
Is today a raid the equal lows and a buy day?
*Asia expanded rallied to equal highs
*Retraced to the session .618 and consolidated
*Previous session discount coming into London
*I suspect that dxy might make a high of the week today and attack the major buy side
Great analysis and great delivery. This is builds my confidence. Where I struggle to trust it when it comes time to react and make the trade I see rather than the noise I get stuck in.
Very happy price played out to the Asia expansion and the highs I felt at 5 am I suspected for price to take. Celebrate what you can and keep going.

Bullish bounce?US Dollar Index (DXY) has bounced off the pivot which lines up with the 50% Fibonacci retracement and could rise to the 1st resistance.
Pivot: 98.91
1st Support: 98.36
1st Resistance: 99.60
Risk Warning:
Trading Forex and CFDs carries a high level of risk to your capital and you should only trade with money you can afford to lose. Trading Forex and CFDs may not be suitable for all investors, so please ensure that you fully understand the risks involved and seek independent advice if necessary.
Disclaimer:
The above opinions given constitute general market commentary, and do not constitute the opinion or advice of IC Markets or any form of personal or investment advice.
Any opinions, news, research, analyses, prices, other information, or links to third-party sites contained on this website are provided on an "as-is" basis, are intended only to be informative, is not an advice nor a recommendation, nor research, or a record of our trading prices, or an offer of, or solicitation for a transaction in any financial instrument and thus should not be treated as such. The information provided does not involve any specific investment objectives, financial situation and needs of any specific person who may receive it. Please be aware, that past performance is not a reliable indicator of future performance and/or results. Past Performance or Forward-looking scenarios based upon the reasonable beliefs of the third-party provider are not a guarantee of future performance. Actual results may differ materially from those anticipated in forward-looking or past performance statements. IC Markets makes no representation or warranty and assumes no liability as to the accuracy or completeness of the information provided, nor any loss arising from any investment based on a recommendation, forecast or any information supplied by any third-party.

DXY reversed upDXY reversed up.
I am assuming the dxy pattern as below, if there is a strong recovery in dxy then gold will fall sharply, I think gold to fall to 3000.

DOLLARThe relationship between the US dollar (USD), the 10-year Treasury bond yield, and bond prices is tightly interconnected and crucial for global markets.
1. 10-Year Bond Yield and Bond Price
Inverse Relationship:
As the yield on the 10-year Treasury rises, the price of the bond falls, and vice versa. This is because the bond’s coupon payment is fixed; when new bonds are issued with higher yields, existing bonds with lower coupons become less attractive, so their prices drop to compensate.
Recent Movement:
In May and early June 2025, the US 10-year Treasury yield rose from 4.18% to around 4.50%, a move of over 30 basis points, driven by strong economic data and expectations that the Federal Reserve will keep rates higher for longer.
2. 10-Year Bond Yield and the Dollar (DXY)
Direct Relationship:
Generally, when the 10-year Treasury yield rises, the US dollar strengthens. Higher yields attract foreign investment into US assets, increasing demand for USD.
Recent Example:
After the stronger-than-expected May jobs report, the 10-year yield jumped to 4.50% from 4.3% on thursday and the dollar index (DXY) also rose, reflecting investor expectations of prolonged high US rates and robust economic performance.
3. Bond Price and the Dollar
When bond prices fall (and yields rise), it often signals expectations for higher interest rates or inflation, both of which tend to support a stronger dollar as investors seek higher returns in USD assets.
Conversely, when bond prices rise (and yields fall), it can indicate economic uncertainty or expectations of rate cuts, which may weaken the dollar.
Key Takeaway
Rising 10-year Treasury yields lead to falling bond prices and typically a stronger US dollar, as higher yields attract global capital seeking better returns.
This dynamic is especially pronounced when strong US economic data or hawkish Fed expectations are in play, as seen in the recent market reaction to the robust US jobs report.
#dxy#dollar #gold

check the trendThe downtrend is expected to end at the current support level and an uptrend will begin. Otherwise, if the support level is broken, the downtrend could continue to the next support level.
DXY DownHaven't posted here in quite awhile, however just have been following trends watching bonds, stocks and bitcoin/gold. Looking at the DXY it appears to have fallen below the 100-101 level support and has since been rejected by that region on a weekly time frame. The support/resistance levels and trends line within have been charted for years and left unchanged. RSI is in the oversold territory but that can remain low for quite a long time, especially if the trend changes. I think the DXY goes to 90 over the next 6 months to 1 year.
Bullish for stocks, bitcoin, gold etc. Who is the fastest horse?

DXY: Target Is Up! Long!
My dear friends,
Today we will analyse DXY together☺️
The market is at an inflection zone and price has now reached an area around 98.471 where previous reversals or breakouts have occurred.And a price reaction that we are seeing on multiple timeframes here could signal the next move up so we can enter on confirmation, and target the next key level of 98.594.Stop-loss is recommended beyond the inflection zone.
❤️Sending you lots of Love and Hugs❤️

Is the dollar's a trend or temporary?📊Technical Analysis for:
🕒 Timeframe:
📈 General Trend:
🔍 Analysis Summary:
We are currently observing a rebound from the 98.400 level.
• Major Support Level:
• Resistance Level:
• Technical Indicators: We note that this correction is due to divergence.
🎯 Suggested Entry and Exit Points:
✅ Entry: Upon a breakout/rebound from
⛔ Stop Loss:
🎯 Targets:
• First Target:
• Second Target:
📌 Recommendation:
– It is recommended to wait for confirmation of the technical signal before making a decision.
🛑 Disclaimer:
This analysis is not considered financial advice or a direct buy or sell recommendation. Do your own research and carefully consider risk management before making any decisions.
📥 Do you agree with this analysis? Share your opinion in the comments!
🔁 Follow me for daily analysis. ICEUS:DX1! ICEUS:DX1!

US DOLLAR MARKET FORECASTA 30 minute change in price delivery bullish is within the 4 hour range.
I sense that the 4 hour higher low is in place, with price drawn to attack the high.

Dollar - Still going for TargetAs mentioned in the video on Friday 2 min before NFP. We could run higher on the dollar and i didnt want it to take out the 4 hour candle as shown here.
Go back and see the video for reference. Link below
We should head towards the Target now and im still bearish dollar. Very Bearish

Monday Market Outlook Get ahead of the markets with this week’s essential macro insights! In this session, we break down the most impactful upcoming events affecting DXY, XAUUSD, and BTCUSD — including the FedWatch Tool outlook, yield curve shifts, and how to interpret changing rate expectations. If you want to understand how the macro backdrop could influence your trades, this video is a must-watch.
👉 Learn how to spot opportunities before the move happens.
📉 Rate cut? 📈 Rate hike? 📊 We’ll show you what the market is really pricing in.

Eur, Gbp & DXY Dynamics: We have reached fair valueWith equilibrium being established we are stuck in an internal liquidity range. We do expect the trending targets to be hit although we are seeing a preliminary shift in structure.
If there was anything I missed in this analysis please let me know. Share this with anyone who may be interested 🙏🏾
