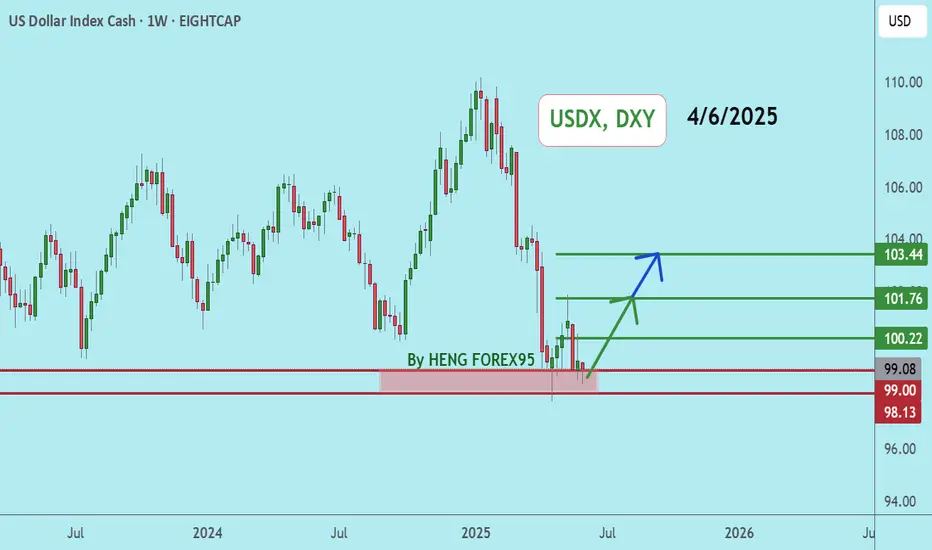
DXY POTENTIAL LONG|
✅DXY will soon retest a key support level of 98.000
So I think that the index will make a rebound
And go up to retest the supply level above at 99.088
LONG🚀
✅Like and subscribe to never miss a new idea!✅
Disclosure: I am part of Trade Nation's Influencer program and receive a monthly fee for using their TradingView charts in my analysis.
USDX trade ideas

DOLLAR INDEX The higher-than-expected US Unemployment Claims (247K actual vs. 236K forecast) suggest emerging softness in the labor market, increasing the likelihood of Federal Reserve rate cuts in 2025. Here’s how this data impacts the Fed’s policy outlook:
Key Implications for the Fed
Labor Market Cooling:
The uptick in claims aligns with recent trends of slowing payroll growth (Q1 2025 average: 152K jobs/month vs. Q4 2024: 209K) and a stagnant unemployment rate near 4.2%.
Fed projections already anticipate unemployment stabilizing around 4.3% in 2025, but persistent claims increases could signal risks to their "maximum employment" mandate.
Rate Cut Probability:
The Fed has maintained rates at 4.25–4.50% since May 2025 but emphasized data dependence. Weak labor data strengthens the case for cuts, with markets now pricing in a ~60% chance of a September rate cut (up from ~50% pre-data).
The Fed’s March 2025 projections flagged rising unemployment as a risk, with some participants favoring earlier easing if labor conditions deteriorate.
Inflation Trade-Off:
While unemployment claims rose, wage growth remains elevated (ADP reported 4.5% YoY pay gains in May). The Fed will weigh labor softness against sticky inflation, particularly in services (ISM Prices Paid index at 68.7).
A cooling labor market could ease wage pressures, aiding the Fed’s inflation fight and enabling cuts without reigniting price spikes.
Market Impact
DXY (Dollar Index): Likely to weaken further as rate cut expectations rise. Immediate support at 98.40, with a break targeting 97.00
Equities/Gold: Potential gains as lower rates boost risk assets and non-yielding gold.
Bond Yields: 10-year Treasury yields may retreat below 4.40% if markets price in dovish Fed action.
What’s Next?
June 6 NFP Report: A weak jobs number (<150K) would solidify rate cut bets.
June 11 CPI Data: Lower inflation could give the Fed confidence to cut sooner.
Fed Decision (July 31): Odds of a cut rise if labor data continues to soften.
Conclusion
The Fed is likely to prioritize labor market stability over inflation concerns if unemployment claims persist above 240K. While a July cut remains possible, September is the most probable start date for easing, contingent on confirming data.
#DOLLAR #GOLD #DXY

Bretton Woods 2.0?Examining the long-term trend of TVC:DXY since the 1980s, we might be facing a staggering 40% reduction in valuation, potentially landing us around 60. If the US were to devalue the dollar this drastically, could it effectively erase the national debt? 🤔 Is Trump bold enough to consider such a move?
We know the FED is going to cut eventually, the question is when and by how much? Initial claims came in higher than estimated, with cracks beginning to show in the labor market, how much longer can JPow hold out?

DXY: Local Bearish Bias! Short!
My dear friends,
Today we will analyse DXY together☺️
The market is at an inflection zone and price has now reached an area around 98.335 where previous reversals or breakouts have occurred.And a price reaction that we are seeing on multiple timeframes here could signal the next move down so we can enter on confirmation, and target the next key level of 98.090..Stop-loss is recommended beyond the inflection zone.
❤️Sending you lots of Love and Hugs❤️

DXY dumpsAll assets with the dollar pair will continue to grind higher including commodity .....while DXY dips lower

4 June 2025 DXY Bearish BIAS4 JUNE 2025
DXY Expected to be bearish, Price has retrace to 50% - 75% with a momentum bearish signal Expected DXY to Continue Bearish.
DXY Bearish :
SELL USDXXX atau Buy XXXUSD & GOLD

US DOLLAR SPECULATIVE OPINION.Greetings, At last price action seems to be drawn to the upside.
Multiple breaks of structure on the 30M and a liquidity sweep.
I further investigate..

DXYDXY price is near the support zone 98.74-97.87. If the price cannot break through the 97.87 level, it is expected that the price will rebound. Consider buying the red zone.
🔥Trading futures, forex, CFDs and stocks carries a risk of loss.
Please consider carefully whether such trading is suitable for you.
>>GooD Luck 😊
❤️ Like and subscribe to never miss a new idea!
U.S. Dollar Index When you check the weekly timeframe, you will see massive wick to from the past week.
Because of this we can tell that this week will be extremly bullish.
---USD PAIRS LONG
USD--- PAIRS SHORT
Trade the plan & Plan the trade

DOLLAR INDEXCorrelation Between DXY, Bond Yields, and Bond Prices
1. Bond Prices and Bond Yields: Inverse Relationship
Bond prices and bond yields move inversely: when bond prices rise, yields fall; when bond prices fall, yields rise.
This happens because bonds pay fixed coupons; if market interest rates rise, existing bonds with lower coupons become less attractive, pushing their prices down and yields up.
2. DXY and 10-Year Treasury Yield: Generally Positive Correlation
The US Dollar Index (DXY) and the US 10-year Treasury yield typically move in the same direction. When the 10-year yield rises, the dollar tends to strengthen, and vice versa.
This is because higher yields attract foreign capital seeking better returns, increasing demand for the dollar.
Historically, this correlation has been strong, with a rolling correlation averaging around 44.5% and recently rising to about 75% in early 2025.
However, this relationship can break down temporarily due to shifts in market sentiment or safe-haven flows. For example, in mid-2025, the correlation briefly turned negative amid changing investor preferences.
3. DXY and Bond Prices: Indirect Inverse Correlation
Since bond prices and yields are inversely related, and yields and DXY are positively correlated, DXY tends to move inversely to bond prices.
Rising bond prices (falling yields) often coincide with dollar weakness, while falling bond prices (rising yields) support dollar strength.
4. Interest Rates and Their Role
Central bank interest rates influence bond yields and the dollar.
Rate hikes generally push bond yields higher and strengthen the dollar, while rate cuts do the opposite.
Interest rate expectations are a key driver behind the bond yield-DXY relationship.
Summary Table
Relationship Direction/Correlation Explanation
Bond Price ↔ Bond Yield Inverse Fixed coupon bonds lose value when rates rise
10-Year Yield ↔ DXY Positive (usually) Higher yields attract capital, boosting USD
Bond Price ↔ DXY Inverse (indirect) Bond prices up → yields down → USD weakens
Interest Rates ↔ Yield & DXY Positive Rate hikes raise yields and strengthen USD
Conclusion
The US Dollar Index (DXY) generally rises with increasing 10-year Treasury yields because higher yields attract investment flows into US assets, boosting demand for the dollar. Conversely, bond prices move inversely to yields, so rising bond prices tend to coincide with dollar weakness. While this relationship is strong historically, it can fluctuate due to market sentiment, safe-haven demand, and geopolitical factors.
#DOLLAR #DXY

Dollar BearishAs per yesterdays video. We are still below the block highlited before the fact.
We still hunting the Target on Dollar as shown in the chart.

DXY Sell offD.O.L - April Lows
POI - IFVG above resting liquidity - aligned with an IFVG at 61.8% Premium

DXY BULLISH Lets wait for High Impact news first.03 JUN 2025
DXY BULLISH,
currently retrace and price has break out to downside. but immidately reverse back to inside.
BUY USDXXX atau SELL XXXUSD & GOLD
BIAS To Bullish with momentum.
There is high impact news in 1 hours may change the outlook.
Lets wait and see.

USDollar Is Making An Intraday Pullback Within DowntrendGood morning traders! Stocks keep pushing higher along with yields, so it looks like 10Y US Notes could still see lower support levels, and that’s why USdollar is in a bigger intraday correction. What we want to say is that while the 10Y US Notes are still searching for support, the DXY can stay in recovery mode or at least sideways. In the meantime, stocks can easily see even higher levels after NVIDIA surpassed earnings.
Looking at the intraday USDollar Index – DXY chart, we see a leading diagonal formation, so we are tracking now an intraday abc correction before a bearish continuation, thus keep an eye on GAP from May 18 around 101 level that can be filled and may act as a resistance before a bearish continuation.

DOLLAR INDEXRelationship Between the Dollar Index (DXY), 10-Year Bond Yield, Interest Rates, and Carry Trade
1. Dollar Index (DXY) and 10-Year Bond Yield
The DXY and the US 10-year Treasury yield generally have a direct (positive) relationship:
When the 10-year yield rises, the dollar tends to strengthen.
When yields fall, the dollar usually weakens.
This is because higher yields attract foreign capital seeking better returns, increasing demand for the US dollar and pushing up its value.
However, this relationship is not perfect and can be influenced by other factors like economic data, geopolitical risks, and monetary policy expectations.
2. Interest Rates and Their Impact
Interest rates set by central banks (e.g., Fed funds rate) influence bond yields and currency values.
Higher interest rates generally lead to higher bond yields, attracting capital inflows and strengthening the currency (USD).
Conversely, lower rates tend to weaken the currency as investors seek higher yields elsewhere.
The interest rate differential between countries is crucial: it reflects the relative attractiveness of holding one currency over another, driving capital flows and currency movements.
3. Carry Trade and Its Role
The carry trade involves borrowing in a currency with low interest rates and investing in a currency with higher yields to earn the interest rate differential.
For example, investors may borrow in Japanese yen (low rates) and invest in US dollars (higher rates), buying US bonds or assets.
This strategy increases demand for the higher-yielding currency (USD), pushing up its value and often correlating with rising bond yields in that country.
Carry trades are typically based on short-term interest rate differentials, but recent research indicates that the entire yield curve (including long-term yields) also affects currency returns and carry trade profitability.
The uncovered interest rate parity (UIP) theory suggests carry trade returns should be zero after adjusting for exchange rate changes, but empirically, carry trades have yielded excess returns, partly due to risk premia and market inefficiencies.
what is UIP???
Uncovered Interest Rate Parity (UIP) is a fundamental economic theory that relates the difference in nominal interest rates between two countries to the expected change in their currency exchange rates over the same period. It asserts that the expected depreciation or appreciation of a currency will offset the interest rate differential, eliminating the possibility of arbitrage profits from borrowing in one currency and investing in another without hedging exchange rate risk.
Key Points about UIP:
Interest Rate Differential Equals Expected Exchange Rate Change:
The difference between the interest rates of two countries should equal the expected percentage change in the exchange rate between their currencies. For example, if Country A has a higher interest rate than Country B, its currency is expected to depreciate relative to Country B’s currency by approximately the interest rate difference.
No Arbitrage Condition Without Hedging:
Unlike covered interest rate parity (which uses forward contracts to hedge exchange rate risk), UIP assumes investors do not hedge their currency exposure. Therefore, the expected spot exchange rate at the end of the investment horizon adjusts to offset potential gains from interest rate differences.
Implication:
If a country offers higher interest rates, its currency is expected to depreciate to prevent riskless profit opportunities. This reflects foreign exchange market equilibrium.
Relation to Law of One Price and Purchasing Power Parity (PPP):
UIP is connected to the law of one price, which states that identical goods should cost the same globally when prices are expressed in a common currency. Similarly, UIP ensures that returns on investments in different currencies are equalized once exchange rate changes are considered.
Practical Use:
UIP helps explain and forecast currency movements based on interest rate differentials but is often violated in the short term due to market imperfections, risk premiums, and investor behavior.
In summary, Uncovered Interest Rate Parity states that the expected change in exchange rates between two currencies offsets the interest rate differential, so investors earn the same return regardless of the currency in which they invest, assuming no hedging of currency risk.
4. Bond Prices and Interest Rates
Bond prices and interest rates have an inverse relationship:
When interest rates rise, bond prices fall.
When interest rates fall, bond prices rise.
This dynamic affects currency values indirectly, as falling bond prices (rising yields) attract capital inflows, strengthening the currency and the DXY.
Summary Table
Factor Relationship with USD / DXY Explanation
10-Year Bond Yield Positive correlation Higher yields attract foreign capital, boosting USD
Interest Rates Positive correlation Higher rates increase returns on USD assets
Interest Rate Differential Drives carry trade and currency flows Larger spread favors higher-yielding currency
Carry Trade Supports USD when borrowing low-rate currency and investing in USD Increases demand for USD and US bonds
Bond Prices Inverse to yields; indirectly affects USD Falling bond prices (rising yields) strengthen USD
Conclusion
The US Dollar Index (DXY) generally moves in tandem with the 10-year Treasury yield and interest rates because higher yields and rates attract capital inflows, strengthening the dollar. The carry trade exploits interest rate differentials, further supporting the dollar when investors borrow in low-rate currencies to invest in higher-yielding US assets. Bond prices inversely relate to yields, and their fluctuations indirectly influence the dollar through these mechanisms.
#DOLLAR #GOLD #

USD Index (DXY) –
🔧 Technical:
Trading in a clear downtrend channel
Key resistance: 100.08
Target: 91.83, then 87.64
Bearish bias remains unless price breaks above 102.33
🌍 Fundamentals:
Fed rate cut expectations weighing on the dollar
Weak U.S. data and slowing inflation support downside
Global shift away from USD adds pressure
📉 Headline:
“DXY Weakens Below 100 – Bearish Pressure Builds Toward 91.83”

Bearish drop?US Dollar Index (DXY) is risng towards the pivot and could reverse to the 1st support.
Pivot: 99.10
1st Support: 98.01
1st Resistance: 99.94
Risk Warning:
Trading Forex and CFDs carries a high level of risk to your capital and you should only trade with money you can afford to lose. Trading Forex and CFDs may not be suitable for all investors, so please ensure that you fully understand the risks involved and seek independent advice if necessary.
Disclaimer:
The above opinions given constitute general market commentary, and do not constitute the opinion or advice of IC Markets or any form of personal or investment advice.
Any opinions, news, research, analyses, prices, other information, or links to third-party sites contained on this website are provided on an "as-is" basis, are intended only to be informative, is not an advice nor a recommendation, nor research, or a record of our trading prices, or an offer of, or solicitation for a transaction in any financial instrument and thus should not be treated as such. The information provided does not involve any specific investment objectives, financial situation and needs of any specific person who may receive it. Please be aware, that past performance is not a reliable indicator of future performance and/or results. Past Performance or Forward-looking scenarios based upon the reasonable beliefs of the third-party provider are not a guarantee of future performance. Actual results may differ materially from those anticipated in forward-looking or past performance statements. IC Markets makes no representation or warranty and assumes no liability as to the accuracy or completeness of the information provided, nor any loss arising from any investment based on a recommendation, forecast or any information supplied by any third-party.

U.S. Dollar Index . 1MLong-term DXY (Dollar Index) Analysis
Greetings to all valued followers,
This is a long-term analysis and macroeconomic outlook based on Smart Money Concepts (SMC), carefully charted with key reactive zones highlighted. Within this analysis, significant support levels, imbalance zones, and liquidity pools are outlined, which can guide your market decisions as the price reaches these areas.
Key Zones Based on the Monthly Timeframe
Support (Monthly): 97.441
This level is considered the primary support. It’s expected that, should the price reach this zone, a reaction or corrective rally might unfold.
Support (Monthly): 94.629
This is the secondary support, which acts as the next target if the previous support is broken. Typically, these supports indicate potential reversal points or short-term retracements.
Imbalance Zone (Unfinished Business):
Range: 91.782 – 91.436
This zone represents an Imbalance, signalling a strong disequilibrium in the market. The market will likely revisit this area to restore balance (rebalancing).
Significance: It acts as a Liquidity Magnet — if the Federal Reserve fails to provide sufficient liquidity and the support line is broken, the price will tend to continue downward into this zone to gather the required liquidity for economic rebuilding and confirmation of a bearish trend.
Liquidity Pool:
Liquidity (M): 89.209
This is a liquidity pool where, should the bearish momentum persist, the price is expected to test or reach this level. A significant volume of buy and sell orders are accumulated here, making it a crucial target for further downside.
Charting Summary and Outlook:
The monthly supports at 97.441 and 94.629 are key areas to watch, with market reactions to be evaluated via Order Blocks and Break of Structure (BOS) signals.
The imbalance zone between 91.782 and 91.436 may trigger a retracement within the ongoing downtrend — traders should look for confirmation signals in price action.
If the market fails to gather enough liquidity in these zones, the next downside target would be around 89.209, indicating a continuation of the bearish trend.

Persistent concerns about the US economy are weighing on the DXY
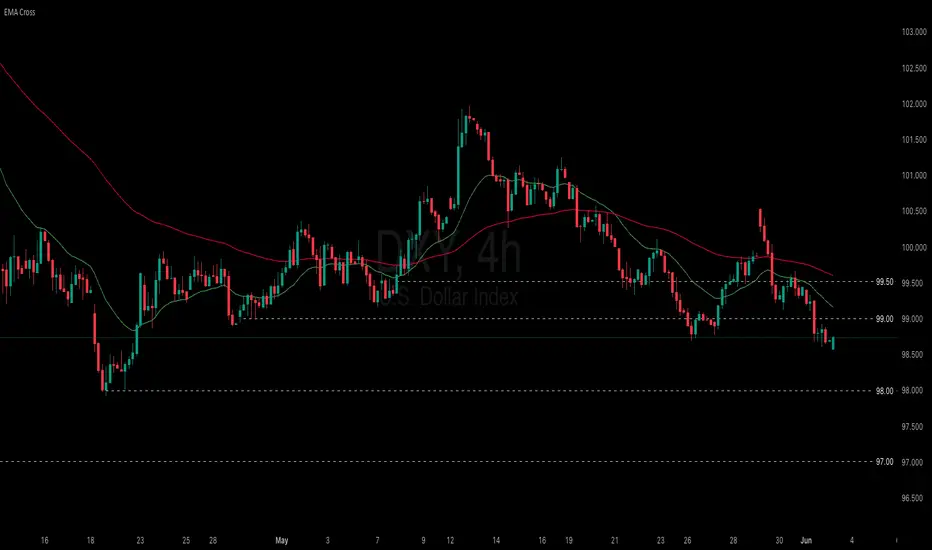
US-China tensions deepened as President Trump criticized China’s rare earth exports and threatened broader tech restrictions and visa cancellations for Chinese students. He also vowed to double tariffs on foreign steel to 50% to strengthen the US steel industry. April headline PCE inflation eased to 2.1% (prev. 2.3%, cons. 2.2%), partly soothing tariff-related inflation concerns.
DXY broke below the 99.00 threshold and dropped to a 6-week low. EMA21 is widening its gap with EMA78, suggesting a potential extension of the bearish structure. If DXY breaks below the support at 98.00, the index may decline further to 97.00. Conversely, if DXY reclaims the resistance at 99.00 and breaches above EMA21, the index could advance to 99.50.
DOLLAR INDEXDXY Outlook: Bearish bias near-term unless strong NFP (June 6) or hawkish Fed rhetoric reverses momentum.
But at the moment price is setting on demand and break and close of that demand floor will expose 96-97$ zone ascending trendline on monthly chart

5 months data respected channel on DXY Dollar long term analysis according current tradewar situation

DXY: Strong Growth Ahead! Long!
My dear friends,
Today we will analyse DXY together☺️
The recent price action suggests a shift in mid-term momentum. A break above the current local range around 98.380 will confirm the new direction upwards with the target being the next key level of 98.653 and a reconvened placement of a stop-loss beyond the range.
❤️Sending you lots of Love and Hugs❤️

dxY drops to 95OH MY GOD! bad news for gold.
dxY drops to 95
I think gold easily breaks the 3500 high and goes to 3700
