Adam and Eve pattern? Bullish?DXY is finding strong support, possibly forming an Adam and Eve pattern, which indicates a bullish reversal.
USDX trade ideas

DXY 15-Minute Technical & Fundamental AnalysisDXY 15-Minute Technical & Fundamental Analysis
DXY has reclaimed momentum, trading at 99.300, after strong U.S. economic data and a hawkish tone from Fed officials signaled policy stability — boosting short-term confidence in the U.S. dollar. On the 15-minute chart, we’re seeing a bullish structure reinforced by clean liquidity manipulation and institutional flow.
Price confirmed bullish intent after breaking above minor key resistance at 99.250, triggering a wave of buy-side momentum. A brief liquidity hunt below 99.250 followed — a textbook manipulation phase — before buyers stepped back in.
DXY then formed Higher Highs and Higher Lows, indicating a well-supported uptrend. Price is now sitting inside the liquidity zone, where smart money often positions for the next leg up.
📊 Trade Setup
📍 Area of Interest (AOI): 99.140 (Buy Limit)
🛡 Stop-Loss: 98.990 (Below liquidity grab and minor support)
🎯 Take Profit: 99.610 (Next minor resistance / 1:3 RR)
This setup aligns with institutional behavior, offering a high-probability entry for short-term trend continuation.
📰 Fundamental Outlook
🇺🇸 USD Strength Backed by Short-Term Fundamentals
Resilient U.S. Data: Retail sales and durable goods orders beat forecasts, signaling economic strength and limiting downside for the dollar.
Fed Stays Hawkish: Policymakers have reiterated their "higher for longer" stance, reducing expectations for rate cuts and supporting the dollar.
Safe-Haven Demand: Geopolitical concerns and weak economic data abroad have driven flows back into the USD as investors seek stability.
Yield Support: Elevated U.S. bond yields continue to attract foreign capital, giving additional strength to DXY.
📌 Disclaimer:
This is not financial advice. Always wait for proper confirmation before executing trades. Manage risk wisely and trade what you see—not what you feel.

possibility of correctionGiven the behavior of the index in the resistance range and the resistance trend line, an upward trend is expected. Otherwise, a downward trend to the previous low is possible.

Beware, the US dollar is at a technical crossroads 1) The US Dollar remains the weakest major Forex currency in 2025
The US dollar has had a difficult year on the foreign exchange market (Forex), recording a decline of over 9% against the world's major currencies, despite the Federal Reserve's continuing rigid monetary policy. Technically speaking, the DXY index has reached several theoretical bearish targets, notably according to Elliot analysis, but has not yet touched the key objective of the A=C movement. This dynamic is also evident in the strong chartist compression in weekly data, placing the USD at a potential breakout point. The EUR/USD and USD/JPY pairs are also in long-term hinge configurations, and institutional positions remain broadly bearish on the US dollar against a basket of major currencies.
Two interesting charts on the current situation are presented below: the first shows Japanese candlesticks in monthly data, and the second is a theoretical reminder of how Elliott waves work.
As long as the US dollar against a basket of major currencies (DXY) remains below the indicated pivot line, the trend remains bearish, with a target of 95/96 points. Conversely, a rebound above the hinged pivot line would put an end to the US dollar's annual correction, with the starting point for a technical recovery.
2) A weakening dollar despite an inflexible Fed: how to explain this paradox?
The apparent paradox of a falling US dollar while US interest rates remain high and the Fed does not expect to cut rates before September/October, goes beyond simple rate differentials. At a time when the ECB has already embarked on a policy of monetary easing, the rate differential with the Fed should normally support the USD. However, other factors are taking over: the markets' growing mistrust of US assets, fuelled by trade tensions and uncertainty over Trump's fiscal policy, is weakening demand for dollars. Added to this is a major liquidity factor: the recent increase in the money supply (M2) in the United States and the decline in reverse repo operations, which reflect an implicit easing of financial conditions. This easing is encouraging persistent downward pressure on the greenback, despite a Fed that remains intransigent on rates.
The next release of US PCE inflation, scheduled for Friday May 30, could play an important catalytic role: a higher-than-expected figure would strengthen the case for an even firmer Fed, which could offer the USD a temporary technical rebound. Conversely, confirmation of disinflation would fuel bets on future easing and accentuate selling pressure. In short, the US dollar is not only at a technical crossroads, but also a fundamental one, suspended between forthcoming monetary action and deeper signals from the global liquidity market.
DISCLAIMER:
This content is intended for individuals who are familiar with financial markets and instruments and is for information purposes only. The presented idea (including market commentary, market data and observations) is not a work product of any research department of Swissquote or its affiliates. This material is intended to highlight market action and does not constitute investment, legal or tax advice. If you are a retail investor or lack experience in trading complex financial products, it is advisable to seek professional advice from licensed advisor before making any financial decisions.
This content is not intended to manipulate the market or encourage any specific financial behavior.
Swissquote makes no representation or warranty as to the quality, completeness, accuracy, comprehensiveness or non-infringement of such content. The views expressed are those of the consultant and are provided for educational purposes only. Any information provided relating to a product or market should not be construed as recommending an investment strategy or transaction. Past performance is not a guarantee of future results.
Swissquote and its employees and representatives shall in no event be held liable for any damages or losses arising directly or indirectly from decisions made on the basis of this content.
The use of any third-party brands or trademarks is for information only and does not imply endorsement by Swissquote, or that the trademark owner has authorised Swissquote to promote its products or services.
Swissquote is the marketing brand for the activities of Swissquote Bank Ltd (Switzerland) regulated by FINMA, Swissquote Capital Markets Limited regulated by CySEC (Cyprus), Swissquote Bank Europe SA (Luxembourg) regulated by the CSSF, Swissquote Ltd (UK) regulated by the FCA, Swissquote Financial Services (Malta) Ltd regulated by the Malta Financial Services Authority, Swissquote MEA Ltd. (UAE) regulated by the Dubai Financial Services Authority, Swissquote Pte Ltd (Singapore) regulated by the Monetary Authority of Singapore, Swissquote Asia Limited (Hong Kong) licensed by the Hong Kong Securities and Futures Commission (SFC) and Swissquote South Africa (Pty) Ltd supervised by the FSCA.
Products and services of Swissquote are only intended for those permitted to receive them under local law.
All investments carry a degree of risk. The risk of loss in trading or holding financial instruments can be substantial. The value of financial instruments, including but not limited to stocks, bonds, cryptocurrencies, and other assets, can fluctuate both upwards and downwards. There is a significant risk of financial loss when buying, selling, holding, staking, or investing in these instruments. SQBE makes no recommendations regarding any specific investment, transaction, or the use of any particular investment strategy.
CFDs are complex instruments and come with a high risk of losing money rapidly due to leverage. The vast majority of retail client accounts suffer capital losses when trading in CFDs. You should consider whether you understand how CFDs work and whether you can afford to take the high risk of losing your money.
Digital Assets are unregulated in most countries and consumer protection rules may not apply. As highly volatile speculative investments, Digital Assets are not suitable for investors without a high-risk tolerance. Make sure you understand each Digital Asset before you trade.
Cryptocurrencies are not considered legal tender in some jurisdictions and are subject to regulatory uncertainties.
The use of Internet-based systems can involve high risks, including, but not limited to, fraud, cyber-attacks, network and communication failures, as well as identity theft and phishing attacks related to crypto-assets.

dxy had a good base formation ,looks to spike up dxy looks good at 99.77 looks like spike up , on a other not metals can be affected.

Bearish reversal?US Dollar Index (DXY) is rising towards the pivot and could reverse to the 1st support.
Pivot: 100.21
1st Support: 99.08
1st Resistance: 101.14
Risk Warning:
Trading Forex and CFDs carries a high level of risk to your capital and you should only trade with money you can afford to lose. Trading Forex and CFDs may not be suitable for all investors, so please ensure that you fully understand the risks involved and seek independent advice if necessary.
Disclaimer:
The above opinions given constitute general market commentary, and do not constitute the opinion or advice of IC Markets or any form of personal or investment advice.
Any opinions, news, research, analyses, prices, other information, or links to third-party sites contained on this website are provided on an "as-is" basis, are intended only to be informative, is not an advice nor a recommendation, nor research, or a record of our trading prices, or an offer of, or solicitation for a transaction in any financial instrument and thus should not be treated as such. The information provided does not involve any specific investment objectives, financial situation and needs of any specific person who may receive it. Please be aware, that past performance is not a reliable indicator of future performance and/or results. Past Performance or Forward-looking scenarios based upon the reasonable beliefs of the third-party provider are not a guarantee of future performance. Actual results may differ materially from those anticipated in forward-looking or past performance statements. IC Markets makes no representation or warranty and assumes no liability as to the accuracy or completeness of the information provided, nor any loss arising from any investment based on a recommendation, forecast or any information supplied by any third-party.

DXY Technical Outlook – Strong Support Test and Bullish Reversa Chart Summary
The DXY (U.S. Dollar Index) chart illustrates a significant technical structure between strong historical support and resistance zones, with potential for a bullish reversal after a key level retest.
🟢 Key Support Zone: 99.000 – 98.000
📍 Labeled as "STRONG SUPPORT", this zone has held multiple times:
Previous bounce: Early 2023 ✅
Mid-2024 rebound ✅
Current price action once again shows a reaction from this level with a bullish candle forming 🔥
📌 EMA Confluence:
The 200 EMA (blue) sits at 102.401
The 50 EMA (red) at 103.725
Price is currently below both EMAs but near the 200 EMA, suggesting potential for a mean reversion bounce 📈
🔴 Resistance Zones to Watch:
Resistance Zone: 109.000 – 110.000
⛔ Historically rejected in late 2023 and again in early 2025
🧱 Acting as a supply zone — watch for rejection or breakout
ATH Supply Zone: 113.000 – 114.000
🚨 This is a major psychological and technical barrier
🫡 Marked as “NEW ATH” – would need strong momentum and fundamentals for a breakout above this level
📈 Price Action Expectations:
With strong support respected again, a bullish reversal toward 109.000 – 110.000 appears likely (as illustrated by the arrow).
If momentum continues, a retest of ATH zone is on the cards 🔭
However, a failure to hold support could lead to breakdown below 98.000 – watch closely 🔍
🧭 Strategic Insight
Bullish Bias while above support (98.000 zone)
Reversal Confirmation needed above 102.401 (200 EMA) and 103.725 (50 EMA)
Watch for rejection near 110.000 resistance before ATH test
📌 Final Note:
🧊 World Eyes on this Level – As highlighted on the chart, the current support area is under global observation, reinforcing its importance.
🕵️♂️ Stay alert for breakout volume and fundamental catalysts (e.g., Fed decisions, CPI, jobs data).

A retest of 98.00 or even further down.Dollar is almost getting to the support line of a historic rising channel that started almost 20 years ago, I am selling with targets 98.00-97.00 area.
If 97.20 acts a support, I'll be looking for long term longs.

Hard truth US dollar bulls must now admit...Hard truth US dollar bulls must now admit...
IT'S COOKED !!!
death cross 12 and 36 month moving averages
reverse breakdown
momentum broken below this

How strong is the dollar??Currently looking to take price lower as the DXY very bearish with lots weekly selling pressure.

the trap has layerswhat if i told you the dxy was not done yet,
what if i told you, there was 1 more push up,
1 more test before it truly breaks and starts a bull market.
what if i told you that on that final test, that final push up,
the crypto market breaks and takes everything.
---
you probably wouldn't believe me.
---
looking at the dxy as a simple zig-zag with a complex flat in the b-wave.
once wave b is completed, at about 110-111,
i predict it drops down, deep
and while it drops,
it triggers alt season.
🌙

DXY OUTLOOK BEFORE FOMC | Will the Dollar Break Trend DXY OUTLOOK BEFORE FOMC | Will the Dollar Break Trend or Just Retrace?
The US Dollar Index (DXY) has rebounded after weeks of relentless selling pressure, but this bounce is now approaching key decision zones just ahead of two critical events: the April PCE report and the next FOMC meeting. With macro data and sentiment diverging, traders should closely monitor how the dollar reacts to upcoming catalysts.
🌍 MACRO & FUNDAMENTAL CONTEXT
Core PCE Price Index (Apr) – due Friday – is the Fed’s preferred inflation gauge. A higher-than-expected print may reinforce the “higher for longer” stance on rates.
FOMC Minutes revealed a growing divide within the committee: some members remain open to further tightening if inflation stalls.
Bond market stress is emerging again, as 10Y yields hover near 4.5%. Fiscal concerns and treasury auctions are weighing on investor sentiment.
Political noise – particularly from former President Trump’s shifting tariff threats – adds short-term volatility to USD expectations.
🧠 Bottom line: While the dollar has regained ground, macro risks remain asymmetric. A hot PCE may spark short-term demand for USD, but structural credibility risks are still on the table.
📊 TECHNICAL INSIGHT – H1 STRUCTURE
Price Channel: DXY broke slightly above a well-respected descending channel that started mid-May.
EMA Confluence: EMA 13, 34, and 89 are beginning to align upward but haven’t fully confirmed a bullish trend yet.
Key Retest Zone: 99.08 is a critical zone — a Fibonacci 38.2% level of the recent breakout. A hold here may support another test higher.
🔑 KEY TECHNICAL LEVELS
Immediate Support: 99.08 (Fib 38.2% + channel retest)
Mid Resistance: 100.02 (round number + previous structure high + near 200 EMA)
Major Target Zone: 100.48 (Fib 61.8% + multi-day pivot)
📈 POTENTIAL PRICE SCENARIOS
If DXY respects 99.08, a continuation toward 100.02 and even 100.48 is plausible as a technical correction.
If DXY fails to hold 99.08, the breakout above the trend channel may turn into a false break, opening the door for a re-test of lower channel support near 98.30.
Watch for price behavior around 100.02 — aggressive sellers may re-enter at this level, especially if macro data disappoints.
⚠️ STRATEGIC REMINDER
Avoid chasing mid-range price action.
Let the market reveal its hand post-PCE.
Volatility is expected to spike — be patient and let key levels define directional conviction.

DXY Bearish27 Mei 2025
DXY continuation bearish,
currently retrace and there is reversal signal.
SELL USDXXX atau BUY XXXUSD & GOLD
BIAS To Bearish

DXY 4hr char anlaysis I expect the DXY to enter a temporary bullish phase, likely as part of a corrective move. The price may rise toward the 100.781 – 101.00 zone.
From that level, I anticipate a bearish reversal, with the potential for the price to decline toward the 97.00 – 94.00 region.
This outlook is based on my own understanding and experience in the market — it's not guaranteed to be 100% accurate, but it's a well-considered forecast. I estimate there's about an 80% probability that the market will follow this scenario.

DOLLAR I Weekly CLSI Model 2- Big expansion comingHey, Market Warriors, here is another outlook on this instrument
If you’ve been following me, you already know every setup you see is built around a CLS range, a Key Level, Liquidity and a specific execution model.
If you haven't followed me yet, start now.
My trading system is completely mechanical — designed to remove emotions, opinions, and impulsive decisions. No messy diagonal lines. No random drawings. Just clarity, structure, and execution.
🧩 What is CLS?
CLS is real smart money — the combined power of major investment banks and central banks moving over 6.5 trillion dollars a day. Understanding their operations is key to markets.
✅ Understanding the behaviour of CLS allows you to position yourself with the giants during the market manipulations — leading to buying lows and selling highs - cleaner entries, clearer exits, and consistent profits.
🛡️ Models 1 and 2:
From my posts, you can learn two core execution models.
They are the backbone of how I trade and how my students are trained.
📍 Model 1
is right after the manipulation of the CLS candle when CIOD occurs, and we are targeting 50% of the CLS range. H4 CLS ranges supported by HTF go straight to the opposing range.
📍 Model 2
occurs in the specific market sequence when CLS smart money needs to re-accumulate more positions, and we are looking to find a key level around 61.8 fib retracement and target the opposing side of the range.
👍 Hit like if you find this analysis helpful, and don't hesitate to comment with your opinions, charts or any questions.
⚔️ Listen Carefully:
Analysis is not trading. Right now, this platform is full of gurus" trying to sell you dreams based on analysis with arrows while they don't even have the skill to trade themselves.
If you’re ever thinking about buying a Trading Course or Signals from anyone. Always demand a verified track record. It takes less than five minutes to connect 3rd third-party verification tool and link to the widget to his signature.
"Adapt what is useful, reject what is useless, and add what is specifically your own."
— David Perk aka Dave FX Hunter ⚔️

DOLLARThe US Dollar Index (DXY) Yearly Support and Potential Sell-Off to 96 Zone: Role of 10-Year Bond Yields and Interest Rates
1. Technical Outlook: DXY Support Breakdown and 96$ Target and Critical Support Levels.
The DXY recently breached the 200-week moving average (200-WMA), a key multi-year support level, signaling a potential trend reversal .
A sustained break below 98.00 could trigger a steeper decline toward 96.00-95$ long-term uptrend ascending trendline acting as 6months support floor connecting 2008, 2011 and 2020, . However, analyst projections also highlight the 96–95 zone as a plausible target if Fed rate cuts and macroeconomic headwinds persist .
Current Context (May 2025):
The DXY is testing 98.4 on weekly charts, with bears eyeing lower supports amid weakening USD sentiment .
A drop to ascending trend line on 6months would align with forecasts tied to Fed policy shifts and global currency strength .
2. 10-Year Bond Yield and Interest Rate Dynamics
Direct Relationship with the Dollar:
The 10-year Treasury yield and USD share a strong correlation: higher yields attract foreign capital, boosting dollar demand, while lower yields weaken the currency .
As of May 2025, the 10-year yield hovers near 4.54%, down from peaks but still elevated compared to global peers .
Impact of Rate Cuts and Policy Divergence:
Fed Rate Expectations: Markets price in five Fed rate cuts by late 2025, which would reduce yield advantages and pressure the dollar .
Policy Divergence: The ECB and BoJ are expected to maintain or ease policies, while the Fed delays cuts, temporarily supporting USD. However, prolonged easing could reverse this advantage .
3. Key Drivers of Dollar Weakness Toward 96-95 ascending trendline
Bearish Factors:
Yield Decline: A drop in the 10-year yield (e.g., due to Fed cuts or recession fears) would erode USD appeal. For every 1% decline in yields, the DXY could fall 3–5% .
Risk Sentiment: A "soft landing" scenario or rally in risk assets (stocks, commodities) may reduce safe-haven USD demand .
Tariff and Geopolitical Risks: Escalating US-China/EU trade tensions could weaken the USD if global growth fears dominate .
Bullish Counterpoints:
Hawkish Fed Surprises: Strong US data (e.g., inflation, jobs) may delay rate cuts, keeping yields and the dollar elevated .
Safe-Haven Flows: Renewed geopolitical/market turmoil could revive USD demand despite lower yields .
4. Summary: Interplay Between Yields, Rates, and DXY
Factor Impact on DXY
10-Year Yield Rises Strengthens USD (investor inflows)
10-Year Yield Falls Weakens USD (capital outflows)
Fed Rate Cuts Pressures USD (narrows yield gap)
ECB/BoJ Easing Supports USD (policy divergence)
Path to 96: A combination of Fed rate cuts, declining 10-year yields, and stronger global currencies (EUR, JPY) could drive the DXY toward 96–95 .
Reversal Risks: Hawkish Fed pivots or safe-haven demand amid crises may stall the decline.
Conclusion
The DXY’s potential drop to the 96–95 zone hinges on sustained declines in the 10-year Treasury yield and Fed rate cuts, compounded by technical breakdowns. While policy divergence and safe-haven flows offer temporary USD support, broader macroeconomic shifts (e.g., tariff risks, global growth) could accelerate the sell-off. Traders should monitor yields, Fed rhetoric, and technical levels on demand floor and supply roof for confirmation of bearish or bullish momentum

US Dollar Index - Classic Bearish PatternUS Dollar index has successfully broken down from the previous support which held strongly in the past, after support broke we saw successful retest of the support as the new resistance and got rejected from the resistance, now its heading towards the next support
Follow Our TradingView Account for More Technical Analysis Updates, | Like, Share and Comment Your thoughts.
Cheers
GreenCrypto

Change the trend It is expected that a trend change will take place within the current support range and we will witness the start of an uptrend. Otherwise, the downtrend will continue along the specified path.

USD INDEX PIVOT AREAThe USD INDEX is currently prefering the bears as long as the pivot area holds .However abreak above could bring some strength to the index with 99.29 and 99.90 as targets.
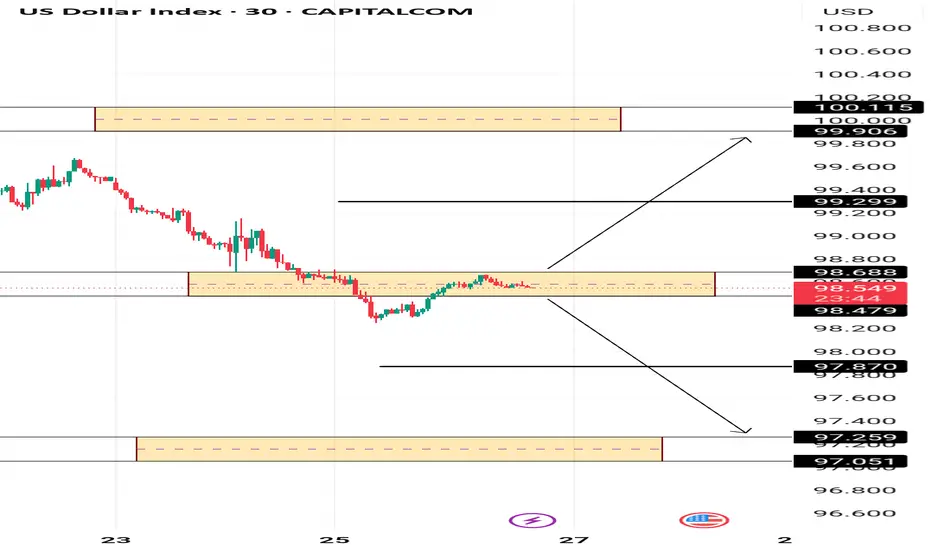
DXY: Move Down Expected! Short!
My dear friends,
Today we will analyse DXY together☺️
The recent price action suggests a shift in mid-term momentum. A break below the current local range around 98.579 will confirm the new direction downwards with the target being the next key level of 98.459 and a reconvened placement of a stop-loss beyond the range.
❤️Sending you lots of Love and Hugs❤️

DXY Continuation Bearish Bias. 26 Mei 2025
DXY continuation bearish,
Market slow due to bank holiday.
currently retrace and will wait for another signal tomorrow.
SELL USDXXX atau BUY XXXUSD & GOLD
BIAS to no trade today.

USXUSD OHLC Weekly ProfileUSXUSD OHLC Weekly Profile
Expecting a bearish week.
Notice how Bank Holiday aligns for a sponsorship lower from the Daily FVG.
Mix that with Economic Calendar - Thursday & Friday delivery lower, expecting a mid-week reversal.

DXY on daily tfSo we have this on daily tf. and there is a sign of rejection. hopefully this will validate my bias as long position for dxy
