Major resistance level ahead?US Dollar Index (DXY) is rising towards the pivot and could reverse to the 1st support.
Pivot: 97.90
1st Support: 96.46
1st Resistance: 98.57
Risk Warning:
Trading Forex and CFDs carries a high level of risk to your capital and you should only trade with money you can afford to lose. Trading Forex and CFDs may not be suitable for all investors, so please ensure that you fully understand the risks involved and seek independent advice if necessary.
Disclaimer:
The above opinions given constitute general market commentary, and do not constitute the opinion or advice of IC Markets or any form of personal or investment advice.
Any opinions, news, research, analyses, prices, other information, or links to third-party sites contained on this website are provided on an "as-is" basis, are intended only to be informative, is not an advice nor a recommendation, nor research, or a record of our trading prices, or an offer of, or solicitation for a transaction in any financial instrument and thus should not be treated as such. The information provided does not involve any specific investment objectives, financial situation and needs of any specific person who may receive it. Please be aware, that past performance is not a reliable indicator of future performance and/or results. Past Performance or Forward-looking scenarios based upon the reasonable beliefs of the third-party provider are not a guarantee of future performance. Actual results may differ materially from those anticipated in forward-looking or past performance statements. IC Markets makes no representation or warranty and assumes no liability as to the accuracy or completeness of the information provided, nor any loss arising from any investment based on a recommendation, forecast or any information supplied by any third-party.
USDX trade ideas

This look promising for Crypto!The DXY breaking below its trend channel is a really positive sign for risk assets like Bitcoin and Altcoins. Usually, a weak dollar means more money flows into risk assets. The DXY's technical target is 89, which is the level to watch for the end of the crypto bull run.

DXY FIREHere on this post, i shared my buy analysis on TVC:DXY , both entry and exits are on the post. see the video for more.

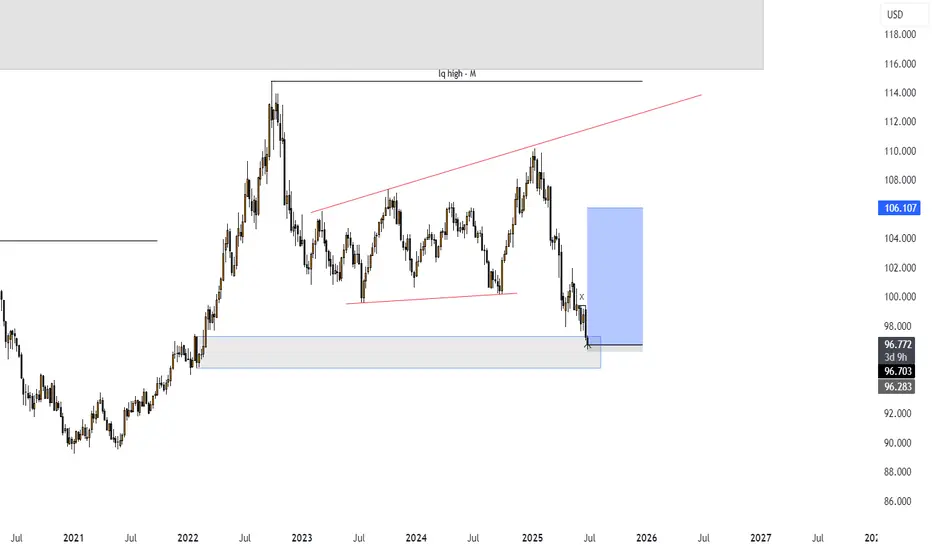
DXY (Dollar Index) longs to shortsThe dollar has been bearish for several weeks, but we’re now starting to see signs of a potential retracement due to price being in oversold territory. Last week, DXY reacted from a key weekly demand level, suggesting that we could see some short-term bullish movement before any continuation to the downside.
I’ll be watching closely for price to either push higher into liquidity or retrace slightly deeper into more discounted demand zones for a cleaner long setup. This would also align with my short setups across other major pairs, making DXY strength a key narrative this week.
Confluences for DXY Longs:
DXY has been bearish for an extended period — now showing signs of accumulation on higher timeframes
Price may retrace upwards to collect liquidity before continuing its macro downtrend
Recently reacted from a major weekly demand zone
Imbalances and liquidity above, including Asia highs, remain untapped
P.S. If price fails to react from any of my current POIs, I’ll patiently wait for new zones to develop and adjust accordingly — always staying aligned with what price tells us.
Let’s stay sharp and crush the week ahead!

DXY - trade - market structure DXY - trade - market structure , easy setup, clean setup , good probability, if this happen is a big win, use risk and trade managment
DXY Potential Bullish Reversal – Target 99.456 DXY Potential Bullish Reversal – Target 99.456 🎯
Technical Analysis Overview:
🔹 Trend Structure:
The chart illustrates a recent downtrend, which has been broken as price moved above the descending trendline, signaling a potential trend reversal.
🔹 Pattern Insight:
A bullish harmonic pattern is visible (possibly a bullish Bat or Gartley), with the price reacting from the PRZ (Potential Reversal Zone), aligning with key support near 96.500. The market has respected this zone multiple times, evident from the orange highlighted circles showing price rejections.
🔹 Support & Resistance:
Support Zone: ~96.500
Breakout Zone: ~96.985 (current consolidation near this resistance)
Target Zone: Marked at 99.456, which aligns with previous structure and fib projection.
🔹 Market Sentiment:
Price is consolidating after breaking the downtrend, forming a bullish rectangle (accumulation). The green arrows indicate bullish intent from buyers defending support levels.
🔹 Price Action Signal:
Formation of higher lows.
Break of structure and close above previous highs.
Possible breakout pending above consolidation box.
📊 Conclusion:
DXY shows bullish potential as it builds a base around strong support. A confirmed breakout above the rectangle could fuel a rally toward 99.456. Keep an eye on volume and confirmation candles for entry. ✅

DXY // Inverted head and shoulders formationIf we can see closings above the green line, the first target exit is 97.878, which corresponds to Fibo 1.414, and the main target is 98.363.

DXY: Bears Are Winning! Short!
My dear friends,
Today we will analyse DXY together☺️
The recent price action suggests a shift in mid-term momentum. A break below the current local range around 96.860 will confirm the new direction downwards with the target being the next key level of 96.760.and a reconvened placement of a stop-loss beyond the range.
❤️Sending you lots of Love and Hugs❤️

We can expect such a move if the event I mentioned in the captioHello friends..
In the analysis we had previously told you about the dollar index on this page, it started a downward trend right from the specified area (you can visit the page)
Now, after a long time has passed since that analysis, we are now in a suitable range in the dollar index.
See, on the weekly time frame, the index number has hit a strong support area, but we should not make a trading decision by seeing this support unit.
As you can see in the image, if the index number suffers in this range, we can expect a turn in the index.
You can change the trading decisions you have had so far in the event of a turn in the index.
This is just a view from our team, do not attach it to your trades.
.
.
Follow our page to see more analyses.

🇺🇸 Today's U.S. Data: Tariffs Starting to Bite?U.S. Data Journal – July 3, 2025
Today's U.S. economic releases showed a stronger-than-expected labor market, with Non-Farm Payrolls (NFP) surprising to the upside, alongside increases in factory orders and a solid ISM Services PMI print.
The combination of these indicators points to persistent demand strength across both goods and services. Moreover, the upward trend in factory orders and service sector activity suggests that tariffs are beginning to feed into cost structures, adding inflationary pressure from the supply side.
While the labor market remains resilient, the risk is that sticky input costs—partly tariff-driven—may complicate the disinflation narrative and potentially delay any dovish policy shift from the Fed.

USD Tries to Break the Tide at NFPIt's been a painful week and a half for the USD.
Around the June FOMC meeting a hopeful bounce had built as the Fed sounded a bit less-dovish. While inflation remains below their expectations the labor market had held up relatively well, and with the threat of possible inflation from tariffs they didn't seem to be in any hurry to cut rates.
But then last week opened with Michelle Bowman saying she supported a rate cut as early as July, and DXY put in a bearish engulfing pattern. And then into the end of Q2 it was constant bleeding as the currency continued to trip down to fresh three-year lows.
Interestingly, the shocking miss on ADP data this morning illustrates weakness in the labor market, yet the USD is currently showing its first green day since last week's open.
This is likely more due to just how oversold the currency has become but it sets the stage for NFP tomorrow. While that data point is a major driver, it's supply and demand, which is denominated by positioning, that pushes prices. For tomorrow the interest is in a better-than-expected NFP print bringing a short-term squeeze in the USD, after which markets will get a look to see just how aggressive bears remain to be. The big area of interest for this is the prior swing low, at the 97.91 level, which set support in April and then held the lows in June, until the late-month breakdown move.
To date that spot still hasn't been tested for resistance and if sellers do get a chance to offer at that level, we get to see how aggressive they remain to be. - js

DXY USD Dollar Bearish Short term, then bullishI am not a financial advisor. This is not meant to be and does not constitute financial, investment, trading, or any other types of advice or recommendation.

Bearish drop?US Dollar Index (DXY) has reacted off the pivot, which has been identified as a pullback resistance and could drop to the 1st support.
Pivot: 97.80
1st Support: 95.40
1st Resistance: 99.36
Risk Warning:
Trading Forex and CFDs carries a high level of risk to your capital and you should only trade with money you can afford to lose. Trading Forex and CFDs may not be suitable for all investors, so please ensure that you fully understand the risks involved and seek independent advice if necessary.
Disclaimer:
The above opinions given constitute general market commentary, and do not constitute the opinion or advice of IC Markets or any form of personal or investment advice.
Any opinions, news, research, analyses, prices, other information, or links to third-party sites contained on this website are provided on an "as-is" basis, are intended only to be informative, is not an advice nor a recommendation, nor research, or a record of our trading prices, or an offer of, or solicitation for a transaction in any financial instrument and thus should not be treated as such. The information provided does not involve any specific investment objectives, financial situation and needs of any specific person who may receive it. Please be aware, that past performance is not a reliable indicator of future performance and/or results. Past Performance or Forward-looking scenarios based upon the reasonable beliefs of the third-party provider are not a guarantee of future performance. Actual results may differ materially from those anticipated in forward-looking or past performance statements. IC Markets makes no representation or warranty and assumes no liability as to the accuracy or completeness of the information provided, nor any loss arising from any investment based on a recommendation, forecast or any information supplied by any third-party.

DXY at the Crossroads: How the 108–110 could reshape the market
Key Highlights
The U.S. Dollar Index TVC:DXY is currently near an important resistance level of 108–110.
A potential reversal of the dollar at this level could lead to further growth in stock markets and strengthen cryptocurrencies, while a break above 110+ would continue to put pressure on risk assets.
If CAPITALCOM:DXY surpasses 110 and holds above it, there is a possibility of reaching as high as the 120 mark. A rejection from the 108–110 zone would indicate a downward trend developing, possibly pushing the index toward the 98 area or lower.
Future outcomes will depend on Federal Reserve monetary policy, global demand for the dollar and other safe-haven assets, as well as overall economic stability.
What about crypto?
There are serious risks for CRYPTOCAP:TOTAL2 CRYPTOCAP:TOTAL3 & CRYPTOCAP:OTHERS
A long-term perspective on ICEUS:DXY suggests that “alt seasons” tend to occur during periods of dollar weakness. Currently, the 108–110 zone and the MA50-W are pivotal. A potential DXY reversal here may act as a catalyst for another major altcoin rally in the coming months, while continued dollar strength could postpone any such “alt season.”
Shaka

DOLLAR INDEX TRADING CHEACK LIST.
The dxy is the measure of the united state dollar relative to basket of six majors foreign currencies, it was originally developed by U.S Federal Reserve in 1973 to provide a trade -weighted average value of the dollar against global currencies.
the six currencies are EURO 57%,JPY 13.6%,GBP 11.9%,CAD 9.1% SEK 4.2% CHF 3.6%
The index rises when the dollar strengthens against these currencies and falls when it weakens ,its used to gauge the overall strength of the us dollar in the global market.
US10Y
THE US10Y ,the treasury note yield is the interest rate the U.S government pays to borrow money for 10 years ,it serves as a crucial benchmark for other interest rates and is a key indicator of the investor sentiment about the economy, in context it reflects the return an investor expect for lending money to the U.S. government for a decade .
the interest is paid semi annually at a fixed coupon rate and the yield moves inversely to bond price; when bond price fall the yield rises, and vice versa .
this have a direct effect on borrowing cost across the economy ,including mortgage rates and corporate loans .
when yield is rising investor optimism is high about the economic growth and inflation ,while failing yield indicates economic caution and recession fear and concern
technical interpretation of the monthly chart
the dxy is in buy back position on ascending trendline line ,but price remains below supply roof and if we get monthly retest of broken demand floor we could see price selling off.
trading is 100% probability.

DXY Weekly Projections (Big Beautiful Bill)Projecting that the fundamentals of the Big Beautiful Bill may increase the value of the US Dollar for a short time. The dollar will bounce to $99 then back bounce back to lower then $97.

DOLLAR INDEX BY 1;30 PM we are expecting the average hourly earnings m/m with a forecast 0.3% and previous 0.4% and Non-Farm Employment Change forecast 111K below past data of 139K
the rate of Unemployment is forecasted to be lower as monetary team is looking at 4.3% against previous data of 4.2%
but yesterday ADP -33k have given a clue that Non-farm data will come soft which will trigger sooner rate cut by feds.
dollar index and US10Y will be watched to see the direction of investment by investors.
if NON FARM EMEPLYMENT CHANGE AND UNEMPLOYMENT DATA REPORT COMES GREATER THAN FORECAST, DOLLAR AND US10Y WILL RISE AND WE SHORT GOLD ,AUDUSD SELL,GBPUSD SELL,EURUSD SELL ,USDJPY BUY.
THIS IS JUST FOR EDUCATIONAL PURPOSES ONLY.

DXY Bullish IdeaDXY has been printing Lows since past weeks and is currently testing a good long term support. A good bounce is expected in dollar.
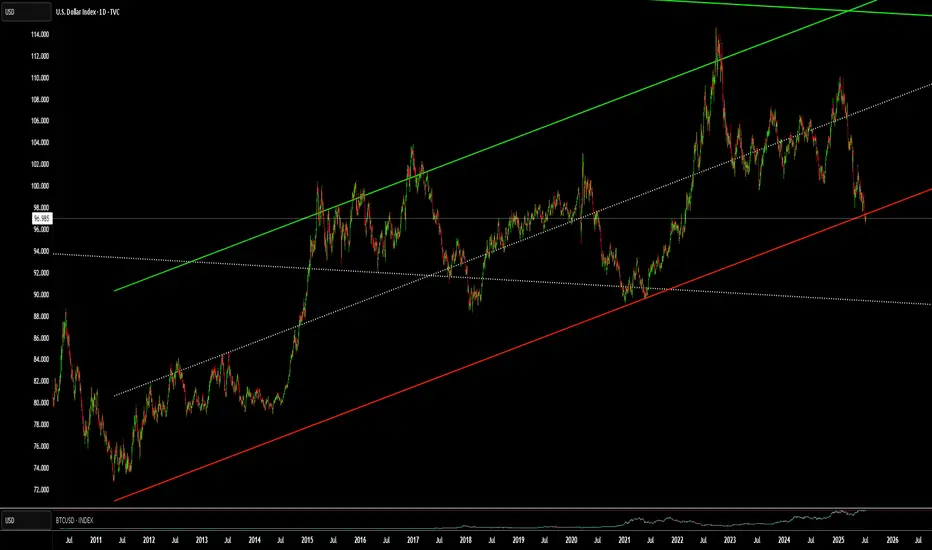
WHy is everyone Freaking out over the DXY !?!?!Here is a chart of the DXY. with a linear regression channel plotted over it. Yes, we are close to the bottom of the channel. But we are no where near an all time low. Far from it. The DXY may be due for a push, but even if it was to drop more it would not be that big of a deal relative to historical patterns.
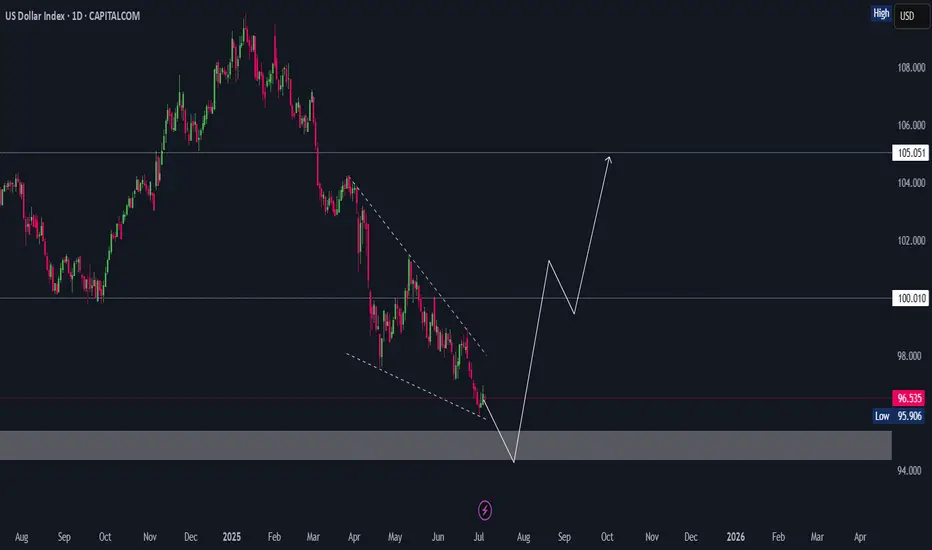
Dollar Testing The Channel Support It’s already Friday and the 4th of July, so US holidays are here, which means we could see thinner trading conditions later today. Still, the overall tone remains risk-on since yesterday, supported by better-than-expected Non-Farm Payrolls data and an ISM services reading at 50.8—still in expansion territory. So, there’s some optimism in the market, and this could continue if we get a positive outcome on the tariff front ahead of the July 9th deadline.
On the back of strong economic data, US yields are moving higher, but the Dollar Index is trying to come lower. It’s currently retesting the lower trendline of a corrective channel—likely due to the strong rally in US stock indexes, which are keeping the dollar under pressure.
On the daily chart, the Dollar Index still looks like it could head to new lows, but that move may not come today if holiday conditions slow down the market. We might have to wait until next week for a clearer breakout.
GH

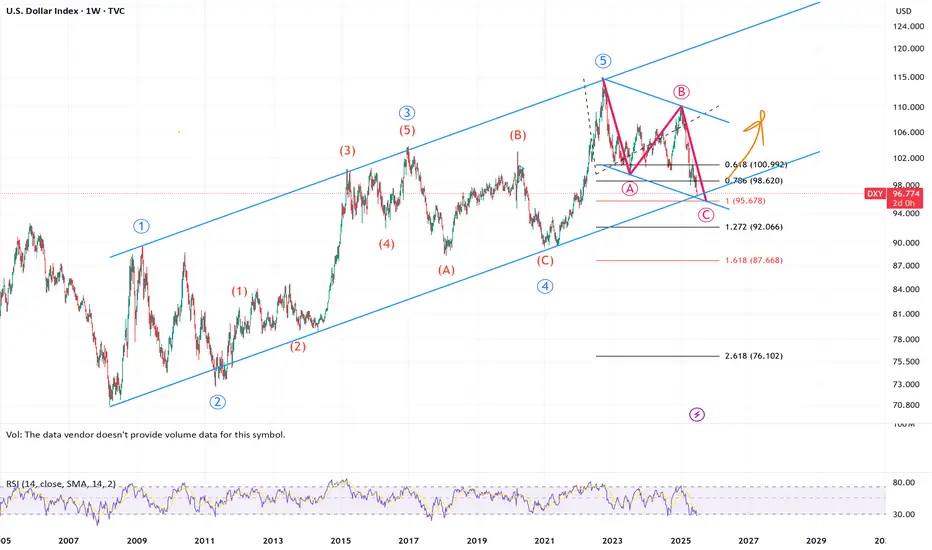
USD weaknening is coming to an end?DXY is soon reaching a 1:1 second leg down (measured at 95.678).
Similarly, EURUSD is reaching a 1:1 since the Sept 1 (2022) low (measured at 1.2046).
DXY : Lets wait and seeThe chart above explains.
Price is in a hurry. Looks like time is limited. I think the snap-back would be a quick one.
Looking good judging the 10Y and 30Y movement now
Good luck @ 94.65

Check the trend It is expected that a trend change will form at the current resistance level and a continuation of the downtrend will form. Otherwise, the continuation of the uptrend to the specified resistance levels will be possible and then there will be a possibility of a trend change at the specified resistance levels.
