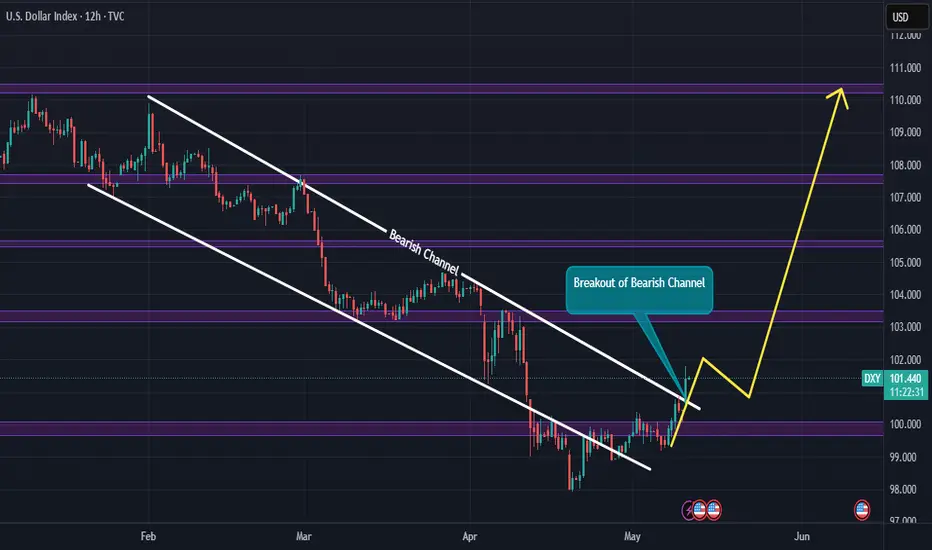
DXY Breaks out of long term Bearish ChannelThe Dollar Index TVC:DXY has finally broken out of a long term bearish channel and will most likely push back to top of the channel as Dollar Index strengthens. Expect a minor retracement to the bearish channel to gain momentum for the bullish move.
The financial market will likely experience many short positions/bearish moves on major FX pairs like AUDUSD, EURUSD, GBPUSD, NZDUSD, SGDUSD. Be on the lookout for such moves.
Kindly support this analysis to enable it reach to other people, and do comment your thoughts.
USDX trade ideas
DXY Has More To The UpsideDXY is right now in what I believe to be a 4th wave correction, which has turned into a wxy, and probably also will turn into a WXYXZ.
It has plenty of room to develop.
Since 4th wave corrections has a tendency to enter the area of the 4th wave of previous impulse, it will most likely go up to the area of the green rectangle above.
This will be between 103.2 - 104,7.
If it will go further up before heading down is to early to say.
But my previous forecast about it will go down below 96 is still in play and intact.

US DOLLAR Analysis: Bullish Momentum Building?TVC:DXY is finally showing signs of stabilization. The index has successfully rejected a key support level, an area where price has historically attracted strong buying interest. This level closely aligns with the psychological $100 mark, which has once again acted as a pivotal point for market participants, reinforcing its relevance as a key technical level.
The recent price action confirms bullish interest, as evidenced by a strong rejection pattern within the zone, with long lower wicks and bullish follow-through candles. The support zone held firm, and buyers have stepped in, initiating an upward move.
Now that price has bounced from this level, the probability of a continued rally increases. If the bullish momentum sustains, the price could move toward the 102.500 level, a logical near-term target based on previous structure and minor resistance.
However, a failure to maintain above the 100.00 handle or a sudden shift in sentiment could still pose downside risks. A confirmed breakdown below the green support zone would invalidate this bullish outlook and potentially open the door for further declines.
Remember, always confirm your setups and use proper risk management.

DXY 12 May updatefinally moving up after long consolidation phase
we either move up another phase(preferred) or drop(not likely as huge one sided usd short position unwind)
As this keeps moving up, usdjpy usdcad usdchf etc rise, eurusd gbpusd etc falls

DXY MMBM confirmed - Bullish ThesisDXY exited the first stage distribution confirming we are bullish and in a marked maker buy model.
I expect CPI to retrace price and resume the bullish weekly trend afterwards.

DXY Breakout! Bullish Momentum Targets 103.6 and 107.4 The US Dollar Index (DXY) has just made a strong bullish breakout from the 99.05–100 demand zone, confirming a reversal from its recent downtrend. This region has acted as a high-volume node and key institutional accumulation zone, as highlighted by the LuxAlgo Supply & Demand Visible Range.
Key Technical Highlights:
Demand Zone: The 98.5–100.5 range showed significant volume buildup and price rejection, signaling strong buyer interest.
Breakout Confirmation: Price broke through minor resistance at 101.2 with strong momentum and a bullish candle close.
Next Target: Eyes on 103.621, the next key resistance zone. A break above may push DXY towards 107.467, aligning with a major supply area.
Volume Profile: Low volume between 101.2 and 103.6 suggests a potential quick move toward the next resistance.
Indicators: RSI trending up but not yet overbought. MACD shows early bullish crossover on the 4H timeframe.
Fundamentals to Watch:
Upcoming USD economic data (CPI, Retail Sales, FOMC minutes).
Risk-off sentiment globally could boost USD as a safe-haven play.
Trade Plan (Not Financial Advice):
Buy Zone: Already triggered breakout above 101.2.
TP1: 103.6
TP2: 107.4
SL: Below 99.8 to invalidate the breakout thesis.
What do you think? Will DXY continue its bullish move or face rejection around 103.6? Let’s discuss in the comments.

DXY4h chartwe can see clearly a head and shoulders in DXY plus the last week make a big move to the down side, i think he looking for take a breath.

USDX-BUY straegy Daily chart Regression channelThe USDX shows clearly we should be cautious in selling USD, and this applies across the board. Based on channel and the extreme case we are in, we can bounced back ttowards 101.20-101.70 area in the near term.
Strategy BUY @ 97.80 - 98.20 and take proft in stages 1. @ 100.37 and 2. 101.57.

US DOLLAR INDEX TO RISE TO 100.90Dear traders, based on the chart, the falling trend-line is clearly broken and retested and the price is supported by a rising trend-line as well. This implies a big possibility of further rise towards 100.90. Let's See!

DXYlets see how this will go, may be is going to take effect on some major pairs and crypto...
am looking forward to use this as case study of any usd pair i will like to pick. if i dont see opportunity today, opportunity will surely show up tommmoro

DXY Ready to Pop – Watch That 100 Break!After breaking below the key psychological level at 100 and making a low just under 98, the Dollar Index ( TVC:DXY ) has entered a consolidation phase.
Over the past three weeks, price has developed an inverted head and shoulders pattern, with the neckline perfectly aligning with the horizontal resistance at 100 — a strong zone of confluence from both a technical and psychological standpoint.
Despite the current hesitation under resistance, the structure suggests bullish potential. I believe we are approaching a breakout above 100, and once that happens, an acceleration to the upside is likely to follow.
🎯 Target: 102
🔒 Invalidation: A break below 98 would cancel the bullish bias.
As long as the price stays above the 98 area, I remain bullish and expect the dollar to strengthen.
🚀 The breakout hasn’t happened yet — but the pressure is building.

DXY Update – Bullish Correction in PlayAt the beginning of the month, I mentioned that the USD Index (DXY) could start a corrective move to the upside, with the 100 level being the critical line in the sand.
Indeed, the index managed to break and hold above this psychological and technical level, currently trading around 100.70, well above the former resistance now turned support.
My bullish outlook remains intact, and I expect the upside continuation to target the 102 zone in the coming sessions.
Conclusion: For pairs like EURUSD and GBPUSD, rallies should be sold as long as this bullish momentum holds. 🚀

Check the trend It is expected that a trend change will form at the current resistance level and we will witness the beginning of a downtrend. If the index breaks through the resistance level, the upward trend will continue to the specified resistance levels. Then, there is a possibility of a trend change at this level.

$DXYTVC:DXY might see a small bull run.
Trump’s executive order to slash prescription drug prices by up to 80% could boost global demand for cheaper U.S. meds, increasing dollar inflows and supporting strength in the greenback.

Viper Sunday Breakdown May11th 2025On Sunday's we give a weekly peek into the markets and see what happened last week and what's possible for the week ahead.
Using the Viper indicator and 3 distinct strategies we breakdown DXY,Gold, US30, Nas100, Oil and Forex pairs.
CPI news coming this week, looking for a great volatile week ahead!!

Bearish revrsal off pullback resistance?US Dollar Index (DXY) is rising towards the pivot and could reverse from this level to the 1st support.
Pivot: 101.78
1st Support: 98.90
1st Resistance: 103.41
Risk Warning:
Trading Forex and CFDs carries a high level of risk to your capital and you should only trade with money you can afford to lose. Trading Forex and CFDs may not be suitable for all investors, so please ensure that you fully understand the risks involved and seek independent advice if necessary.
Disclaimer:
The above opinions given constitute general market commentary, and do not constitute the opinion or advice of IC Markets or any form of personal or investment advice.
Any opinions, news, research, analyses, prices, other information, or links to third-party sites contained on this website are provided on an "as-is" basis, are intended only to be informative, is not an advice nor a recommendation, nor research, or a record of our trading prices, or an offer of, or solicitation for a transaction in any financial instrument and thus should not be treated as such. The information provided does not involve any specific investment objectives, financial situation and needs of any specific person who may receive it. Please be aware, that past performance is not a reliable indicator of future performance and/or results. Past Performance or Forward-looking scenarios based upon the reasonable beliefs of the third-party provider are not a guarantee of future performance. Actual results may differ materially from those anticipated in forward-looking or past performance statements. IC Markets makes no representation or warranty and assumes no liability as to the accuracy or completeness of the information provided, nor any loss arising from any investment based on a recommendation, forecast or any information supplied by any third-party.

DXY Weekly ForecastDXY Weekly Forecast
- in any case DXY has to come down to 96.000 level
"I Found the Code. I Trust the Algo. Believe Me, That’s It."

DXY Will Go Higher! Long!
Please, check our technical outlook for DXY.
Time Frame: 9h
Current Trend: Bullish
Sentiment: Oversold (based on 7-period RSI)
Forecast: Bullish
The market is approaching a key horizontal level 100.428.
Considering the today's price action, probabilities will be high to see a movement to 102.304.
P.S
Please, note that an oversold/overbought condition can last for a long time, and therefore being oversold/overbought doesn't mean a price rally will come soon, or at all.
Disclosure: I am part of Trade Nation's Influencer program and receive a monthly fee for using their TradingView charts in my analysis.
Like and subscribe and comment my ideas if you enjoy them!

DXY 4HR , Daily AnalysisThe DXY is expected to make a minor bullish move until it reaches the 101.56 level. From there, a bearish reversal is anticipated, potentially driving the index lower until it forms a new lower low or reaches the key support zone between 96.80 and 95.40. At that level, a significant bullish reversal or a strong upward movement is likely to occur.

DXY May 11 week in review and week ahead notesDXY
May 11
Week in review
Monday price was in consolidation, Tuesday Price lower to take sell stops creating the low and then started to seek higher prices into Tuesday, Wednesday and Thursday, while Friday retraced Thursday’s delivery. Price broke its range on Thursday for Friday to create the high.
Fridays Delivery
Price was in a premium in Asia Price expanded to take minor buy side. Price reversed to lower prices to noted inefficiencies to rebalance. Price lowered to the .618 to then retrace in NY and went into consolidation to close.
Week ahead
Price on the weekly is a discount
Price current range is a Premium
Previous session is delivering to a discount
Price is seeking higher prices to rebalance a W SIBI and a 4 hour FVG
I suspect that DXY could be shifting to a bull bias in the coming weeks. I note the event horizon at lower prices to keep watch for.
NO news Monday and Wednesday
I suspect for Price to enter Monday with a continuation seeking higher prices to rebalance the 4 hour FVG. Note the equal lows that could be a magnet.
Let Sundays delivery occur and plan from there.

DXY Long Buy Entry To Resistance (Next Week?)DXY: Long buy entry to resistance, not many large buyside wicks to retrace to help push it along but i believe that level will be tested first fairly soon. goodluck fellas.

Dollar Plunge To 97.921: Trump’s Tariff Tsunami Erodes DollarDollar Index fell to 97.921, its lowest since April 2025, as Trump’s aggressive tariffs on critical minerals and China trade retaliation spooked investors.
Analysts warn the dollar’s status as a reserve currency is under threat, with foreign holdings of U.S. assets declining sharply.
However in the short-term, dollar might see appreciation up into premium PD arrays, namely the weekly fair value gap outlined.

Dollar Index (DXY) on the weekly timeframeTwo possible paths for the Dollar Index (DXY), with the price movement in the green path more likely than the red path.
