USD Index preparing for fresh YTD lows?As shown on the daily chart of the USD Index, the currency has been biased to the downside for most of this year and recently met with 1M support at 96.80. This has caused the Index to modestly rebound and retest a 6M resistance at 97.39. Given this level's significance and trend direction, sellers could show from 97.39 and refresh year-to-date lows towards 1Y support at 95.67.
- FP Markets Research Team
USDX trade ideas

Dollar Index OverviewThe Dollar moving as we expect it to within the Gold Fund! As soon as we saw a '5 Bearish Wave Completion' on the DXY, straight away buyers entered the market & start pushing price back up.
My Gold Fund investors & Gold Vault Academy students know from our 'Q3 Market Breakdown Report' what we're expecting for the Dollar in the next 3 months.
Potential USD Strengthening Ahead | DXY vs BTCUSD Outlook
⚡ The DXY has now reached the lower boundary of its long-term ascending channel, a historically significant technical zone where rebounds have occurred in the past.
💡 If this pattern holds, a strong rebound towards the 121 level on the DXY looks probable in the coming months.
What does this mean for BTC?
Historically, a strengthening USD has often resulted in a reciprocal effect on BTCUSD, leading to downward pressure on Bitcoin prices. The chart suggests that if the DXY rebounds as expected, BTCUSD could witness a significant decline proportionate to the USD's strength.
Key Takeaways:
✅ DXY at crucial technical support – rebound likely.
✅ Target for DXY: 121 zone.
✅ BTCUSD may face downside pressure as USD strengthens.
✅ MACD showing early signs of bullish reversal potential for DXY.
Note: This is a technical analysis-based view. Always use risk management and combine multiple factors before trading decisions. For Educational purpose only.
💬 What are your thoughts? Will the USD rally put pressure on Bitcoin again? Share below!

3 key reasons why the U.S. dollar is losing value📉 According to J.P. Morgan, here are 3 key reasons why the U.S. dollar is losing value:
1️⃣ Oil and energy deals are now being done in other currencies
2️⃣ U.S. banks are excluded from new global payment systems
3️⃣ Countries are reducing their USD reserves
The world is slowly shifting away from dollar dependence...
#USD #DollarDecline #JPMorgan #ForexNews #DeDollarization #OilTrade #CurrencyShift #GlobalEconomy #SmartMoney #FXForever #MarketUpdate #ForexTraders #USDBreakdown #EconomicTrends #GlobalFinance

DXY Weekly ForecastDXY Weekly Forecast
- look for down move when reaching 98.00 level
A Message To Traders:
I’ll be sharing high-quality trade setups for a period time. No bullshit, no fluff, no complicated nonsense — just real, actionable forecast the algorithm is executing. If you’re struggling with trading and desperate for better results, follow my posts closely.
Check out my previously posted setups and forecasts — you’ll be amazed by the high accuracy of the results.

$DXY: New lows begets new lows. $USM2: Why is it increasing? Here we are again with one more TVC:DXY chart analysis. I think the US Dollar does not fail to surprise us week after week. Making new lows every week is giving a boost to the Equity markets. The SP:SPX and NASDAQ:QQQ are at ATH. In my articles on April 18 and June 16
Perfect trade setup: AMEX:GLD to 325; DXY to 95 for AMEX:GLD by RabishankarBiswal
TVC:DXY weakness and EM markets: NSE:NIFTY more upside? for NSE:NIFTY by RabishankarBiswal — TradingView
We have time and again said that in the near term TVC:DXY chart looks weak and could touch 95 by end of July. I think it might be achieved earlier. We have looked at the consequences of 95 handle on TVC:DXY on various asset classes like AMEX:GLD , NSE:NIFTY and EMs. These asset classes are reaching ATH every single week. But we have seldom investigated the reason behind the weakness in $DXY. Looking through my macro charts I found an amazing chart which might explain most of this weakness.
The ECONOMICS:USM2 is almost at 22 T $ surpassing its previous high on March 2022. M2 is basically the total amount of money in circulation in the economy on top of the nominal M1. Higher M2 indicates higher amount of liquidity which is then channelized into riskier assets like CRYPTOCAP:BTC , AMEX:GLD , SP:SPX , NASDAQ:QQQ and EMS like $NIFTY. And with such high ECONOMICS:USM2 in circulation, it is very clear why TVC:DXY is making new lows each week. This can also explain why US Fed is hesitant to reduce rates. With M2 so high US Fed should not hurry.
Verdict: TVC:DXY to 95 by 31 July, Cycle low of 90 by year end. ECONOMICS:USM2 keeps increasing. US Fed stays put.

#Dollar / #Bitcoin correlation I've previously described the correlation, and it's clear to everyone: a weaker DXY is positive for BTC.
📝Recently, the dollar has grown significantly and seems close to a local maximum (the chart is inverted). This demonstrates the strength of Bitcoin, as it was able to rise even against a strengthening dollar.
💡Imagine its movement when the new administration plans to lower the dollar price like they did last time. I think we will see a similar scenario as in 2017, when the dollar, from a local maximum, begins to provide a tailwind to the movement of assets that trade against it.

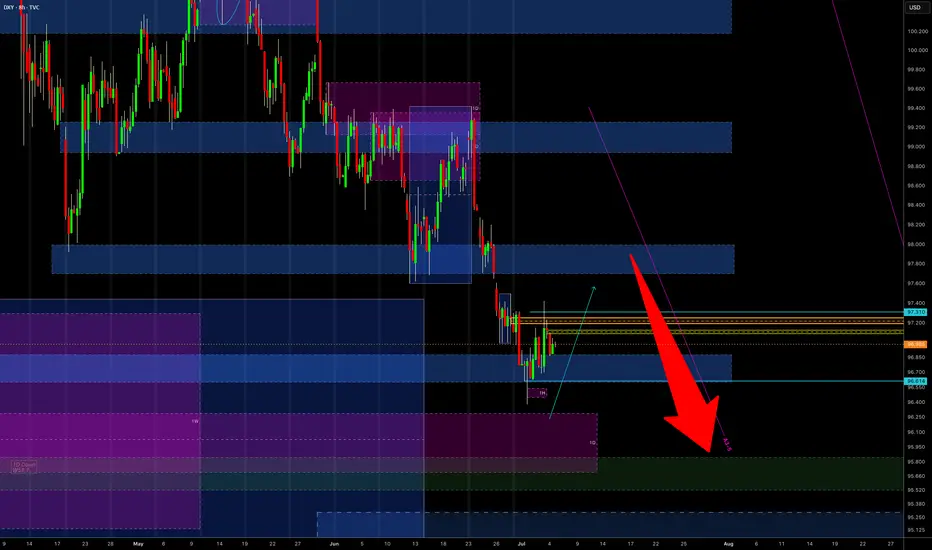
DXY Is Bearish - But A Retest is Highly ProbableThere is no denying that the overall trend is still bearish. However, price is currently respecting an H4 demand zone - which might continue to apply pressure to the upside for a minor correction.
Of course, if this correction does not happen and the H4 demand zone breaks, then we continue to ride the trend to the downside and all the way to the next weekly TF demand zone.
#TheTrendIsYourFriend

DXY HAS VIOLATED KEY SUPPORT ZONE As DXY has violated key support zone. 94.648 which appears to be the next key level must hold, otherwise we may be approaching the 89 zone.

Forex Weekly Round-Up: DXY, GBPUSD, EURUSDKey Price Zones (DXY): 97.422 - 97.685
🟦 DXY (Dollar Index):
On paper, USD had a strong week:
🔹 Durable Goods smashed expectations (+8.6% vs 0.5%)
🔹 PMIs, GDP Price Index, and Jobless Claims came in solid
But the market ignored it:
🔻 Consumer Confidence disappointed (93.0 vs 99.4)
🏠 New Home Sales missed
🕊️ Fed Chair Powell stayed soft — no aggressive tightening talk
Result?
Despite strong fundamentals, DXY broke down, sweeping daily lows and printing fresh bearish structure.
It’s now down ~10% YTD — the worst first half in over 50 years.
📈 EURUSD & GBPUSD: Holding Strong Despite Weak Data
EURUSD
German Retail Sales: –1.6%
Import Prices: –0.7%
ECB tone: muted
Still, EURUSD held daily support and gained — thanks to broad USD weakness.
GBPUSD
Current Account widened (–£23.5B), GDP unchanged
No standout UK catalyst
Yet GBPUSD held its ground and edged higher as DXY continued to fall.
🧠 What This Tells Us
Strong data isn’t always enough.
When price action, market sentiment, and liquidity targets align — they override the numbers.

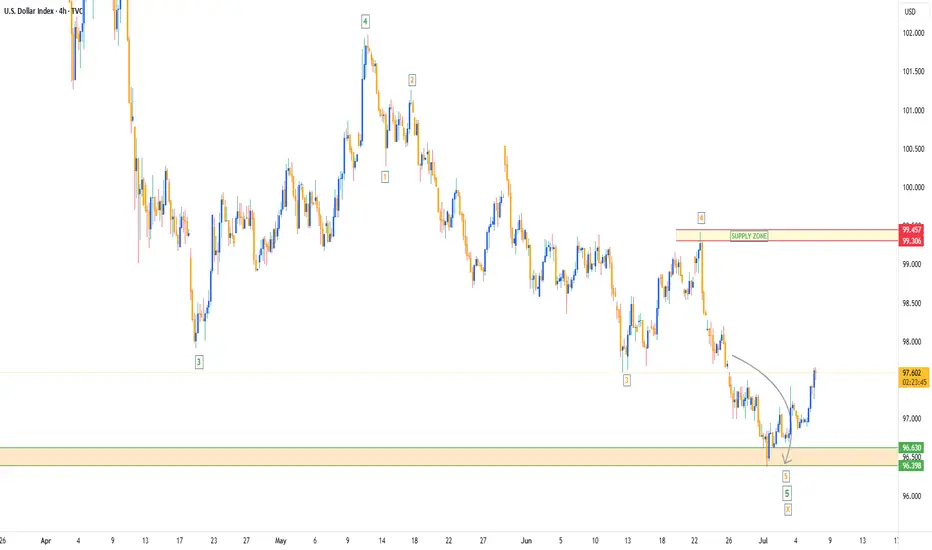
Dollar Index (DXY) Bearish Trend IntactThe Dollar Index (DXY) cycle, originating from its September 2022 peak, remains incomplete and exhibits a bearish outlook, signaling potential for further declines. The descent from the May 29, 2025 high is currently unfolding as a five-wave impulse pattern. From this high, wave ((i)) concluded at 98.35, followed by a corrective rally in wave ((ii)). The rally formed as an expanded flat, peaking at 99.43 as depicted on the one-hour chart below.
Subsequently, the Index extended lower, forming a nested structure. Within this decline from wave ((ii)), wave i bottomed at 97.7, with a corrective wave ii rally reaching 98.2. Wave iii then drove the Index lower to 97, followed by wave iv peaking at 97.49. The final leg, wave v, completed at 96.37, marking the end of wave (i). Currently, a corrective rally in wave (ii) is underway, aiming to retrace the decline from the June 23, 2025 peak. This rally appears to be unfolding as a zigzag pattern, with wave a concluding at 97.15 and wave b dipping to 96.69. Wave c is expected to target the 100%–161.8% Fibonacci extension of wave a, projecting a range of 97.45–97.9.
Should the Index reach this zone, it may encounter selling pressure, potentially leading to further downside or a three-wave pullback. As long as the pivot high at 99.4 remains intact, any rally is likely to falter in a 3, 7, or 11-swing structure, reinforcing the bearish bias for additional declines.

just slightly kidding, yes or no DXY MONTHLYjust slightly kidding, yes or no DXY MONTHLY\
bullish. so very bullish
let us know!
free transparent no edit no delete
🐉We value full transparency. All wins and fails fully publicized, zero edit, zero delete, zero fakes.🐉
🐉Check out our socials for some nice insights.🐉
information created and published doesn't constitute investment advice!
NOT financial advice

DXY This is a strong increase in short positions (more than double).
DXY Sentiment: Bearish
Momentum: Increasing bearish pressure
(Speculators are more confident the dollar will weaken)

DXY Short From Resistance! Sell!
Hello,Traders!
DXY made a nice rebound
From the lows but will soon
Hit a horizontal resistance
Around 97.900 from where
We will be expecting a
Local bearish correction
Sell!
Comment and subscribe to help us grow!
Check out other forecasts below too!
Disclosure: I am part of Trade Nation's Influencer program and receive a monthly fee for using their TradingView charts in my analysis.

DOLLAR DOLLAR index is holding strong and US10Y doing the same .we keep eye on price movement and take action.

Why I haven't posted this week:Hey all,
So, for those of you who watches my videos and market commentary will have noticed that I haven't posted anything this week, event though there were some awesome opportunities to highlight and discuss.
The reason for this is because I am currently conducting work training and was unable to record, however, rest assured that I'll be back next week to break down these markets with you and take advantage of the opportunities lining up.
Up until then keep well and bye for now

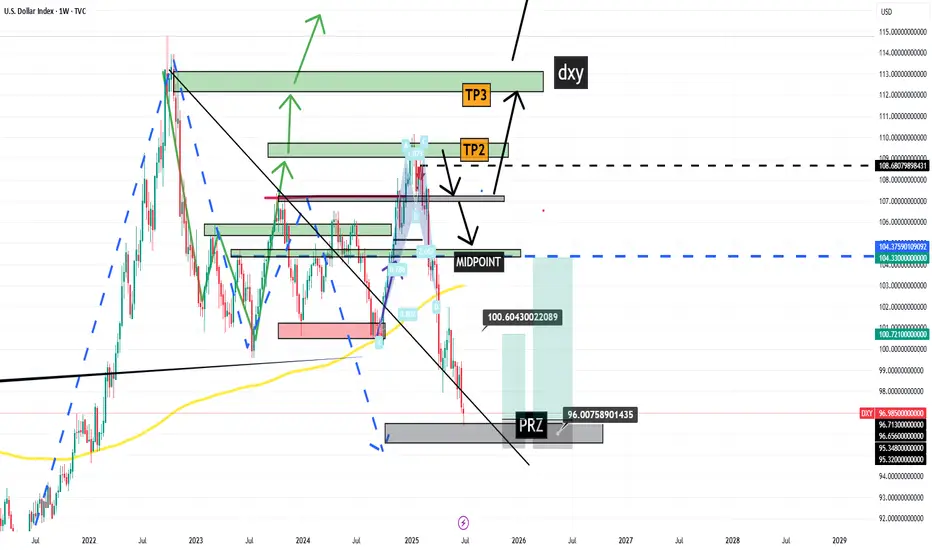
Dollar Index Bearish to $96The DXY has been in a downtrend for a while & that bearish pressure is not over yet. I expect more bearish downside towards the $96 zone, before we can re-analyse the market for any signs of bullish takeover.
⭕️Major Wave 3 Impulse Move Complete.
⭕️Major Wave 4 Corrective Move Complete.
⭕️Minor 4 Waves of Major Wave 5 Complete, With Minor Wave 5 Yet Pending.

Long-term view for DXY!The current market sentiment isn't favorable for the dollar, but it still presents a good buying opportunity for long-term investors—especially for those looking to purchase USD from exchanges without using leverage or taking on trading risks.

The Bessent Effect Explained: Weaken the Dollar The Bessent Effect Explained: Weaken the Dollar
There’s no coincidence that the U.S. dollar has had its worst first half of the year since the dawn of free-floating currencies in the 1970s. And if anyone knows how currencies tick — or unravel — it’s Scott Bessent, the man who once stood behind George Soros during the legendary short of the British pound in 1992. Now, three decades later, Bessent sits at the helm of the most powerful economy in the world, steering the U.S. Treasury through a historic moment: where America is trying to boost exports, undercut foreign currency manipulation, and lighten the crushing weight of debt — all while keeping inflation from boiling over.
Of course, no Treasury Secretary will ever say “we want a weaker dollar”, but if one wanted to do it strategically, they'd need to be part economist, part hedge fund manager and part illusionist.
Enter: The Bessent Effect.
📊 Charting the Decline
• After Election Day (BLUE LINE), the DXY marched upward, peaking near 109 — a reflection of market optimism or a dash of geopolitical anxiety.
• By Inauguration Day (REDLINE), that trend began to unwind. Investors started to squint at the fiscal roadmap and didn't love what they saw.
________________________________________
Debt Strategy Rhetoric: PURPLE LINE
In early February, Treasury Secretary Scott Bessent addressed the U.S. debt issuance strategy. While he openly criticized his predecessor’s reliance on short-term debt, his first major move was paradoxical: he continued that very approach, opting to maintain a heavy focus on short-term issuance while holding off on extending maturities. This subtle decision screamed one thing for markets: rollover risk. What if rates stay high? What if inflation persists? What if buyers disappear?
Result? The dollar started sliding faster.
________________________________________
Liberation Day: YELLOW LINE
On April 2, “Liberation Day” tariffs were announced. Potential retaliation from China and Mexico, and now you've got cross-border chaos. Trade wars spook global markets, slash demand for U.S. assets, and drive capital into gold and foreign currencies. The dollar’s dominance doesn’t vanish overnight — but the cracks begin to show.
________________________________________
Easing of SLR Announced: PINK LINE
On May 23, just when the DXY needed a break, Bessent went on Bloomberg and said, “We are very close to moving” on the Supplementary Leverage Ratio (SLR). Translation? Banks may soon face eased capital rules, making it easier for them to buy Treasuries.
Markets took it as regulatory backdoor stimulus — a shadowy workaround to support Treasury demand without triggering money printers. But it also raised fears about systemic risk, inflation, and policy overreach. The DXY barely blinked before continuing its methodical march lower.
________________________________________
But What If...
What if Bessent’s moves aren’t missteps, but part of a calculated devaluation strategy? A weaker dollar makes U.S. exports more competitive, revives domestic manufacturing, and reshapes global trade dynamics. By subtly bending the rules (instead of breaking them), Bessent may be re-engineering the dollar's role—less as a global anchor, more as a tool for national advantage. By easing the SLR, he may have discovered a subtle way to bring down the long end of the yield curve.
If it’s not currency destruction. Maybe it’s precision macro strategy?
________________________________________
What’s Next?
Sure, the DXY might bounce a little — even bad news needs a break. But what could drive it even lower?
How about the loss of Federal Reserve independence?
Luckily, that’d only happen if there were whispers of a “shadow Fed chair” waiting in the wings. But that’s just conspiracy talk... right?
Follow on X: @TheAlphaView

U.S. dollar index DXY analysis- daily time frame ✅ U.S. Dollar Index (DXY) Analysis — Daily Timeframe
👤 A TVC:DXY trader’s perspective:
When I look at this chart, several key points immediately stand out:
1️⃣ Long-Term Trend
On the weekly and daily timeframe, the major trend has turned bearish after peaking around 114. We see a clear series of lower highs and lower lows confirming the downtrend.
The sharp rally from 89 to 114 in the past was a strong impulsive move, which is now undergoing a deep correction. Currently, price is hovering around a major historical support near 96.
2️⃣ Key Support Zone
The current price near 96.7 is sitting right at a significant support area that has triggered considerable buying interest in the past.
If this support decisively breaks, the green zone marked as DD (around 93–95) represents a strong long-term demand zone and will likely be the next liquidity target for buyers.
3️⃣ Resistance (Supply Zones)
The four red-marked 4HR zones between 97 and 101.9 clearly show significant supply zones where sellers have stepped in on lower timeframes.
Should the price attempt a bounce from current levels, these resistance areas may act as a strong barrier to further upside.
4️⃣ Price Structure and Liquidity
Looking more closely, the market seems to be moving from a consolidation phase toward lower support liquidity. That means there is a high probability of a liquidity grab toward the 93–95 area before a potential fresh bullish leg.
At higher levels, unless the price can break and hold above 98 and then 100, we cannot confirm a trend reversal.
🔹 Summary
✅ Overall downtrend remains dominant
✅ 96–97 is a critical support zone
✅ A break below this support targets 93–95
✅ Trend reversal only possible with a confirmed break and hold above 98, and then 100–101
✅ The 4HR resistance zones (97–101) are strong hurdles for any bullish retracement
✅ As long as price remains below 98, any rally is likely just a corrective move
⚠️ Disclaimer: This analysis is for educational and informational purposes only and does not constitute financial advice or a recommendation to buy or sell. All trading decisions are solely your own responsibility.

DXY QUITE BEARISH ON WEEKLY DXY might just drop to previous low of May 2021 at the 89 if this weekly downtrend continues
