Bearish reversal?USDX is rising towards the resistance level which is a pullback resistance that aligns with the 78.6% Fibonacci retracement and could reverse from this level to our take profit.
Entry: 103.43
Why we like it:
There is a pullback resistance level that aligns with the 78.6% Fibonacci retracement.
Stop loss: 104.13
Why we like it:
There is a pullback resistance level.
Take profit: 102.30
Why we like it:
There is a pullback support level.
Enjoying your TradingView experience? Review us!
Please be advised that the information presented on TradingView is provided to Vantage (‘Vantage Global Limited’, ‘we’) by a third-party provider (‘Everest Fortune Group’). Please be reminded that you are solely responsible for the trading decisions on your account. There is a very high degree of risk involved in trading. Any information and/or content is intended entirely for research, educational and informational purposes only and does not constitute investment or consultation advice or investment strategy. The information is not tailored to the investment needs of any specific person and therefore does not involve a consideration of any of the investment objectives, financial situation or needs of any viewer that may receive it. Kindly also note that past performance is not a reliable indicator of future results. Actual results may differ materially from those anticipated in forward-looking or past performance statements. We assume no liability as to the accuracy or completeness of any of the information and/or content provided herein and the Company cannot be held responsible for any omission, mistake nor for any loss or damage including without limitation to any loss of profit which may arise from reliance on any information supplied by Everest Fortune Group.
USDX trade ideas
Dollar is ready to continue its explosive move upwards TVC:DXY is looking HUGE the support is holding and getting bought up while putting up more technical supports everywhere needed for it to carve out a bottom. The big intersection between the wedge and the inverse head and shoulders scream cash is currently a buy
DXY & BTC FOR NIGHT OWLSDXY & BTC FOR NIGHT OWLS
You know, last Friday night I posted that DXY would see a corrective upward move toward the 104–105.3 range—just a corrective rise, mind you.
At this moment, there’s a bit of a conflict between DXY and BTC. DXY wants to edge up slightly to that range after bottoming out around 101.7. Meanwhile, BTC is stuck, unable to rise alongside DXY, even though they’re currently in the same structural boat.
This very “stuck” situation is what gave you a short position down below 74k—lower than the previous bottom of 76k. So now, as DXY climbs, BTC has the conditions to follow DXY’s lead.
Here’s a key reminder: right now, DXY, BTC, and stocks (CK) are on the same team.
XAU (gold), GBP, and EUR are on the opposing team.
In the medium term, the gold camp has already taken profits, and naturally, GOLD will decline. Medium-term money is shifting back to USD and BTC.
Will this shift provide enough momentum for BTC to surge strongly again? I don’t think so—not yet. DXY will likely cut interest rates soon, and the act of devaluing the US dollar’s peg will kick off shortly after.
Enjoy the read!
DXY s my primary indicator for all usd related pairsSince i have already sent the GOLD Set , this dollar index is showing bearish and the key zone having too much support meaning dollar has a potential of goin weak again , opening oppotunities for new high break on Gold , Gold is investly proposional to the direction of dollar index streangth
Market Insights with Gary Thomson: April 7 - 11Market Insights with Gary Thomson: FOMC Minutes, US Inflation Rate, US PPI, Earnings Reports
In this video, we’ll explore the key economic events, market trends, and corporate news shaping the financial landscape. Get ready for expert insights into forex, commodities, and stocks to help you navigate the week ahead. Let’s dive in!
In this episode, we discuss:
- FOMC Meeting Minutes
- US Inflation Rate
- US Producer Price Index
- Corporate Earnings Statements
Don’t miss out—gain insights to stay ahead in your trading journey.
This video represents the opinion of the Companies operating under the FXOpen brand only. It is not to be construed as an offer, solicitation, or recommendation with respect to products and services provided by the Companies operating under the FXOpen brand, nor is it to be considered financial advice.
DeGRAM | DXY continues to growDXY is in a descending channel between trend lines.
The price is moving from the lower boundary of the channel.
During the momentum corrections, the chart successfully maintained the structure and held the 50% retracement level.
We expect the upward movement in the channel to continue.
-------------------
Share your opinion in the comments and support the idea with like. Thanks for your support!
DeGRAM | DXY dollar in the turbulence zoneDXY is in a descending channel under the trend lines.
The price is moving from the upper boundary of the channel.
After breaking the trend line, the chart went sharply lower amid the announcement of trade duties, after which it formed a gap.
On the main timeframes indicators have gone into the oversold zone.
We expect that the index will seek to close the gap after testing the lower boundary of the channel.
-------------------
Share your opinion in the comments and support the idea with like. Thanks for your support!
DXY Bearish trend continues on SSL and Bearish ORDER BLOCKDXY is known for extreme liquidity grabs especially after Trump's tariff announcements. Until we see countries remove tariffs and companies changing factory locations DXY will still be week. A decent pullback this week?? Probably not, Next? Maybe STAY SHARP!!
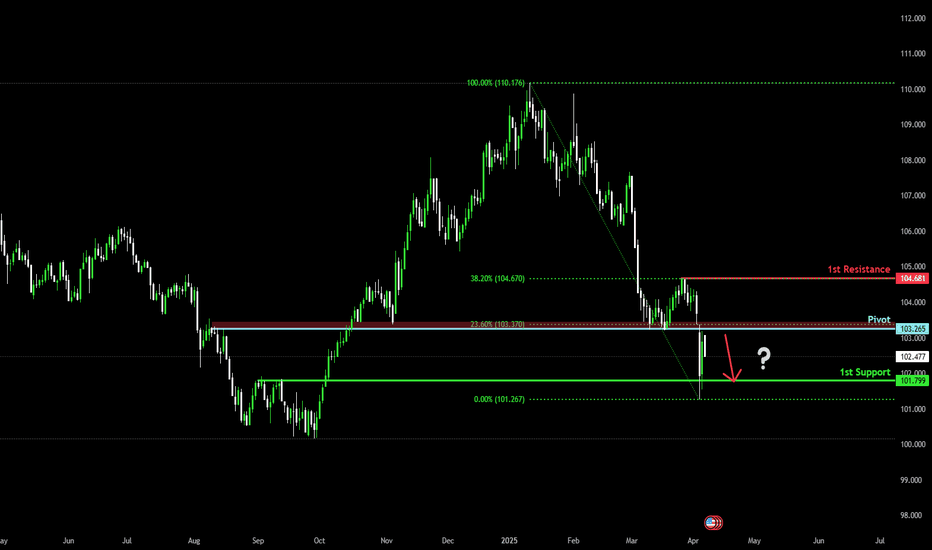
Bearish continuation?US Dollar Index (DXY) is rising towards the pivot an could drop to the 1st support.
Pivot: 103.26
1st Support: 101.79
1st Resistance: 104.68
Risk Warning:
Trading Forex and CFDs carries a high level of risk to your capital and you should only trade with money you can afford to lose. Trading Forex and CFDs may not be suitable for all investors, so please ensure that you fully understand the risks involved and seek independent advice if necessary.
Disclaimer:
The above opinions given constitute general market commentary, and do not constitute the opinion or advice of IC Markets or any form of personal or investment advice.
Any opinions, news, research, analyses, prices, other information, or links to third-party sites contained on this website are provided on an "as-is" basis, are intended only to be informative, is not an advice nor a recommendation, nor research, or a record of our trading prices, or an offer of, or solicitation for a transaction in any financial instrument and thus should not be treated as such. The information provided does not involve any specific investment objectives, financial situation and needs of any specific person who may receive it. Please be aware, that past performance is not a reliable indicator of future performance and/or results. Past Performance or Forward-looking scenarios based upon the reasonable beliefs of the third-party provider are not a guarantee of future performance. Actual results may differ materially from those anticipated in forward-looking or past performance statements. IC Markets makes no representation or warranty and assumes no liability as to the accuracy or completeness of the information provided, nor any loss arising from any investment based on a recommendation, forecast or any information supplied by any third-party.
Weekly FOREX Forecast: Buy EUR, GBP, AUD, NZD vs USDThis is an outlook for the week of April 7 - 11th.
In this video, we will analyze the following FX markets:
USD Index
EUR
GBP
AUD
NZD
CAD
CHF
JPY
Wait for the market to tip its hand! Monday is a no red folder news day. Great time to let the markets settle on a direction.
Trading a market after a huge push in one direction can be tricky. There is likely to be a pullback before continuing the overall trend. Bear this in mind with the USD.
Enjoy!
May profits be upon you.
Leave any questions or comments in the comment section.
I appreciate any feedback from my viewers!
Like and/or subscribe if you want more accurate analysis.
Thank you so much!
Disclaimer:
I do not provide personal investment advice and I am not a qualified licensed investment advisor.
All information found here, including any ideas, opinions, views, predictions, forecasts, commentaries, suggestions, expressed or implied herein, are for informational, entertainment or educational purposes only and should not be construed as personal investment advice. While the information provided is believed to be accurate, it may include errors or inaccuracies.
I will not and cannot be held liable for any actions you take as a result of anything you read here.
Conduct your own due diligence, or consult a licensed financial advisor or broker before making any and all investment decisions. Any investments, trades, speculations, or decisions made on the basis of any information found on this channel, expressed or implied herein, are committed at your own risk, financial or otherwise.
U.S. Dollar Index (DXY) - Bearish Breakdown or Reversal?📊 U.S. Dollar Index (DXY) - 4H Chart Analysis
🔵 Supply Zone (104.400 - 104.683)
🟦 Resistance area where sellers may step in 📉
🟡 Key Level (~104.200)
🟧 Decision point – price struggling to hold this level
📉 Trend Line (Broken) 🔻
❌ Previous uptrend is broken, signaling potential bearish momentum
🟢 Demand Zone (103.200 - 103.400)
🟩 Support area where buyers may get active 📈
🚀 Potential Market Movement:
1️⃣ Bearish Breakdown Expected ⬇️
🔹 Price broke below trendline ➡️ selling pressure increasing
🔹 Possible pullback to key level (~104.200) before more downside
🔹 Targeting demand zone (~103.200-103.400) 🎯
2️⃣ Invalidation/Stop-Loss 🚫
🔺 If price moves back above 104.683, bearish setup is invalid
🔺 Stop-loss placed at 104.683 for risk management
🎯 Trading Strategy:
✅ Short Entry: After pullback near 104.200
🎯 Target: 103.200 demand zone
⚠️ Stop Loss: Above 104.683
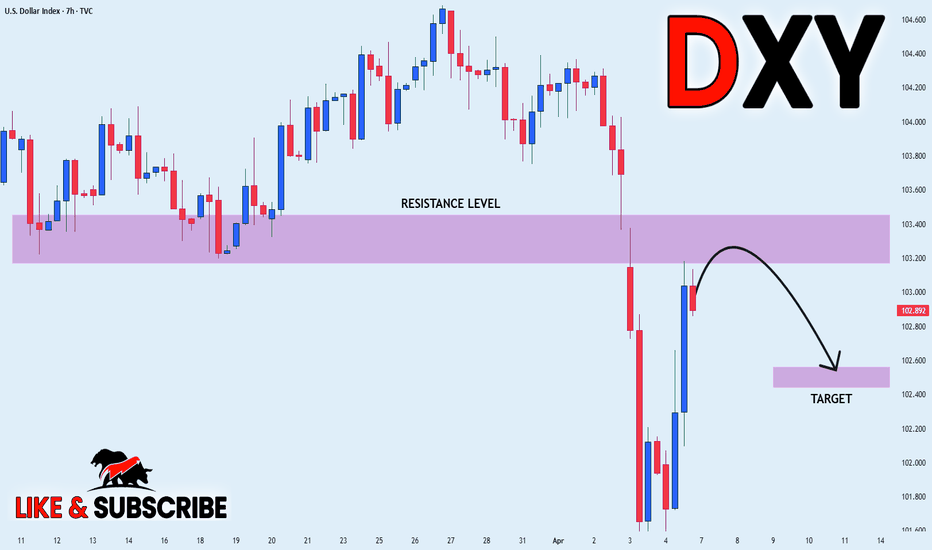
DXY PULLBACK EXPECTED|SHORT|
✅DXY surged again to retest the resistance of 103.400
But it is a strong key level
So I think that there is a high chance
That we will see a bearish pullback and a move down
SHORT🔥
✅Like and subscribe to never miss a new idea!✅
Disclosure: I am part of Trade Nation's Influencer program and receive a monthly fee for using their TradingView charts in my analysis.
DXY (USDX): Trend in daily time frameThe color levels are very accurate levels of support and resistance in different time frames, and we have to wait for their reaction in these areas.
So, Please pay special attention to the very accurate trend, colored levels, and you must know that SETUP is very sensitive.
BEST,
MT


