DXY Weekly ForecastDXY Weekly Forecast
- Go for up move if setup given
A Message To Traders:
I’ll be sharing high-quality trade setups for a period time. No bullshit, no fluff, no complicated nonsense — just real, actionable forecast the algorithm is executing. If you’re struggling with trading and desperate for better results, follow my posts closely.
Check out my previously posted setups and forecasts — you’ll be amazed by the high accuracy of the results.
"I Found the Code. I Trust the Algo. Believe Me, That’s It."
USDX trade ideas

$DXY Looks like a long.If the TVC:DXY can hold this trend line, it would suggest a bounce back up to the resistance.
makes sense if the yields end up higher at some point.
Will see
DXY 4hour TF - June 29th, 2025DXY 6/29/25
DXY Bearish Idea
All significant timeframes (monthly,weekly,daily 4hr) appear bearish for now.
Last week on June 25th, 2025 we saw price action break through our 98.000 zone confirming more bearish movement. This week we have two likely options that we will wait for confirmation on.
Bearish Continuation - Ideally we keep with the trend and look for lower highs below 98.000 for further confirmation. If we can spot rejection from this zone it is likely we will see DXY continue bearish for the week ahead.
Reversal - This is less likely but still possible. Price action could punch back through the 98.000 resistance and begin retesting previous highs. If this happens look for candlestick confirmation above 98.000 and expect a more bullish DXY for the week ahead.

DXY TURNS BULLISH, SELL EURUSD, GBPUSDDxy is now bullish, I said it last week and I'm saying it again. Nothing has changed, this means we sell EURUSD, GBPUSD etc.
I publish DXY chart because it shows what im expecting in other dollar pairs without having to publish them.
Follow me as my trades are market order, so you will see it on time and enter on time

Forex Weekly Round-Up - 30th Jun 25Dollar Index:
Dollar Index declined further, hovering near 97.0–96.9 — its weakest level since February 2022.
Key Driver: Markets digested a slightly hotter US core PCE inflation report (+2.3% YoY for May), paired with weak personal spending, reinforcing expectations that the Federal Reserve might pivot to rate cuts later this year.
GBPUSD:
The pound surged, touching highs around 1.3770 — its strongest in nearly four years — before dipping slightly to finish the week near 1.3720
Weekly gain clocked in around +2%, the largest move since early March
Rally Fuelled By : Broader dollar weakness, easing Middle East tensions (ceasefire), and dovish Fed signals suggesting potential rate cuts.
EURUSD
The euro enjoyed a rally, peaking near 1.1754 — its highest since September 2021 — before closing the week around 1.1720
Weekly gain came to approximately +1.7% to +1.9%, driven by euro strength and broad weakness in the US dollar
Traders are eyeing upcoming US data (PCE inflation, Michigan sentiment) for next directional cues
------------------------------------
I will be approaching the markets differently from now on.
Based on the feedback from past analysis, I will be compiling all related pairs into one video, giving you guys the ability to see how one asset affects the other.
This is called inter-market relationship and it's something i've been doing for years.
It gives you confidence on what pairs are 'Hot Picks' and the ones that have a high chance of not delivering the way you want.


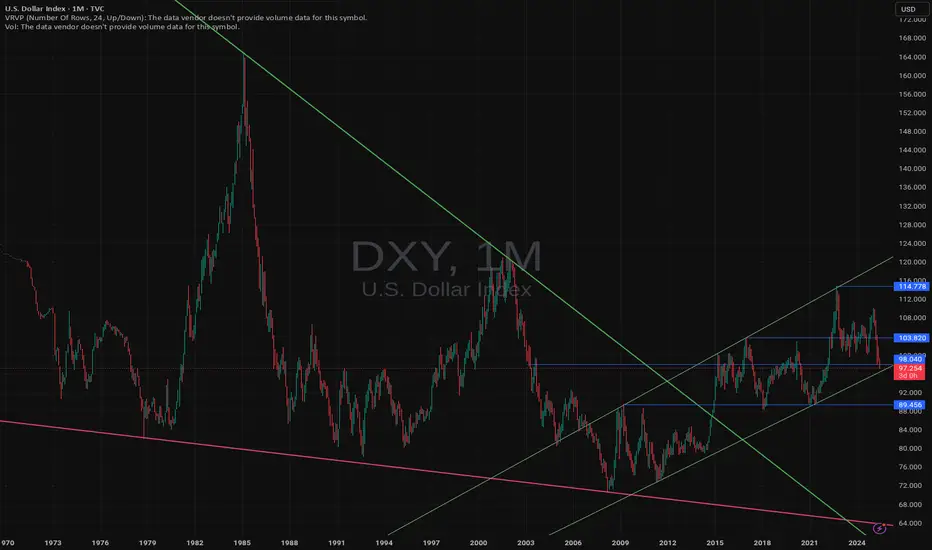
DXY Short-term rebound quite likely.The U.S. Dollar index (DXY) has been trading within almost a 3-year Channel Down, which has assisted us in choosing the right levels to sell high and buy low.
Despite being now on its 2nd major Bearish Leg, we see a short-term bounce possibly up to August quite likely based on the previous major Bearish Leg. As you see, the current setup resembles the April 13 023 Low after which the price rebounded short-term just above the 0.786 Fibonacci level, only to get rejected later and complete the bottom on the 1.1 Fib extension.
Even the 1W RSI sequences between the two fractals are identical. Therefore, before diving below 96.000, we believe a 100.000 test is quite likely.
-------------------------------------------------------------------------------
** Please LIKE 👍, FOLLOW ✅, SHARE 🙌 and COMMENT ✍ if you enjoy this idea! Also share your ideas and charts in the comments section below! This is best way to keep it relevant, support us, keep the content here free and allow the idea to reach as many people as possible. **
-------------------------------------------------------------------------------
💸💸💸💸💸💸
👇 👇 👇 👇 👇 👇

$DXY Repeating 2016 Post-Election I have highlighted the 2016 to 2020 Presidential Elections time period and then pasted that timeframe onto the 2024 election and found that the pattern is going along very similarly to Trump 1.0.
If we assume that the future unfolds the same as last time, which is low probability, of course, then the future will unfold as shown in the yellow bars going into the future, as shown.
Initially in 2016 post election there was a 7% rally in the U.S. Dollar Index and then a 15% retreat for the following year. So far in 2025 we have seen the same rally and a similar decline, but only faster this time.
It would appear as thought the bulk majority of the declines in the TVC:DXY are over at this time with perhaps 4% further downside over the balance of the year.
The Dollar Index has been useful for predicting changes in the earnings estimates for the S&P500 in the USA due to the high percentage of earnings coming back to the US for quarterly reporting. I have posted a few charts in the past which have been helpful at determining the risk in the stock market.
The behavior of the global central banks has certainly had its impact on monetary aggregates and inflation. The policy response since the Covid Pandemic has been for maximum liquidity and maximum Government spending to keep the global economy afloat. The post-Covid response is now coming to a head along with new policy directives to cut wasteful Government spending and to reduce inflation (caused the Gov't spending).
Global investors have flocked to the US for access to high technology stocks and have driven up the value of US assets to extreme levels compared to other markets. This adjustment phase where investors remove money from overvalued, or highly valued, US assets back to other markets has created a wave of selling in the US Dollar and US listed equities.
What does the future hold? We never know but we sure can learn from what happened in the past by looking at charts just like this one to see what may happen. Looks like a bounce in the TVC:DXY from here, followed by a new low and then a rebound into the next few years.
All the best,
Tim
April 22, 2025 1:16PM EST TVC:DXY 98.78 last

Outlook for Trump's Second TermExpecting price to retest the bottom descending channel and return to the moving averages next year. From there, price will likely rebound hard and surge back upwards to continue the muti-decade ascent.

USDX-BUY strategy 6 hourly chart Reg. ChannelThe index is near the bottom of the channel and indicators are positive.
It worthwhile to look at this carefully, as it will help us in deciding on the other pairs. The current support is a bit lower than the close 97.26 and we can expect 98.30-98.60 area as our objective.
Strategy BUY @ 97.00-97.40 and take profit near 98.50.


DOLLAR INDEX (DXY): Critical Moment
With an unprecedented pace of weakness of US Dollar,
DXY Index is now testing a historic weekly support cluster.
If the market breaks it today and closes below that, it will
open a potential for much more depreciation.
Next historic support will be 95.5 and a downtrend will continue.
Today's US fundamentals can be a trigger.
Please, support my work with like, thank you!

Dollar Bullish Correction To $103 - $105While we expected to see some Dollar upside in Q2, the economy was in such a bad state that the Dollar could not hold its value. Since the start of 2025 the Dollar is down 12% and this is only the beginning.
I believe we will see more downside in the future. But for the coming quarter there is a chance for the Dollar to get some breathing space & recover in the short term. Overall, the trend of the Dollar remains bearish, so what we want to keep an eye on is small pumps (short term recovery) into price zones which will allow us to short the Dollar back down.
I want to see a dip lower towards $96 - $94 before sellers lose bearish momentum. If this move takes place, then we can slowly see buyers step back into the market & start pushing back to the upside. Once price hits our ‘Supply Zone’ of $103 again, it’ll give us a more clear indication of what the Dollar will do next; whether that’s a longer term uptrend or a continuation to the downside.

US Dollar Index (DXY) – Testing Long-Term Channel SupportBy MJTrading:
Chart Overview:
The US Dollar Index has now approached a major technical confluence zone that could define the next directional move. Price is pressing into the Danger Zone near the lower boundary of a multi-year descending channel, with an Ultimate Oversell Target sitting just below.
🔹 Key Technical Highlights:
Long-Term Down Channel (Daily & Weekly):
The DXY has respected this structure for several years.
Price is currently challenging the lower boundary, a zone where reactions often occur.
Danger Zone (~95–96):
A historically reactive area.
Prior demand and channel floor converge here.
Ultimate Oversell Target (~89–90):
Marked as a deeper potential exhaustion area if the channel fails.
Moving Averages:
15 EMA ~97.8
60 EMA ~99.3
Price remains below both EMAs, confirming persistent bearish momentum.
🔹 Potential Scenarios:
Scenario A (Green Path):
A bounce off current support could trigger a relief rally back toward 98–100, targeting the mid-channel and EMAs.
Scenario B (Red Path):
A breakdown below ~95 could accelerate selling pressure, aiming for the Ultimate Oversell Target (~89).
🔹 How I See It:
This is a high-risk inflection zone. Any bullish setups here remain counter-trend and require confirmation via strong reversal signals. Conversely, a decisive breakdown could have significant implications for USD pairs and commodities.
💡 Notes:
This chart includes the weekly inset view for broader context.
Keep risk management tight in this volatile area.
🔹 Reminder:
This idea is for educational purposes only—not financial advice.
💬 How are you positioning around the USD? Share your thoughts and charts below!
#Hashtags:
#MJTrading #DXY #USDollarIndex #Dollar #Forex #TechnicalAnalysis #TradingView #ChartAnalysis #PriceAction #FX #USD #Majors #DollarWeakness #DollarStrength #SupportAndResistance #TrendAnalysis #MarketOutlook

I dare say, DXY has bottomed, only higher from now on!This is the low on DXY. It can range from here or glide up slowly.
DXY is predictable this year because Trump is unpredictable. Causing the market to just repeat history. Check DXY on 2017
Conservative traders can wait for 4hrs close before entering.
The SL and TP are outlined on the chart.
Enjoy

DXY Technicals Add Pressure on FED Data〽️Weekly RSI Divergence Spotted in the US Dollar Index (DXY)
A bearish divergence has emerged on the weekly RSI chart of the US Dollar Index (DXY), signaling a potential loss of upward momentum. Historically, such divergences often precede price corrections or reversals.
✅Market Implications:
USD pairs, gold, and crypto assets may see retracement as dollar strength wanes in response to technical exhaustion.
Traders should watch for signs of consolidation or reversal in assets inversely correlated with the dollar, such as gold (XAU/USD) and Bitcoin (BTC/USD).
📈Macro Outlook:
All eyes on the Federal Reserve: The divergence adds weight to market speculation that the Fed might pivot toward a rate cut at its July 15 meeting.
If confirmed, rate cuts could further pressure the dollar, accelerating moves in risk-on assets and emerging market currencies.
#XAUUSD
#DXY
#BTCUSD
#tgifx

Skeptic | Weekly Watchlist : DXY Triggers & Pro SetupsLast week, DXY played out our bearish scenario perfectly, breaking the short trigger at 98.530 and delivering a strong downward move . With Higher Wave Cycle (HWC) and Minor Wave Cycle (MWC) now bearish, I’m leaning heavier on short positions with tighter risk management. Let’s break it down with no FOMO, no hype, just reason. 📊
Daily Timeframe: The Big Picture
The key support at 98.801 was decisively broken, and we’ve confirmed below it—the major trend is now fully bearish. The next daily support lies at 96.478 , but I expect range-bound action early this week, especially after last week’s big move. Patience is key—let the market form a clear structure before jumping back in.
Key Insight: The bearish trend is locked in, but early-week consolidation is likely. Wait for the market to signal its next move.
4-Hour Timeframe: Long & Short Triggers
Zooming into the 4-hour chart, let’s pinpoint Low Wave Cycle (LWC) and triggers for long and short setups:
Short Trigger: Break below 4-hour support at 96.995 , confirmed by RSI re-entering oversold. Want to wield RSI like a pro? Check out my RSI Masterclass —it’s a game-changer! 😏
Long Trigger: Break above resistance at 98.215 . This is riskier since it’s against the bearish trend—set a wider stop-loss and take profits quickly. Why? HWC and MWC are bearish, so the first uptrend wave risks stop-loss hunts or fakeouts. I’ll drop an HWC/MWC/LWC guide soon to optimize entries, stops, and more—stay tuned!
Pro Tip: For longs, expect volatility in the first wave. Shorts align with the trend, so they’re the safer play—focus on 96.995.
Final Vibe Check
This Weekly Watchlist sets you up to trade smarter, not harder. DXY’s bearish momentum is our focus, but patience will unlock the best setups. I’ll keep you updated daily as markets evolve. Protect your capital—max 1%–2% risk per trade, no exceptions. Want the HWC/MWC/LWC guide or another pair? Drop it in the comments! If this watchlist sharpened your edge, hit that boost—it fuels my mission! 😊 Stay disciplined, fam! ✌️
💬 Let’s Talk!
Which setup are you eyeing this week? Share in the comments, and let’s crush it together!

“The Dollar Job: Break-In Strategy for 99+ Profits”💸 “DXY Heist Blueprint: Thieves’ Bullish Breakout Play” 🏴☠️
🌟Hi! Hola! Ola! Bonjour! Hallo! Marhaba!🌟
Welcome, Money Makers & Silent Robbers 🕶️💼✨
This is our next big Thief Trading Heist Plan targeting the 💵 DXY Dollar Index Vault. Armed with both technical precision 🔍 and fundamental insight 📊, we're ready to strike smart — not just fast.
🎯 THE MASTER HEIST PLAN:
🟢 ENTRY POINT – “Heist Entry Protocol”
🎯 Wait for price to break above Resistance @ 99.000 and candle to close ✅
💥 Plan A: Place Buy Stop Orders just above breakout
📥 Plan B: For Pullback Pros, use Buy Limit at recent swing low/high (15m–30m TF)
📌 Tip: Set alerts — don’t get caught napping while the vault opens! ⏰🔔
🛑 STOP LOSS – “Thief’s Escape Hatch”
🧠 Use 4H swing low at 98.100 as SL
⚖️ Adjust based on your lot size and number of open positions
🚨 Don't rush to set SL for Buy Stop entries before confirmation! Patience is part of the plan. 😎
🎯 TARGET – “Mission Objective”
💰 First Exit Target: 100.000
🏃♂️ Optional: Escape earlier near high-risk zones (Blue MA Line Trap Area)
⚔️ SCALPERS' CODE – Stay Sharp!
Only scalp on the Long side.
🔐 Use Trailing SL to guard your loot!
💸 Big wallets? Jump early.
🧠 Smaller stack? Follow the swing crew for coordinated execution.
🌐 MARKET OUTLOOK: WHY THE VAULT’S OPENING
💡 Currently seeing bullish momentum in the DXY
📈 Driven by macroeconomics, sentiment shifts, and intermarket pressure
📰 Want the full debrief? Check our analysis across:
COT Data
Geopolitics & News
Macro Trends & Sentiment
Fundamental Forces
📎🔗 See full breakdown
⚠️ TRADE MANAGEMENT ALERT
🚫 Avoid opening new trades during high-impact news
🔁 Always use Trailing Stops to lock in profits
❤️ Support The Heist – Boost the Plan!
Every boost powers our underground crew 🐱👤.
We rob the markets, not the people. 💼💰
Like & Boost to help grow the Thief Trading Gang 👊💥
Stay tuned, robbers – more heist plans dropping soon.
💸🚀📈🤑

Bull Flag on DailyDXY looking bullish on the daily timeframe with a bull flag noticed. Bullish confirmation candles should be looked out and confirmed before placing any long positions

DXY Swing Short! Sell!
Hello,Traders!
DXY keeps falling down
And the index broke the
Key wide horizontal level
Around 97.800 which is now
A resistance and the breakout
Is confirmed so we are very
Bearish biased and we will
Be expecting a bearish
Continuation on Monday
Sell!
Comment and subscribe to help us grow!
Check out other forecasts below too!
Disclosure: I am part of Trade Nation's Influencer program and receive a monthly fee for using their TradingView charts in my analysis.

DXY STRONG DOWNTREND CONTINUES|SHORT|
✅DXY is going down currently
In a strong downtrend and the index
Broke the key structure level of 98.000
Which is now a resistance,
And after the pullback
And retest, I think the price
Will go further down next week
SHORT🔥
✅Like and subscribe to never miss a new idea!✅
Disclosure: I am part of Trade Nation's Influencer program and receive a monthly fee for using their TradingView charts in my analysis.

DXY ANNALSIS OUTLOOK BULLISH POSIBLE MOVEWS 28/6/2025strong buy 97.000
buy 96.800
going on bullish moves
buyers and sellers
ready to new months new week's
buy 97.000
take profit 97.400
take profit 97.800
take profit 98.500
stop los 96.600

DXY Bearish - 4HR Sell Side LiquidityDXY Bearish - 4HR Sell Side Liquidity - very likely DXY will push down this week and take out the SSL
