Long term Long!Hello all. as you see my last Long term forecast was exact and I think it is time to go up. it is risky.(wink)
USDX trade ideas

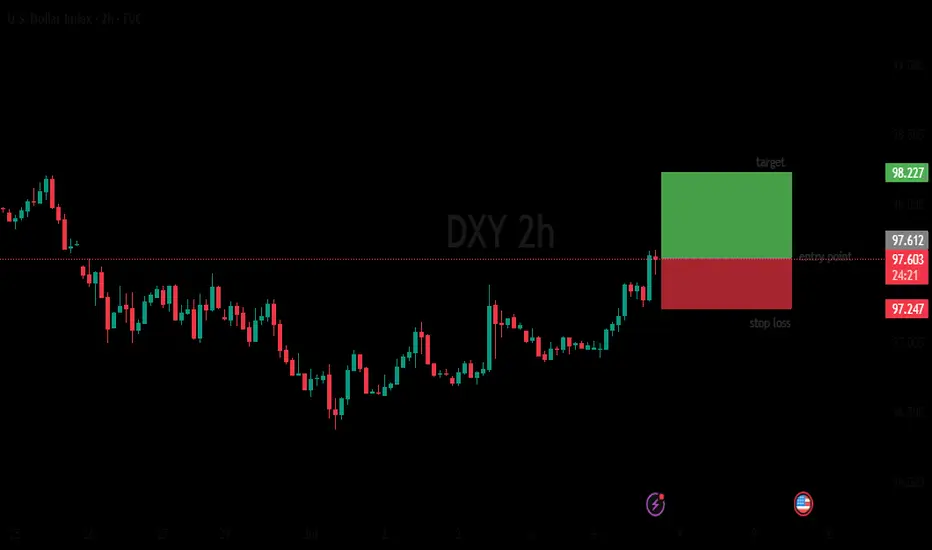
DXY ready to push upThe first trade got stopped out. Entered too early.
There is nothing stopping us now.
This means that we sell EURUSD, GBPUSD etc
Enjoy

DXY: Strong Bullish Sentiment! Long!
My dear friends,
Today we will analyse DXY together☺️
The price is near a wide key level
and the pair is approaching a significant decision level of 96.899 Therefore, a strong bullish reaction here could determine the next move up.We will watch for a confirmation candle, and then target the next key level of 97.077.Recommend Stop-loss is beyond the current level.
❤️Sending you lots of Love and Hugs❤️

Free fall on DXY?With gap open at 97.66 level before the monthly close price has broken the monthly support and started to drop. We may see the price to drop to long term monthly support at 96.622 or further below to 95.66 as with the increased bearish pressure we may see the price to continue to drop to this longer term support level.
As with upcoming USD news we may see the price to move to this level with high probability bearish trend.

DXY Elliott Wave AnalysisThe dollar is finishing a corrective pattern. A good trade opportunity will present itself shortly. Stay tuned for updates.

DOLLAR INDEX the US Dollar Index (DXY) is trading around 97.704 -98.572,0.34% . The index has been under pressure due to easing geopolitical tensions ,Particularly optimism about a ceasefire between Israel and Iran and expectations of Federal Reserve rate cuts later in the year. The DXY remains below its 100-day,200 day exponential moving average (EMA), 100day, 200 day simple moving average with bearish momentum supported by interest rate hold and expected rate cut before the end of the year.
the 10 year united states bond yield is trading around 4.279%-4.324%,we have seen gold sell off at 3336-3334 on dollar rally.
Market Outlook:
The DXY is attempting to stabilize but remains in a bearish phase until it decisively breaks above 100 resistance.
the future of the dollar index is depending on Fed policy and global economic conditions.
Summary:
The DXY is currently weak around 97.88 -98.00 due to easing geopolitical risks and Fed rate cut expectations.
Bearish momentum dominates below the 100-day EMA, 200-day EMA, 100-day SMA AND 200 day SMA
A break above 100 would be needed to signal a bullish reversal, if the retest to broken supply at 100 could become demand floor .
#dxy

DXY | daily outlookYALL LIKE THE NEW FACE LIFT??
Price tapped into a refined demand zone after breaking short-term structure, confirming bullish intent. Entry was executed on the mitigation of a prior imbalance, with confluence from BOS (Break of Structure) and trendline liquidity sweep.
Now aiming for the next H1 supply zone where price is likely to react. Bullish continuation expected as long as price holds above 98.080.
TP set just before the high to secure profits before potential distribution.
PLS BOOST & LIKE FOR MORE...

DXY Liquidity Sweep Into POI Before Bullish Expansion 🔍 Key Levels & Zones
Extreme POI: Price is approaching a major demand zone (marked as EXTREME - POI), expecting reaction from this area.
Fair Value Gap (FVG): Price recently filled a small FVG at ~97.75 before pulling back.
Target: Implied move towards 98.95 area after internal liquidity is swept.
Scenario
Price tapped into the FVG and showed reaction — but no shift yet.
Anticipating liquidity sweep of recent lows into the Extreme POI (~97.11).
If bullish reaction confirms from POI, expecting strong move to:
Reclaim FVG
Break above IMB
Reach target zone at 98.95
🧠 Confluences
50 EMA resistance aligning with FVG — short-term sell pressure.
Classic Wyckoff accumulation schematic potential in POI zone.
Liquidity below marked lows for smart money grab.
⚠️ Invalidation
If price breaks and holds below 97.00 with bearish structure, bullish scenario is invalid.
Bias: Short-term bearish, then bullish continuation.

Dollar Index Analysis: Wedge + Powell Outlook – June 25, 2025📉 Technical Outlook: Bearish Rising Wedge + Liquidity Sweep Setup
TVC:DXY The Dollar Index (DXY) is currently trading within a rising wedge pattern, typically a bearish structure. We're anticipating a fake breakdown, potential sweep of the key demand zone, followed by a reversal move targeting key highs.
🔍 Key Technical Zones
📥 Demand Zone (Buy Area):
🔵 97.50 – 97.20 = Institutional accumulation + unfilled orders
🚫 Invalidation Level (Stop-Loss) :
❌ 96.70 = Clean break below confirms full bearish continuation
🎯 Target Projections (Upside Levels) :
TP1: 99.00
TP2: 100.00
TP3: 101.04 (HTF swing high liquidity cleanout)
🧠 Summary Setup :
Downtrend
Rising wedge formation
Sweep of 97.20 possible
Watch for fakeout & reversal play toward 101.04
🏛️ Fundamental Analysis – Powell’s Testimony Insights
Fed Chair Powell highlighted the following during his recent testimony:
🔄 “We’re not there yet on inflation” — Core services remain sticky
🛑 No immediate rate cuts — Growth is slowing but not crashing
🕰 Rate cuts likely postponed to Q4 2025
🔐 “Real rates are restrictive enough” = No more hikes expected
💡 Implication for DXY :
✅ Short-term bullish bias as higher U.S. yields remain attractive if rate cuts are delayed.
🌍 Macro Context Snapshot (as of June 25, 2025)
🇺🇸 US Disinflation: CPI & PCE easing, but not collapsing
🇪🇺 ECB Cut in June: Euro may weaken further
🇯🇵 BOJ Policy Unclear: USD/JPY likely volatile
🌐 Global Risk Appetite High: Volatility may return with geopolitical events
🔥 Watch This: Trade Tariff Narrative Heating Up
🚨 New U.S. Tariff Signals on Chinese tech and EU autos are resurfacing. This could:
Push inflation risk higher
Delay Fed’s easing timeline
Add support to USD short term as markets price in geopolitical tension and uncertainty
📌 Trading Strategy Recap :
Monitor wedge support near 97.20
Look for fakeout/sweep and bullish reversal
Target 99–101 zone on rebound
Stay alert to Powell/Fed rhetoric + tariff news
If you find this analysis helpful, Like, Comment, and Follow for more DXY, gold, and macro trades!

DXYThe DXY (U.S. Dollar Index) measures the strength of the U.S. dollar against a basket of major world currencies — mainly the euro, yen, pound, Canadian dollar, Swedish krona, and Swiss franc.
What it tells you:
• If DXY rises → The dollar is getting stronger overall.
• If DXY falls → The dollar is weakening.
Why DXY matters:
• It reflects global demand for the U.S. dollar.
• It reacts to U.S. interest rate decisions, inflation data, recession fears, geopolitical tensions, etc.
• Traders and investors use it to gauge the dollar’s trend — helping in decisions like shorting EUR/USD, buying gold, or trading commodities.

DXY hello trader, the price of DXY has reached major support level, price will likely reverse after fully liquid sweep on bearish side in daily tf... price could test the 97.7 in 1hr tf, so look for proper reversal in lower tf also, however weekly handle already did liquidity sweep of previous weekly candle. overall the target is 110 for now or could breakout.. price above 200ma will be a good sign of bullish momentum..
good luck to all

Continuation of DXY bullish narrative, who says NO?Like I said in my last published post, dxy is bullish for now till we see otherwise. The first TP has been reached, more than 100 pips bagged, the trade is still on but I'm looking at a possiblity of compounding here. I told you guys, this trade will make you a huge amount of money if you're willing to ride it with me.
This means bearish EURUSD AND GBPUSD et al. Trade accordingly. We may have a final sweep of 97.260 area. You can wait for that sweep before entering. I'm not, I won't be on chart then but the stop will hold. Few pips won't change the trade idea will it?
Follow me as my trades are usually market order, so you'll see them on time and enter on time.
Enjoy

US dollar, Trump has done it!Since the start of 2025, the US dollar has established itself as the weakest major currency on the Forex market, falling by over 11% against a basket of major currencies. If we extend the reference period to include Donald Trump's return to the presidency, the slide even reaches 12%. This spectacular decline is no accident, but the fruit of a strategy deliberately implemented by the Trump administration. The stated aim is clear: to restore the commercial competitiveness of American companies, boost exports and restore the price advantage of products made in the USA. In this respect, the fall of the US dollar on the FX has fulfilled its mission. Can we now envisage a low point for the US dollar on the FX?
1) US dollar: the battle for currency competitiveness has been won for US companies, and this should have a positive impact on the second-quarter results of S&P 500 companies published this July
Indeed, the fall in the dollar translates directly into a much more favorable environment for exporting groups, particularly those which generate the bulk of their sales in Europe or Asia. The conversion of foreign currencies into dollars mechanically boosts revenues and margins. For many multinationals, this factor is likely to contribute to strong earnings releases in the second quarter, as the reporting period takes place this summer. Beyond the immediate impact on corporate accounts, the greenback's depreciation is also encouraging a more structural trend towards reindustrialization and support for domestic production. The effects of this dynamic can already be seen in certain manufacturing segments, which are regaining international market share. Nevertheless, this scenario is not without its downsides: a weak dollar makes imports more expensive, especially raw materials, and weighs on companies dependent on foreign inputs. On the whole, however, the exchange rate policy implemented since January represents a successful gamble by Donald Trump to boost American competitiveness.
2) Technical analysis: can we anticipate a low point for the US dollar?
The crucial question today is whether the US dollar can pull back further, or whether a technical and fundamental bottom is emerging. From a technical analysis point of view, the DXY index, which measures the value of the dollar against a basket of currencies weighted 57% by the euro and 13% by the yen, remains anchored in a bearish trend. Some of the theoretical targets evoked by Elliottist analysis have been reached, but not all. However, long-term supports are visible on monthly charts: an uptrend line, particularly visible on the arithmetic scale, could act as a short-term stabilizer. Note that a potential bullish divergence is also possible on the weekly timeframe. But a bullish reversal pattern is still lacking to speak of a major low point, so let's not put the cart before the horse.
3) Scenarios and stakes for the rest of the year for the US dollar on FX
Beyond technical considerations, the persistent weakness of the US dollar acts as a revealing indicator of the tensions between trade policy and financial stability. On the one hand, a dollar under pressure is a powerful lever for supporting exports and consolidating US growth in an uncertain global context. On the other, a prolonged fall in the greenback fuels concerns about international confidence in dollar-denominated assets, and makes imports more expensive, which could rekindle inflationary pressures. This dilemma lies at the heart of the forthcoming trade-offs between the White House and the Federal Reserve.
For investors and companies exposed to Forex, several scenarios are conceivable. If the U.S. political agenda leads to a trade compromise, and if second-quarter publications confirm the robustness of the U.S. economy, the dollar is likely to find a technical floor around the supports identified on the DXY. In this scenario, a stabilization phase, or even a moderate rebound, could set in during the second half of the year. Conversely, if the trade stimulus policy is accompanied by a hardening of relations with Europe and China, or if the Fed is slow to react, the downward momentum could be prolonged.
DISCLAIMER:
This content is intended for individuals who are familiar with financial markets and instruments and is for information purposes only. The presented idea (including market commentary, market data and observations) is not a work product of any research department of Swissquote or its affiliates. This material is intended to highlight market action and does not constitute investment, legal or tax advice. If you are a retail investor or lack experience in trading complex financial products, it is advisable to seek professional advice from licensed advisor before making any financial decisions.
This content is not intended to manipulate the market or encourage any specific financial behavior.
Swissquote makes no representation or warranty as to the quality, completeness, accuracy, comprehensiveness or non-infringement of such content. The views expressed are those of the consultant and are provided for educational purposes only. Any information provided relating to a product or market should not be construed as recommending an investment strategy or transaction. Past performance is not a guarantee of future results.
Swissquote and its employees and representatives shall in no event be held liable for any damages or losses arising directly or indirectly from decisions made on the basis of this content.
The use of any third-party brands or trademarks is for information only and does not imply endorsement by Swissquote, or that the trademark owner has authorised Swissquote to promote its products or services.
Swissquote is the marketing brand for the activities of Swissquote Bank Ltd (Switzerland) regulated by FINMA, Swissquote Capital Markets Limited regulated by CySEC (Cyprus), Swissquote Bank Europe SA (Luxembourg) regulated by the CSSF, Swissquote Ltd (UK) regulated by the FCA, Swissquote Financial Services (Malta) Ltd regulated by the Malta Financial Services Authority, Swissquote MEA Ltd. (UAE) regulated by the Dubai Financial Services Authority, Swissquote Pte Ltd (Singapore) regulated by the Monetary Authority of Singapore, Swissquote Asia Limited (Hong Kong) licensed by the Hong Kong Securities and Futures Commission (SFC) and Swissquote South Africa (Pty) Ltd supervised by the FSCA.
Products and services of Swissquote are only intended for those permitted to receive them under local law.
All investments carry a degree of risk. The risk of loss in trading or holding financial instruments can be substantial. The value of financial instruments, including but not limited to stocks, bonds, cryptocurrencies, and other assets, can fluctuate both upwards and downwards. There is a significant risk of financial loss when buying, selling, holding, staking, or investing in these instruments. SQBE makes no recommendations regarding any specific investment, transaction, or the use of any particular investment strategy.
CFDs are complex instruments and come with a high risk of losing money rapidly due to leverage. The vast majority of retail client accounts suffer capital losses when trading in CFDs. You should consider whether you understand how CFDs work and whether you can afford to take the high risk of losing your money.
Digital Assets are unregulated in most countries and consumer protection rules may not apply. As highly volatile speculative investments, Digital Assets are not suitable for investors without a high-risk tolerance. Make sure you understand each Digital Asset before you trade.
Cryptocurrencies are not considered legal tender in some jurisdictions and are subject to regulatory uncertainties.
The use of Internet-based systems can involve high risks, including, but not limited to, fraud, cyber-attacks, network and communication failures, as well as identity theft and phishing attacks related to crypto-assets.

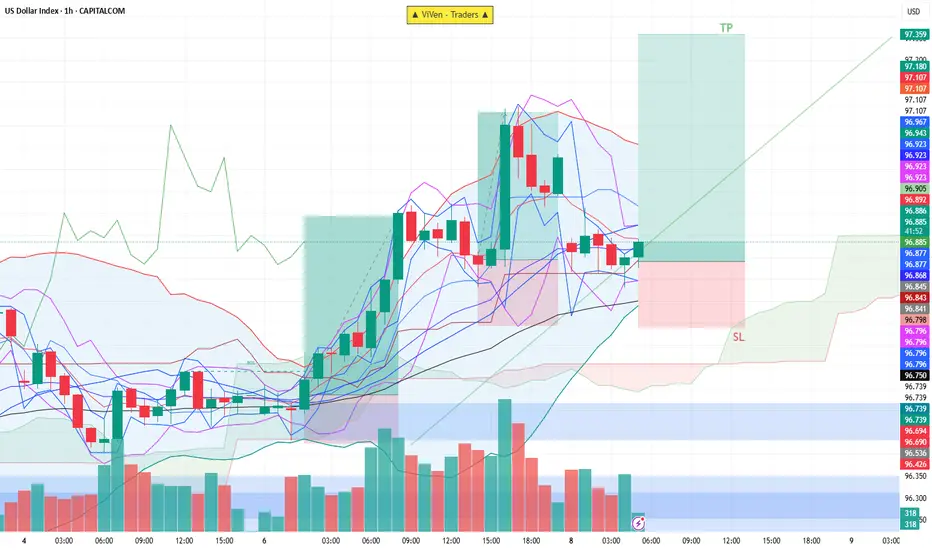
DXY Trade Setup✅ Trade Setup Details:
Entry: 96.850
Stop Loss (SL): 96.650
Take Profit (TP): 97.350
✅ This is a good RRR. A 2.5:1 ratio means you're risking $1 to potentially earn $2.50 — favorable for consistent trading.
📈 Chart & Technical Analysis (based on your image):
✅ Entry is near the middle Bollinger Band and above Ichimoku cloud — a technical support zone.
✅ SL is placed below recent support and Ichimoku base, giving some buffer in case of volatility.
✅ TP at 97.350 aligns with the recent swing high or top of the breakout channel.
⚠️ Things to Watch:
If DXY drops below 96.700, it may signal weakness or a shift in sentiment — watch volume and price reaction.
If price stays above cloud and rising trendline, your trade remains valid.
🟢 Summary:
Bias: Bullish
Setup: Good technical entry with solid support below and clear resistance target.
Risk-to-Reward: Excellent (2.5:1)
Strategy: Hold unless price breaks below 96.650 with volume.
Bullish for DXY, tuesday trading still bullish on dxy, two areas of interest are those two 4hr fvg shown. Thier is also sellside liquidity , whcih we can sweep or we can have a deeper retracement, and touch the second fvg. I am still expecting a bullish dollar for the week, even tho my weekly objective has been met. The US10Y looks really strong and the u.s trasury bonds look week. The only thing is that if you look at the eurusd chart, we have equal highs, so that can be something to watch.

DXY shortPrice had broken our support level and hence i expect i continuous downward movement in price, although price cloud retest the support level that was turn into a resistance level before continuing it bearish move.

DXY 2HOURS BULISH ANALISISThe image shows a screenshot of a computer screen displaying a graph on a trading platform. The graph is titled "U.S. Dollar Index" and has a dark blue background with red and green bars indicating price movements over time.
Decision Zone for DXY This Week: Around 97.600After a significant downward expansion in DXY, we observed a consolidation around last week's low. This week, the market opened with a pullback.
The first stop for this pullback appears to be the current daily fractal high candle and the weekly bearish FVG on the chart. We can assess potential selling pressure from this area on lower timeframes. We'll be monitoring the wicks within this zone, along with any newly forming FVGs.
If the price breaks above this area, our next points of interest will be the gaps within the zone above the 0.5 swing level, and ultimately the swing high itself as the final target.
Given the current setup, we believe there are promising trading opportunities on EURUSD.
Take care until the next update!

DXY TrendlinesUnless it brakes the downtrend with a weekly candle close it should bounce back up in long run. should be closely monitored since it will give us a lot of information about current market direction. i expect bouncing back up but we will see.

BULLISH ON DXYSince I'm bearish on bonds, I am bullish on the DXY.
I would like to see that 4-hour order block hold and DXY attack the buy-side.
However, I’m open to the idea that we could take out the sell-side liquidity first, then move to the buy-side.
Looking at EUR/USD, we do have equal highs, so perhaps EUR/USD takes out the buy-side liquidity before heading lower.

DXY Quite IndecisivePrice on TVC:DXY after having broken below the Swing Low on June 12th @ 97.602 has created a lot of Indecision!
Starting with a 5 Day Long Consolidation period as a Rectangle Pattern
Then after the Bearish Breakout on June 30th due to the Federal Reserve mentioning possibly leaning towards Interest Rate Cuts, we see the TVC:DXY form a Expanding Range
Now at the Swing Low and above all the Consolidation or Indecision, we see a Volume Imbalance in the 97.5 - 97.6 area.
Fundamentally, USD has been mostly beating expectations with:
- Manufacturing and Services PMI's showing Expansion
- Job Openings higher then expected
- Unemployment Claims Low
- Unemployment Rate dropping ( 4.1% )
- Factory Orders Rising
Non-Farm Employment however hurt USD with -33K instead of the 99K forecasted
With all the Tariff uncertainties and how they will affect Inflation continues to worry markets with only a few deals having been ironed out, like the 20% Tariff on Vietnam ( down from 46% ) before the July 9th Deadline.
www.tradingview.com
Now with good Employment News out with numbers showing Strong Job Reports, this eases labor fears and could help remove some of the expectations of the amount of Interest Rate cuts this year.
www.tradingview.com
www.tradingview.com

DXY: Next Move Is Down! Short!
My dear friends,
Today we will analyse DXY together☺️
The market is at an inflection zone and price has now reached an area around 96.362 where previous reversals or breakouts have occurred.And a price reaction that we are seeing on multiple timeframes here could signal the next move down so we can enter on confirmation, and target the next key level of 96.319..Stop-loss is recommended beyond the inflection zone.
❤️Sending you lots of Love and Hugs❤️

A Dollar in Freefall and a Bitcoin on the Brink
In the grand theater of global finance, narratives rarely align with perfect symmetry. The market is a complex ecosystem of competing forces, a cacophony of signals where long-term tectonic shifts can be momentarily drowned out by the piercing alarms of short-term volatility. Today, we stand at the precipice of one of the most profound and fascinating divergences in modern financial history, a story of two assets locked in an inverse dance, each telling a radically different tale about the immediate future.
On one side of this chasm stands the titan of the old world, the U.S. Dollar. The bedrock of global commerce, the world’s undisputed reserve currency for nearly a century, is in a state of unprecedented crisis. The U.S. Dollar Index (DXY), the globally recognized measure of the greenback’s strength against a basket of other major currencies, is in freefall. It is suffering its most catastrophic crash since 1991, and by some measures, is enduring its worst year since the historic turmoil of 1973. This is not a minor correction; it is a fundamental challenge to the dollar’s hegemony, a macro-level event driven by seismic shifts in U.S. economic policy, including aggressive trade tariffs and ballooning government deficits. For the world of alternative assets, a collapsing dollar is the loudest possible bullhorn, a clarion call to seek refuge in stores of value that lie beyond the reach of any single government.
On the other side of the chasm is the digital challenger, Bitcoin. Born from the ashes of the 2008 financial crisis as an answer to the very monetary debasement the dollar is now experiencing, Bitcoin should, by all fundamental logic, be soaring. The dollar’s demise is the very thesis upon which Bitcoin’s value proposition is built. And yet, while the long-term case has never looked stronger, the short-term picture is fraught with peril. A close reading of its technical chart reveals a market showing signs of exhaustion. A key momentum indicator, the stochastic oscillator, is flashing a stark warning, suggesting that the digital asset, far from rocketing to new highs, could be on the verge of a significant drop, a painful correction that could pull its price back below the psychological threshold of $100,000.
This is the great divergence. The macro-economic landscape is screaming for a flight to safety into hard assets like Bitcoin, while the micro-level technicals of Bitcoin itself are suggesting an imminent storm. It is a battle between the long-term fundamental signal and the short-term technical noise, a dilemma that forces every market participant to ask themselves a critical question: In a world where the old rules are breaking down, do you trust the map or the compass?
Chapter 1: The Fall of a Titan - Deconstructing the Dollar's Demise
To understand the magnitude of Bitcoin’s long-term promise, one must first dissect the anatomy of the dollar’s current collapse. The U.S. Dollar Index, or DXY, is not merely a measure of the dollar against a single currency; it is a weighted average of its value relative to a basket of six major world currencies: the Euro, the Japanese Yen, the British Pound, the Canadian Dollar, the Swedish Krona, and the Swiss Franc. Its movement is a reflection of global confidence in the U.S. economy and its stewardship. For this index to suffer its worst crash since 1991 is a historic event. To be on pace for its worst year since 1973 is a paradigm-shifting crisis.
The year 1973 is not a random benchmark. It was the year the Bretton Woods system, which had pegged global currencies to the U.S. dollar (which was in turn pegged to gold), officially died. Its collapse ushered in the modern era of free-floating fiat currencies. For the dollar’s current performance to be compared to that chaotic, system-altering period is to say that the very foundations of the post-1973 monetary order are being shaken.
The catalysts for this historic weakness are rooted in a dramatic shift in American economic policy, largely attributed to the actions of President Donald Trump’s administration. The two primary drivers are a protectionist trade policy and a fiscal policy of burgeoning deficits.
First, the tariffs. The implementation of broad tariffs on imported goods was intended to protect domestic industries and renegotiate trade relationships. However, such measures are a double-edged sword for a nation's currency. They create friction in the intricate web of global supply chains, increase costs for consumers and businesses, and often invite retaliatory tariffs from trading partners. This environment of trade conflict creates economic uncertainty, which can deter foreign investment. When international capital becomes wary of deploying in a country, demand for that country’s currency wanes, putting downward pressure on its value.
Second, and perhaps more fundamentally, are the rising deficits. The U.S. government has been running massive budget deficits, spending far more than it collects in revenue. This debt must be financed. When a country runs a large budget deficit alongside a large current account deficit (importing more than it exports), it becomes heavily reliant on foreign capital to purchase its government bonds. If the world’s appetite for that debt falters, or if the sheer volume of new debt issuance becomes too large to absorb, the nation’s central bank may be implicitly forced to monetize the debt—effectively printing new money to buy the bonds. This expansion of the money supply is the classic recipe for currency debasement.
The combination of trade protectionism and fiscal profligacy has created a perfect storm for the dollar. Global investors, looking at the rising deficits and the unpredictable trade environment, are beginning to question the long-term stability of the dollar as a store of value. This erosion of confidence is what is reflected in the DXY’s historic plunge. A weaker dollar makes U.S. exports cheaper and imports more expensive, but its most profound effect is on the global investment landscape. It forces a worldwide repricing of assets and sends a tidal wave of capital searching for alternatives that can preserve wealth in an era of fiat decay.
Chapter 2: The Digital Phoenix - Bitcoin's Long-Term Bull Case
In the world of finance, every action has an equal and opposite reaction. As the value of the world's primary reserve asset erodes, the value of its antithesis should, in theory, appreciate. Bitcoin is the dollar’s antithesis. Where the dollar’s supply is infinite and subject to the political whims of policymakers, Bitcoin’s supply is finite, transparent, and governed by immutable code. There will only ever be 21 million Bitcoin. This fundamental, mathematically enforced scarcity is the core of its value proposition.
The inverse correlation between the DXY and Bitcoin is one of the most powerful and intuitive relationships in the digital asset space. When the DXY falls, it signifies that the dollar is losing purchasing power relative to other major currencies. For investors around the globe, this means that holding dollars is a losing proposition. They begin to seek out assets that are not denominated in dollars and cannot be debased by the U.S. Federal Reserve. Bitcoin stands as the prime candidate for this capital flight. It is a non-sovereign, globally accessible, digital store of value that operates outside the traditional financial system. A falling dollar is therefore the strongest possible tailwind for Bitcoin, validating its very reason for existence.
This relationship transcends simple price mechanics; it is a philosophical and macroeconomic hedge. Owning Bitcoin is a bet against the long-term viability of the current debt-based fiat monetary system. The dollar’s crash, driven by deficits and monetary expansion, is not a flaw in the system; it is a feature of it. Bitcoin offers an escape hatch. It is a lifeboat for investors who see the iceberg of sovereign debt on the horizon.
This narrative is what has fueled the wave of institutional adoption that has defined the current market cycle. Sophisticated investors and corporations are not allocating to Bitcoin because they are speculating on short-term price movements. They are buying it as a long-term strategic reserve asset, a hedge against the very macroeconomic turmoil that the dollar’s crash represents. They see a world drowning in debt and a global reserve currency being actively devalued, and they are making a calculated, multi-generational bet on a system of verifiable digital scarcity. From this perspective, the long-term bull case for Bitcoin has never been clearer or more compelling. The dollar’s historic weakness is the ultimate validation of the Bitcoin thesis.
Chapter 3: The Ghost in the Machine - Bitcoin's Short-Term Technical Warning
If the story ended with the macro-economic picture, the path forward would be simple. But markets are not simple. They are a reflection of human psychology, a tapestry of fear and greed woven in real-time. While the fundamental, long-term story points resolutely upward, the short-term evidence, as read through the language of technical analysis, is painting a much darker picture.
Technical analysis operates on the principle that all known information, including the bullish macro fundamentals, is already reflected in an asset's price. It seeks to identify patterns and gauge market momentum to predict future movements. One of the most trusted tools for measuring momentum is the stochastic oscillator. It does not measure price or volume itself, but rather the speed and momentum of price changes. Think of it like a car's tachometer: it tells you not how fast you are going, but how hard the engine is working to maintain that speed.
The stochastic oscillator operates on a scale of 0 to 100. A reading above 80 is considered "overbought," suggesting the asset has moved up too quickly and the rally may be running out of steam. A reading below 20 is considered "oversold," suggesting a decline may be exhausted. The current technical analysis of Bitcoin’s chart reveals a deeply concerning signal from this indicator.
Despite the overwhelmingly bullish news of the dollar’s collapse, Bitcoin’s price momentum is reportedly waning. The stochastic oscillator is likely showing what is known as a "bearish divergence." This occurs when the price of an asset pushes to a new high, but the oscillator fails to do so, creating a lower high. This is a classic warning sign. It’s the market’s equivalent of a car’s engine sputtering and revving less intensely even as the driver pushes the accelerator to the floor. It suggests that the underlying buying pressure is weakening, that the rally is becoming exhausted, and that a reversal or significant correction may be imminent.
The technical forecast of a potential drop below the $100,000 level stems directly from this type of signal. It implies that the recent price strength is not supported by genuine momentum and that the market is vulnerable. Why would this happen when the fundamental news is so positive? There are several possibilities. Short-term traders who bought at lower prices may be taking profits. The market may be flushing out over-leveraged long positions, triggering a cascade of liquidations. Or, it could simply be the natural rhythm of a market. No asset moves up in a straight line. Even the most powerful bull trends require periods of consolidation and correction to shake out weak hands, build a stronger base of support, and gather energy for the next major advance. A pullback to below $100,000, while painful for those who bought at the top, could be a perfectly healthy and necessary event in the context of a much larger, multi-year bull market.
Chapter 4: Reconciling the Irreconcilable - The Investor's Dilemma
This great divergence presents every market participant with a profound dilemma, forcing a clear-eyed assessment of their own investment philosophy and time horizon. The market is speaking in two different languages simultaneously, and the message you hear depends on the language you choose to listen to.
For the long-term investor, the individual or institution with a five, ten, or twenty-year outlook, the story is clear. The historic crash of the U.S. dollar is the signal. It is the fundamental, world-altering event that confirms their thesis. The debasement of the world’s reserve currency is a generational opportunity to allocate capital to a superior, non-sovereign store of value. From this vantage point, the bearish reading on a short-term stochastic oscillator is, at best, irrelevant noise. It is the momentary turbulence felt on a flight destined for a much higher altitude. The strategy for this investor is one of conviction. They may choose to ignore the short-term dip entirely, or more likely, view it as a gift—a final opportunity to accumulate more of a scarce asset at a discount before the full force of the dollar’s crisis is felt in the market. Their actions are guided by the macro map, not the short-term compass.
For the short-term trader, the world looks entirely different. Their time horizon is measured in days, weeks, or months, not years. For them, the bearish divergence on the stochastic oscillator is the signal. The macro story of the dollar’s decline is merely the background context. Their primary concern is managing risk and capitalizing on immediate price swings. A warning of a potential drop below $100,000 is an actionable piece of intelligence. It might prompt them to take profits on existing long positions, hedge their portfolio with derivatives, or even initiate a short position to profit from the anticipated decline. Their survival depends on their ability to react to the compass of market momentum, regardless of the map’s ultimate destination.
The most sophisticated market participants, however, attempt to synthesize these two perspectives. They recognize that the long-term macro trend provides the overarching directional bias, while the short-term technicals provide the tactical roadmap for navigating that trend. Such an investor would maintain a core long position in Bitcoin, acknowledging the powerful tailwind of the dollar’s collapse. However, they would use the technical signals to actively manage their position and optimize their entries and exits. They might trim their position when the stochastic indicator signals overbought conditions, taking some profit off the table to reduce risk. They would then stand ready to redeploy that capital and add to their core holding when the technicals signal oversold conditions after the very correction they anticipated. This approach allows them to maintain their long-term conviction while respecting the short-term risks, blending the art of the trader with the discipline of the investor.
Conclusion: The Signal and the Noise
The financial markets are standing at a historic crossroads. The U.S. dollar, the sun around which the global monetary system has orbited for generations, is dimming. Its historic crash is a signal of the highest order, a fundamental warning that the era of unchallenged fiat dominance is facing its most serious test. This decay is creating a powerful gravitational pull toward assets defined by scarcity and sovereignty, with Bitcoin as the undisputed digital leader. This is the signal.
Simultaneously, the internal mechanics of the Bitcoin market are showing signs of short-term fatigue. The warnings from technical indicators like the stochastic oscillator are a reminder that no market is immune to the laws of gravity, that periods of profit-taking and consolidation are a natural and healthy part of any long-term advance. This is the noise.
The great challenge, and the great opportunity, for every investor today is to learn to distinguish between the two. The collapse of the dollar is a paradigm shift, while the potential drop in Bitcoin’s price is a cyclical correction. The former defines the destination; the latter describes the terrain along the way. The current divergence is a test of thesis, of timeframe, and of temperament. Those who are shaken out by the short-term noise will likely miss the long-term signal. But those who understand that the dollar’s fall is the very reason for Bitcoin’s rise, and who have the conviction to see the short-term turbulence for what it is, will be best positioned to navigate this great divergence and witness the dawn of a new financial landscape.
