DXY Weekly ForecastDXY Weekly Forecast
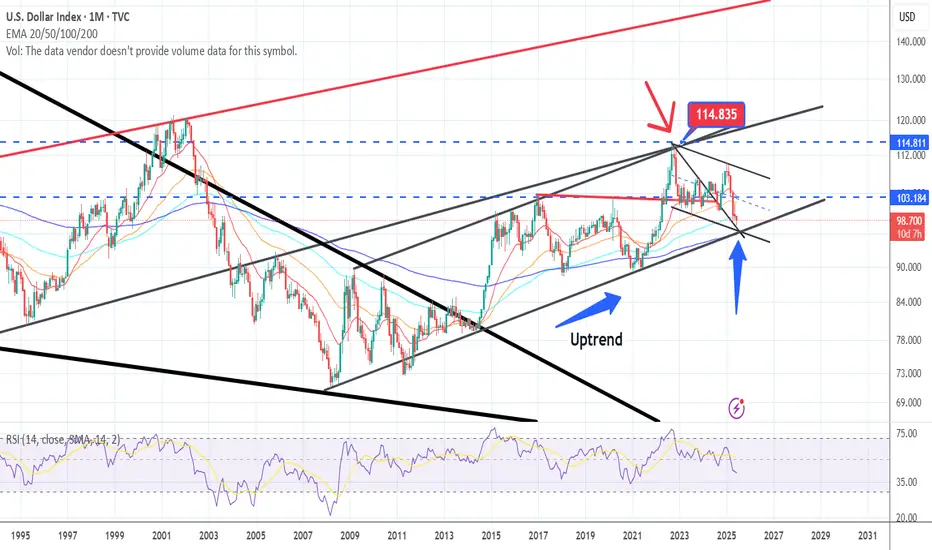
- DXY expect to be strong due to fundamental factors
- bigger structure needed before DXY to come down to 96.000 level
- look for up move this week
A Message To Traders:
I’ll be sharing high-quality trade setups for a period time. No bullshit, no fluff, no complicated nonsense — just real, actionable forecast the algorithm is executing. If you’re struggling with trading and desperate for better results, follow my posts closely.
Check out my previously posted setups and forecasts — you’ll be amazed by the high accuracy of the results.
"I Found the Code. I Trust the Algo. Believe Me, That’s It."
USDX trade ideas

DOLLAR INDEXThe relationship between the US Dollar Index (DXY) and the 10-year US Treasury yield is generally positive but has shown signs of weakening and occasional breakdowns recently.
Key Points:
Typical Positive Correlation:
Historically, when the 10-year Treasury yield rises, the dollar tends to strengthen, and when yields fall, the dollar weakens. This is because higher yields attract foreign capital seeking better returns, increasing demand for the dollar. Conversely, lower yields reduce dollar appeal.
Mechanism:
The 10-year yield reflects investor expectations about inflation, economic growth, and Federal Reserve policy. Higher yields often signal stronger growth or inflation, supporting a stronger dollar due to higher real returns on US assets.
Recent Weakening of Correlation:
Since early 2025, this positive correlation has weakened significantly. Despite rising 10-year yields (around 4.4% to 4.5%), the DXY has hovered near the 98–99 range and even declined over 10% year-to-date. This divergence is attributed to:
Investors re-evaluating the dollar’s reserve currency status and shifting capital to other markets (e.g., European equities).
Outflows from US assets amid geopolitical and economic uncertainty.
Asynchronous monetary policy cycles globally, with some central banks hiking or cutting rates at different paces than the Fed.
Market Sentiment and Safe-Haven Flows:
In times of stress, the dollar’s traditional role as a safe haven can be challenged, further complicating the yield-dollar relationship.
Conclusion
While the 10-year Treasury yield and the US dollar index usually move together, recent market dynamics have disrupted this pattern. Rising yields have not translated into a stronger dollar in 2025, reflecting broader shifts in investor sentiment, geopolitical risks, and global monetary policy divergence.

Dollar - Slightly Bullish Short Term but overall bearishDollar
Just expressing my feel on the dollar for the coming week

DxyWe are currently at the support zone so we have to wait and see what will happen and also consider the coming days candlestick

Price action DXY I failed to make a new lower currently bullish yet what it needs is a new low higher to complete the structure the we can start looking for longs

DXY Short Term longAt least that's why the tea leaves say TVC:DXY
RSI positive divergence
Fib support

DXY (bearish?)The herd is completely bearish on the dxy, but the chart is showing something else.
The herd is an amazing indicator
What do we see:
-Still in an uptrend
-the 200 ema (blue line)
-A resistance trendline becoming a support trendline?
-A bull flag, so the under part of the flag
So crossing of those 3 trendlines and the 200 ema is telling me that probably this chart is bullish.
DXYThe DXY shows strong bullish COT sentiment, with traders reducing shorts and increasing longs. It’s currently sitting on a key support level, suggesting a possible bounce.
Watch for bullish price action confirming the move.
Entry: On support hold and reversal signal.

DXY
The net long position by large speculators shows a clear bullish sentiment toward DXY. A +785 increase reflects growing confidence in the dollar, reinforcing that positive outlook continues. Overall Bias: Bullish — speculators remain positive on USD strength.

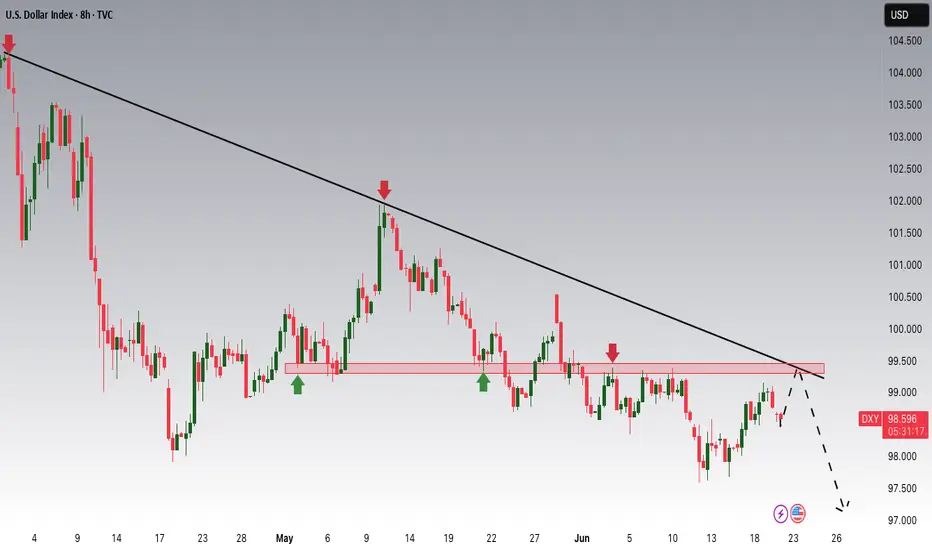
DXY Potential DownsidesHey Traders, in today's trading session we are monitoring DXY for a selling opportunity around 99.300 zone, DXY is trading in a downtrend and currently is in a correction phase in which it is approaching the trend at 99.300 support and resistance area.
Trade safe, Joe.
DXY Eyes Key Long-Term Support from 2008The U.S. Dollar Index (DXY) is currently trading near three-year lows, reflecting concerns over economic fragility and heightened geopolitical tensions.
If price action holds below 97, the DXY could face additional pressure, potentially descending toward the lower boundary of a long-term channel that has held since the 2008 lows. Key support levels at 96 and 94 may offer potential rebound zones.
Monthly RSI reflects more downside potential towards oversold conditions last seen in 2021. To reverse the current bearish momentum, the index would need to regain and hold above the 100-mark, which could shift sentiment back toward a bullish rebound outlook against the markets.
- Razan Hilal, CMT

DXY; MARKETS JITTERS AND UNCERTAINTIES.The DXY did not hold a successful break above 99.000 which was our bullish signal. Furthermore, we had US banks closed for yesterday's NY session which did not do us any good as there was minimal movements in our charts. Without volatility there is little room for profit chasing as much as our USDJPY signal was on point.
Today's session started with a gap lower towards 98.50. I don't expect a mover lower before filling the gap so that will be our first objective before any further movement. My bias still remains the same ,a clean break and hold above 99.00 will signal a healthier dollar for the short term despite the war tensions.

DXY US DOLLAR INDEXAs we can see on the chart, there’s a clear pattern emerging. The current movement of the index closely resembles the price action we saw between April 2015 and August 2018.
Assuming this fractal continues to play out, we could see more sideways movement until the end of the year — before a potential trend reversal kicks in.

Bullish bounce?US Dollar Index (DXY) is falling towards the pivot and could bounce to the 1st resistance.
Pivot: 98.48
1st Support: 97.62
1st Resistance: 99.47
Risk Warning:
Trading Forex and CFDs carries a high level of risk to your capital and you should only trade with money you can afford to lose. Trading Forex and CFDs may not be suitable for all investors, so please ensure that you fully understand the risks involved and seek independent advice if necessary.
Disclaimer:
The above opinions given constitute general market commentary, and do not constitute the opinion or advice of IC Markets or any form of personal or investment advice.
Any opinions, news, research, analyses, prices, other information, or links to third-party sites contained on this website are provided on an "as-is" basis, are intended only to be informative, is not an advice nor a recommendation, nor research, or a record of our trading prices, or an offer of, or solicitation for a transaction in any financial instrument and thus should not be treated as such. The information provided does not involve any specific investment objectives, financial situation and needs of any specific person who may receive it. Please be aware, that past performance is not a reliable indicator of future performance and/or results. Past Performance or Forward-looking scenarios based upon the reasonable beliefs of the third-party provider are not a guarantee of future performance. Actual results may differ materially from those anticipated in forward-looking or past performance statements. IC Markets makes no representation or warranty and assumes no liability as to the accuracy or completeness of the information provided, nor any loss arising from any investment based on a recommendation, forecast or any information supplied by any third-party.

DXY direction.With the news in great favour of DXY, PA also shows multiple rejection at the support zone (clearly oversold already).
Focus on EURUSD and GBPUSD for a long time sell.

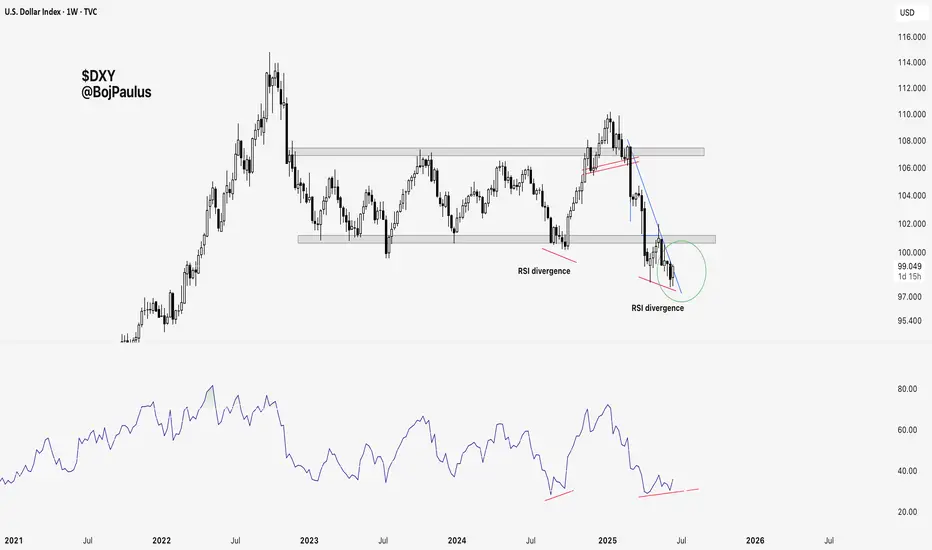
Dollar Index Analysis: Compression, Divergence, Breakout?Greetings to the TradingView community, here's a detailed look at DXY where technical structure and macro context may be hinting at a shift.
Dollar Index (DXY) Approaching Key Breakout | Bullish Divergence and Macro Shifts in Focus
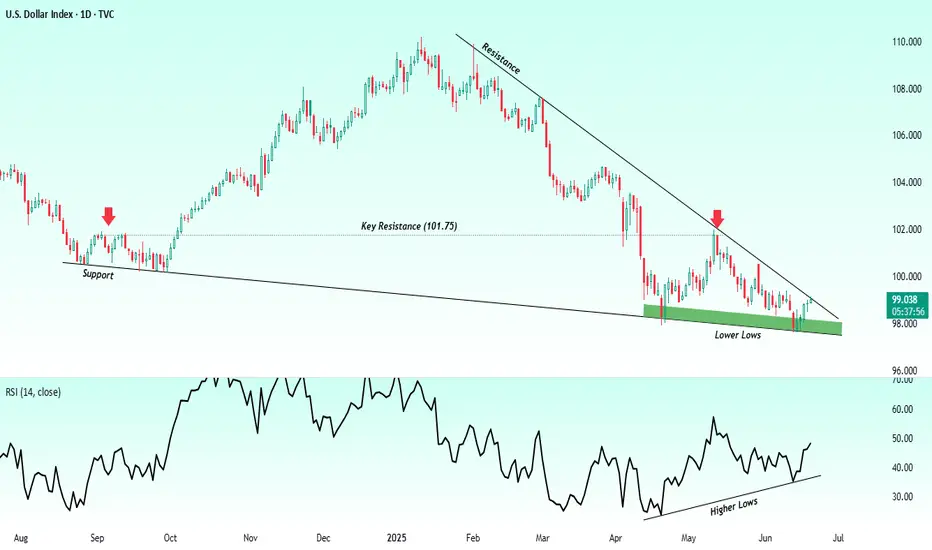
The U.S. Dollar Index (DXY) is currently approaching a structurally important juncture where technical compression is intersecting with potential macroeconomic shifts. Over the past several months, DXY has remained in a well defined downtrend, consistently printing lower highs and lower lows. However, the recent price action reveals signs of exhaustion in bearish momentum, opening the door for a potential trend reversal or a meaningful corrective rally.
Technically the index has been trading within a broad descending wedge pattern since late 2024. This structure, often interpreted as a bullish reversal formation, is now nearing its apex. Price has been hugging the upper boundary of the pattern a descending trendline that has acted as dynamic resistance and appears to be preparing for a possible breakout. Each subsequent test of this trendline has occurred with less momentum on the downside, a common precursor to a breakout when price compresses tightly within narrowing ranges.
More importantly, momentum indicators are beginning to diverge from price. The Relative Strength Index (RSI 14), for instance, is forming a series of higher lows while price continues to record lower lows. This bullish divergence is a classic signal that downside pressure is weakening and that buyers may be gradually absorbing supply. Divergence of this nature, especially in confluence with trendline resistance, often leads to a shift in price behavior.
A key horizontal level to monitor remains 101.75, which has historically acted as a strong resistance zone. This level marked the previous breakout rejection and coincides with the mid-range structure of the wedge. A sustained close above this zone would effectively break the prevailing lower-high formation and could signal a shift in market structure toward a more neutral or even bullish bias.
In terms of projected targets, if a breakout confirms, the logical areas to watch would be the previous swing highs from the downtrend. These include levels in the 102.50 to 104.00 range, where the market has previously paused or reversed. These prior lower highs may now act as resistance on the way up and can be used as checkpoints to gauge the strength of any bullish follow-through.
From a macroeconomic perspective, several factors could support or accelerate such a breakout. Recent U.S. inflation data has shown signs of softening, with both Consumer Price Index (CPI) and Producer Price Index (PPI) prints coming in below expectations. This has increased market speculation that the Federal Reserve may pivot toward a more accommodative stance later in the year. Although the Fed has not confirmed any immediate easing, market expectations around rate cuts are beginning to influence bond yields and, by extension, the dollar.
However, it’s also worth noting that monetary policy divergence among global central banks remains an important theme. While the Fed may lean toward caution, the European Central Bank and the Bank of England are facing their own unique inflationary challenges, which could either reinforce or limit relative dollar weakness. In such an environment, if other central banks appear more dovish than the Fed, it could provide relative strength to the dollar index.
Geopolitical uncertainty and equity market volatility are also important to consider. The dollar has historically acted as a safe-haven asset in times of global distress. If geopolitical tensions escalate or global risk sentiment weakens, capital flows into the dollar may accelerate regardless of interest rate trajectories.
In conclusion, the current DXY setup is a technically rich and macro-sensitive zone where price compression, bullish RSI divergence, and policy shifts are aligning. While confirmation is still needed, particularly via a breakout above the descending trendline and the 101.75 level, the probability of a structural shift is increasing. This setup is not a trading recommendation but rather an important chart to watch for clues about future dollar direction and its cascading impact on global FX pairs, commodities, and broader market sentiment.
Thanks for reading hope you like this publication.
Regards- Amit.
$DXY - First signs of recovery, but no confirmation yet.To find confirmation, I would like to see a clean break of the blue Line on 1d or 3d chart and a bullish MacD cross.`
US dollar, a potential bullish divergence to watchThe US Federal Reserve (FED) recently updated its economic projections against a backdrop of growing uncertainty. It is now openly concerned about a scenario of stagflation, a combination of weak growth, persistent inflation and rising unemployment. This concern stems in particular from the as yet unquantified impact of the new tariffs imposed by the Trump administration, as well as rising geopolitical tensions, particularly in the Middle East.
Gloomy forecasts, but monetary policy still flexible
At its last meeting, the FED kept its key rate in the 4.25% - 4.5% range, while publishing gloomy forecasts for the US economy. By the end of 2025, it anticipates PCE inflation at around 3%, unemployment at 4.5% and moderate growth. Despite this worrying picture, the central bank is still planning two rate cuts this year, demonstrating its determination to support economic activity.
Nevertheless, this monetary stance is the subject of debate within the committee: ten members support the cuts, while seven believe that rates should remain unchanged. Jerome Powell, Chairman of the FED, advocates caution, insisting on the need to observe the evolution of economic data before acting, particularly in view of the delayed effects of tariffs.
The FED is faced with a dilemma: it must curb inflation without destroying growth. Its diagnosis of stagflation is harsh, but perhaps too pessimistic if inflation figures remain under control. A rate cut in September is still conceivable, but will largely depend on the evolution of geopolitical tensions and international trade in the weeks ahead.
Below, you can see the table with the latest update of the FED's macroeconomic projections
US dollar (DXY), a potential bullish technical divergence to be monitored
The FED's confirmed intransigence is having an impact on the foreign exchange market. While the US dollar has been the weakest Forex currency since the beginning of the year, it has been stabilizing for several weeks now. If the FED maintains its current wait-and-see stance on a resumption of Fed funds rate cuts, the US dollar could be close to a low point on the Forex market.
At present, there are no resistance breaches to suggest this, but a potential bullish technical divergence has appeared on the weekly timeframe. In the past, this signal was a precursor to a future rebound in the US dollar against a basket of major Forex currencies.
DISCLAIMER:
This content is intended for individuals who are familiar with financial markets and instruments and is for information purposes only. The presented idea (including market commentary, market data and observations) is not a work product of any research department of Swissquote or its affiliates. This material is intended to highlight market action and does not constitute investment, legal or tax advice. If you are a retail investor or lack experience in trading complex financial products, it is advisable to seek professional advice from licensed advisor before making any financial decisions.
This content is not intended to manipulate the market or encourage any specific financial behavior.
Swissquote makes no representation or warranty as to the quality, completeness, accuracy, comprehensiveness or non-infringement of such content. The views expressed are those of the consultant and are provided for educational purposes only. Any information provided relating to a product or market should not be construed as recommending an investment strategy or transaction. Past performance is not a guarantee of future results.
Swissquote and its employees and representatives shall in no event be held liable for any damages or losses arising directly or indirectly from decisions made on the basis of this content.
The use of any third-party brands or trademarks is for information only and does not imply endorsement by Swissquote, or that the trademark owner has authorised Swissquote to promote its products or services.
Swissquote is the marketing brand for the activities of Swissquote Bank Ltd (Switzerland) regulated by FINMA, Swissquote Capital Markets Limited regulated by CySEC (Cyprus), Swissquote Bank Europe SA (Luxembourg) regulated by the CSSF, Swissquote Ltd (UK) regulated by the FCA, Swissquote Financial Services (Malta) Ltd regulated by the Malta Financial Services Authority, Swissquote MEA Ltd. (UAE) regulated by the Dubai Financial Services Authority, Swissquote Pte Ltd (Singapore) regulated by the Monetary Authority of Singapore, Swissquote Asia Limited (Hong Kong) licensed by the Hong Kong Securities and Futures Commission (SFC) and Swissquote South Africa (Pty) Ltd supervised by the FSCA.
Products and services of Swissquote are only intended for those permitted to receive them under local law.
All investments carry a degree of risk. The risk of loss in trading or holding financial instruments can be substantial. The value of financial instruments, including but not limited to stocks, bonds, cryptocurrencies, and other assets, can fluctuate both upwards and downwards. There is a significant risk of financial loss when buying, selling, holding, staking, or investing in these instruments. SQBE makes no recommendations regarding any specific investment, transaction, or the use of any particular investment strategy.
CFDs are complex instruments and come with a high risk of losing money rapidly due to leverage. The vast majority of retail client accounts suffer capital losses when trading in CFDs. You should consider whether you understand how CFDs work and whether you can afford to take the high risk of losing your money.
Digital Assets are unregulated in most countries and consumer protection rules may not apply. As highly volatile speculative investments, Digital Assets are not suitable for investors without a high-risk tolerance. Make sure you understand each Digital Asset before you trade.
Cryptocurrencies are not considered legal tender in some jurisdictions and are subject to regulatory uncertainties.
The use of Internet-based systems can involve high risks, including, but not limited to, fraud, cyber-attacks, network and communication failures, as well as identity theft and phishing attacks related to crypto-assets.


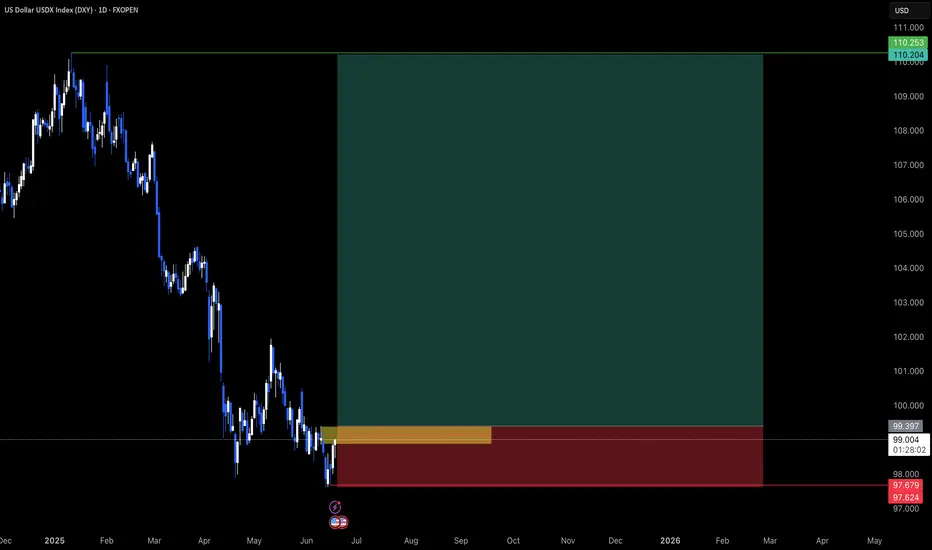
DXY OUTLOOK - SWING SETUPThe dollar has been on a six-month decline, but I anticipate a recovery. This is primarily due to the current economic climate, geopolitical landscape, and the dollar's traditional role as a safe-haven currency during periods of significant uncertainty
"May fortune attend thee, and thy trade prosper." .......L2Earned
Politics is a show. Live watching the Federal Reserve Chair Jerome Powell News Conference
(FOMC Conference)
and at the same time,
Dollar just swept liquidity,
Hit EQ,
Filled 1hrFV Array,
Sent to buyside.
This is crazy.
Its all a game. Its not real.

Bullish bounce?US Dollar Index (DXY) is reacting off the pivot and could rise to the 1st resistance.
Pivot: 98.48
1st Support: 98.09
1st Resistance: 99.25
Risk Warning:
Trading Forex and CFDs carries a high level of risk to your capital and you should only trade with money you can afford to lose. Trading Forex and CFDs may not be suitable for all investors, so please ensure that you fully understand the risks involved and seek independent advice if necessary.
Disclaimer:
The above opinions given constitute general market commentary, and do not constitute the opinion or advice of IC Markets or any form of personal or investment advice.
Any opinions, news, research, analyses, prices, other information, or links to third-party sites contained on this website are provided on an "as-is" basis, are intended only to be informative, is not an advice nor a recommendation, nor research, or a record of our trading prices, or an offer of, or solicitation for a transaction in any financial instrument and thus should not be treated as such. The information provided does not involve any specific investment objectives, financial situation and needs of any specific person who may receive it. Please be aware, that past performance is not a reliable indicator of future performance and/or results. Past Performance or Forward-looking scenarios based upon the reasonable beliefs of the third-party provider are not a guarantee of future performance. Actual results may differ materially from those anticipated in forward-looking or past performance statements. IC Markets makes no representation or warranty and assumes no liability as to the accuracy or completeness of the information provided, nor any loss arising from any investment based on a recommendation, forecast or any information supplied by any third-party.
