Volatility is coming...While VIX (Volatility Index) is bouncing W pattern, it will cause more blood bath on markets ( #cryptocurrencies #stocks #commodities etc) in mid term.
Be careful bulls, you have been warned.
NOT FINANCIAL ADVICE.
VIX trade ideas

Vix 500 is bearish Vix 500 is on the the bearish after it broke the support level on the 1HR timeframe.

VIX Will Go Higher! Long!
Please, check our technical outlook for VIX.
Time Frame: 1h
Current Trend: Bullish
Sentiment: Oversold (based on 7-period RSI)
Forecast: Bullish
The market is trading around a solid horizontal structure 12.81.
The above observations make me that the market will inevitably achieve 13.44 level.
P.S
Overbought describes a period of time where there has been a significant and consistent upward move in price over a period of time without much pullback.
Like and subscribe and comment my ideas if you enjoy them!

VIX: Bullish Bat with PPO Arrow and MACD Bullish DivergenceThe VIX has formed a Bullish Bat and is currently trading at the HOP level with PPO Confirmation and MACD Bullish Divergence. If it plays out, I think the VIX could at least see $15 again.

✅VIX RISKY LONG🚀
✅VIX is going down to retest a horizontal support of 12.8$
Which makes me locally bullish biased
And I think that we will see a rebound
And a move up from the level
Towards the target above at 13.5$
LONG🚀
✅Like and subscribe to never miss a new idea!✅

VIX - below 12,72; SPX - another rally Very interesting picture I can see right now.
#VIX is dumping, VVIX also, but Put/Call ratio is about to pump on Monthly TF.
Either SPX will make the last pump UP and then will dump until 4280$ or SPX will continue pumping as did AAPL and NVDIA these months.

$VIX heading lower again. What if it breaks support?TVC:VIX seems to be heading lower and looks as if it wants to touch the recent support level.
Weekly #VIX is showing some RSI positive divergence.
We've been bullish since Sept 2022. However, we recently turned NEUTRAL.
However, we need to be open and focus on trends and momentum and not hysteria. If the VIX breaks the yellow line, then chances are #stocks are going higher again.
Interesting, no?

The VIX: A Measure of Market FearThe VIX, or Volatility Index, is a measure of the expected volatility of the S&P 500 index over the next 30 days. It is calculated using the prices of options on the S&P 500 index. A higher VIX indicates that market participants are expecting more volatility in the future, while a lower VIX indicates that they are expecting less volatility.
The VIX is an important tool for investors because it can help them understand how risky the stock market is. A high VIX indicates that the market is expected to be volatile, which means that there is a greater chance of large price swings. This can make investing more risky, but it can also create opportunities for profit.
The VIX is also correlated with the S&P 500 index. This means that the VIX tends to move in the opposite direction of the S&P 500. When the S&P 500 falls, the VIX tends to rise, and when the S&P 500 rises, the VIX tends to fall. This correlation is not perfect, but it is strong enough to be useful for investors.
The VIX can be used in a variety of ways by investors. Some investors use the VIX to assess the risk of their portfolios. Others use the VIX to trade volatility, either by buying or selling VIX futures contracts. Still others use the VIX to hedge against risk in other assets.
The VIX is a complex and volatile asset, but it can be a valuable tool for investors who understand how to use it.
Here are some additional things to keep in mind about the VIX:
The VIX is not a direct measure of the volatility of the stock market. It is a measure of the expected volatility, which means that it is based on the opinions of market participants.
The VIX can be affected by a variety of factors, including economic news, political events, and natural disasters.
The VIX is not always accurate. It can sometimes overshoot or undershoot the actual volatility of the stock market.
Despite its limitations, the VIX is a valuable tool for investors. It can help investors understand the risk of the stock market and make informed investment decisions.
I hope this post is helpful.
This analysis represents my thoughts at the date it is posted.
This analysis does not represent professional and/or financial advice.
You alone assume the sole responsibility of evaluating the merits and risks associated with the use of any information or other content found on this profile before making any decisions based on such information.

Vix spike what’s going to be the catalyst?Bullish falling wedges and inverse head and shoulders patterns seen. Is it another round of bank failures, an escalation of geopolitical uncertainty, or another black swan event incoming?

Opening gap not retraced yetOne thing we would like to point out is yesterday's opening gap in the Volatility S&P 500 Index. A failure of the price to fill the gap risks rekindling the volatility in the short-term future. As such, it is something we are paying attention to.
Please feel free to express your ideas and thoughts in the comment section.
DISCLAIMER: This analysis is not intended to encourage any buying or selling of any particular securities. Furthermore, it should not be a basis for taking any trade action by an individual investor. Therefore, your own due diligence is highly advised before entering a trade.

CBOE ready for Big UP moveFor all trade on my Auto Harmonic patterns indicator trade setup -
Risky trades can take trade after crossing 23.6% on either side and safe traders can take trade after 41% We can start buying when our Trailing SL hit at 23.6% with SL of recent low our Target will be 41%, 78.6% , 127.2% 161.8% and 223.6 % , when reversal pattern appears on chart we have to trail our SL if trailing SL hit exit from long trade and initiate sell trade ,


The VIX could spike higher, as its MA bounced on RSIIve been following a theory about how a bounce on the moving average on the RSI can indicate movements.
This is a quick look on the weekly.
There is turmoil in the markets, and the stock markets look ready for a steep correction.
The VIX has bounced hard on the RSI MA, so im expecting volatility

The crash of fear
Almost surprised that the VIX is only at 14 with the Chinese and European PMIs + the surge in oil (which causes a new recovery in rates...)
^^

✅VIX POTENTIAL LONG🚀
✅VIX fell again to retest the support of 12.78
But it is a strong key level
So I think that there is a high chance
We will see a bullish rebound and a move up
LONG🚀
✅Like and subscribe to never miss a new idea!✅

VIX VS US100/US30VIX testing the lowest support , the respond of the index should be inapposite , we keep close eyes on strong rejection this will lead a good drop for SP500 .
what is your thoughts on it ?
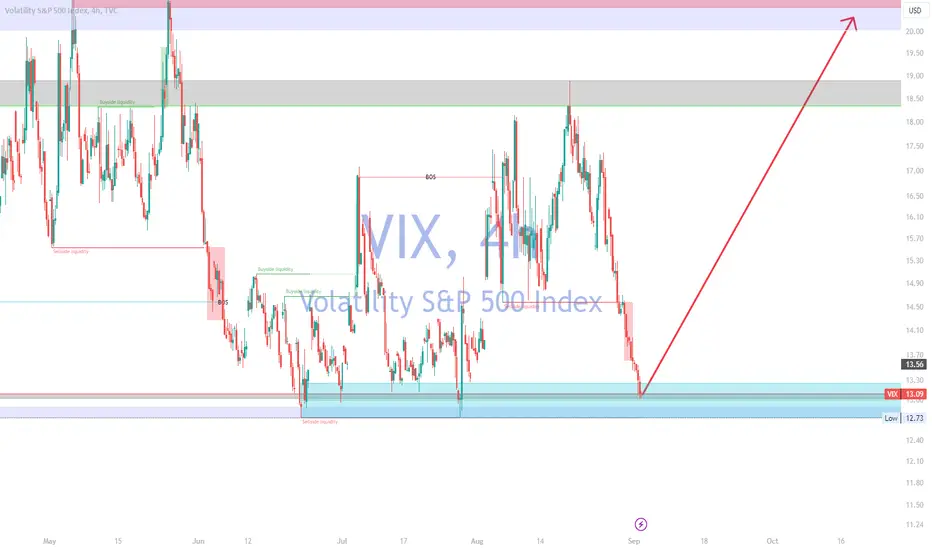
VIX Will Move Higher! Long!
Please, check our technical outlook for VIX.
Time Frame: 9h
Current Trend: Bullish
Sentiment: Oversold (based on 7-period RSI)
Forecast: Bullish
The market is approaching a significant support area 13.09.
The underlined horizontal cluster clearly indicates a highly probable bullish movement with target 15.72 level.
P.S
Please, note that an oversold/overbought condition can last for a long time, and therefore being oversold/overbought doesn't mean a price rally will come soon, or at all.
Like and subscribe and comment my ideas if you enjoy them!

VIX Long From Support! Buy!
Hello,Traders!
VIX has been falling
For quite some time now
And the index is about to
Retest the horizontal support
Level of 12.8 from where
A local rebound is to be expected
Sell!
Like, comment and subscribe to help us grow!
Check out other forecasts below too!

VIX Long EntryAt daily support, will probably continue lower and touch the bottom of this channel. Should provide a decent long entry.
please use a stoploss,
thanks.

VixOversold here and outside it Bbands. 1-4 hour CCI is telling me a bounce is coming in the next 2 sessions. Looking for a bounce off 13.00- 13.30, Target 50sma or 14.73.
Trend only reverses if we close back over 50sma, for now this would be a technical bounce ..

Volatility getting crushed after indicator alert once againVolatility getting crushed after indicator alert once again
TVC:VIX $VX

VIX TO REPEAT 2016-STYLE CALMNESS THROUGH 2023History does not repeat but ryhmes.
The example below is VIX today vs VIX 2016.
See any similarity? We believe equities will go higher!
-Signalwyse Team

Long VIXI know many do not like to do any TA on VIX. This is just my observation. Its getting tight and we should see a big move ether up or down. Considering the current macro environment ...you guess it right!!
Anyway, if you look at the chart, VIX has been steadily going higher since 2018.
