Here lies Vix ☠
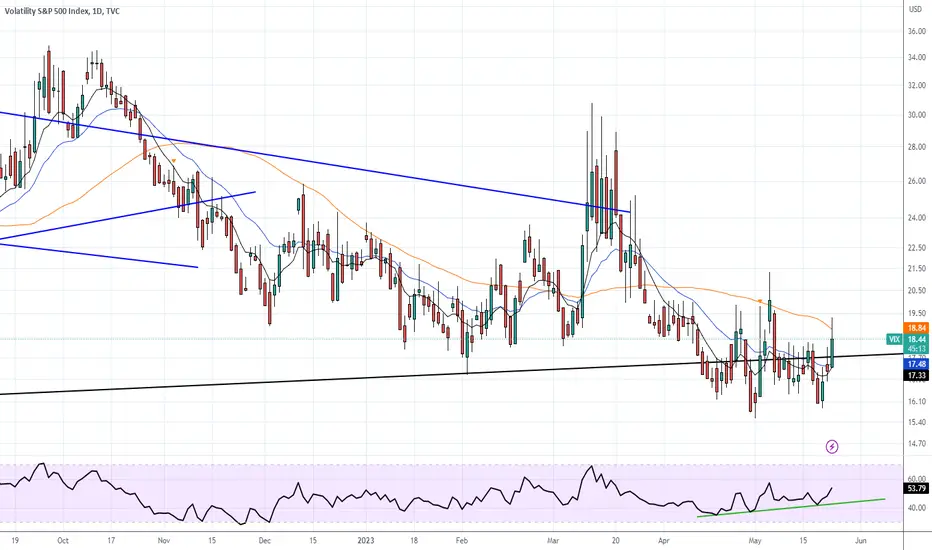
Approaching 2021 low support 14.5
If we break below 14 then we head to precovid lows .
Vix outside is Daily bbands and the indexes (IXIC and Iwm) are outside of theirs.. technicals say vix gaps up Monday but I don't know if it'll holds, there's no fear in the market, plus Daily MACD turned bearish
Narrative is Powell is pausing, debt ceiling done.. Blah blah lol..
We could see a bounce to 16.00 then we'll see what happens
As you can see it can take awhile to get back to channel top.
Needs a catalyst, but in the meantime I expect a pop
VIX trade ideas

VIX Support Cluster Ahead! Buy!
Hello,Traders!
VIX is headed to retest
The support cluster of the
Falling and horizontal
Support levels at around
14.32 from where I would
Be expecting a bullish rebound
Buy!
Like, comment and subscribe to help us grow!
Check out other forecasts below too!

Clown worldVIX below 15, last time this happens it bounced off aggressively over 30. Watch out bulls!!

Vix falls to trendline. Time for the big reversal?A trend line i have been watching fot VIX. Will this be the big reversal?

$VIX Double Bottom weekly chartthe last time TVC:VIX was at in the 14 range was June 28 2021 which is now support.

$VIX down over 12% at supportTVC:VIX May 1st low 15.52 June 1st low 15.53 down over 11% today. This is new money coming into the market from retail investors. The institutional banks and hedgefunds are selling into this rise.


My view of the Market 5/31/23I go over my thoughts on the Vix, DXY, APPL, Nvidia and some others as well.

VIXThat is clearly not an inverted h&s at support. Not a bullish RSI divergence either. Technical analysis doesn't work on the VIX.
VIX BEARS WILL DOMINATE THE MARKET|SHORT
Hello,Friends!
VIX pair is in the downtrend because previous week’s candle is red, while the price is clearly rising on the 4H timeframe. And after the retest of the resistance line above I believe we will see a move down towards the target below at 15.90 because the pair is overbought due to its proximity to the upper BB band and a bearish correction is likely.
✅LIKE AND COMMENT MY IDEAS✅

Vix 5 wave impulse pattersn repeatingBeen comparing the past two VIX 5 wave patterns. Wave 5 really gets going. Repeat this timer again, debt ceiling, Taiwan invasion by China, Iran V US shipping, Ukraine debacle, Biden bribes looking really real - impeachment pending and his own party will do it, bank failures increasing, commercial real estate foreclosures rapidly increasing, do I need to go on because I actually could. the most amazing indicator is that with all these candidates, equities just keep going up, the bull will NOT stop, the Greed factor is off the charts, and that's when the black swan appears. You decide.

$VIX threw in the towel long agoTVC:VIX mini inverse head & shoulder pattern has gone way of dodo bird
Long term trend has been broken for some time
We stated long ago that the direction this would be broken would show how #stocks would react
What does SP:SPX look like it wants to keep doing?
Will post quickly right after this
#SPX #VIX

$VIX spike incomingThe TVC:VIX is showing signs of a bottoming pattern:
Inverted head and shoulders.
Exhaustion point in the Flow (SEQ 13, followed by a price reversal)
Potential targets are 18.8 and then 22.

S&P still within Range when I first highlighted in JanuaryThe market is at crossroads again.
Whenever you have lows in the VIX people will highlight the potential risk to the market, we also in that period people coined the phrase "Sell in May and go away"
My view is unchanged to remain in the camp of a move lower with a decisive break of first of 4100 area.
But I have listened to arguments on both sides of the argument, those proposing a move to the 4400 area and the bears arguing lower.
So while 4150/4200 remains intact as the resistance I remain bearish but can't think of a catalyst at the moment to drive prices higher.
Good luck, do your research and investigation and make up your own mind.

💥 VIX Volatility 1D-TIMEFRAME ANALYSIS💥 VIX Volatility S&P 500 Index 1D-TIMEFRAME ANALYSIS
💗Hello ladies and gentlemen
This is my new idea for 💥💥 VIX Volatility S&P 500 Index
I hope my idea is clear
Support me by like and share thank you
Stay Safe💯💲💲💲
Good luck💰😍


VIX (@) (@) watch itHi,
If you're trading crypto i'd be watching the VIX.
Here's some insight.
1- high vix ( meaning good opportnity to buy volatile assets like BTC)
1 - low vix ( everyone to comfortable and thinks we may bounce to the moon)
This is just simplified version obviously.
Personally I think over the recent weeks of meme tokens fortunes / and people comfortable with buying crypto as it's been bouncing at every trendline, this means we are in for a flush out.
Questions to ask yourself:
1 - A flush to induce the fear + liquidations likely or unlikely ? / Can the VIX bounce at this stage?
2 - Is the Key inflation data 10/5 is the negative news required for the flush out?
3 - or will we just go to the moon and all be millionaires?
Key takeaway: Don't buy meme tokens if you're not willing to lose it all

$VIX gearing for a return of volatility post May expirationVIX volatility has been bottoming out over the past week, hitting a 15 handle last week. It's possible we may see that again this week. But the stars have aligned here using this Gann fan to pinpoint where we'll hit through the 2/1 line on the fan likely hitting as high as $22 sometime before the end of the month as the Debt Ceiling debate heats up, banking crisis continues, Fed speak flows and markets adjust to the idea that June may not be a pause.

🟩 VIX is continuing to improveVIX DROPS SIGNIFICANTLY 📉
The VIX has experienced a dramatic decrease, which is crucial to observe as we shift from a bearish to a more favorable market. Similar to what occurred in December and at the start of the year, the 28 level serves as a warning signal, particularly after a substantial market movement. This indicates that the market may be overheating, and we should be on the lookout for a potential bear market. Throughout the recent bearish phase, the VIX remained elevated above the 28 level.
SEEKING LOWER LEVELS 🎯
Ideally, we'd like to see the VIX return to lower levels. While occasional upticks are expected, it's important that they remain within the lower historical ranges. Lower volatility benefits the indices, but it's equally important for individual stocks to exhibit reduced volatility as wel

Dec VIX closing is very, very important!Monthly line charts are so simplistic; yet so important to analyze.
If you've read my previous DOW posts you know we are closely following the 2000-2002 bear market cycle vs. any other bear market and this chart further confirms my thoughts.
Notice how the VIX today (2017 to present) vs. the VIX 1994-2000 timeframe is diverging with the S&P. Both are making higher highs and higher lows until something breaks. In the 2000-2002 case we had the dot com bust (Rate of Change in very high risk/internet stocks plummeted) while today we have the Bond bust (Rate of Change within the bond market has plummeted). Towards the end of the VIX/S&P divergence (in the 2000-2002 case) the VIX ended up remaining "in trend" while the S&P lost about 46% over a 2 year period (see below chart). The VIX remaining "in-trend" for such a long period of time was a warning that something was going to break at some point and the indexes eventually lost a fair amount of value over a 2 year period.
In sum...my thoughts:
If we close Dec VIX below the blue dotted; Oct low will hold
If we close Dec VIX above the blue dotted line; Oct low will NOT hold.


Vix at alltime tops of 2 flirting around 3 support for 3 chanelsAny drop from here indicated by bearish reversal vix traders may expect it to nose dive ,if you are on stock indices (us30,us500,us100 and dax 30 ) go long for bullish reversal pattern as the stock have almost negative 90% correlattion
stocks always tops when vix bottom and bottom when vix tops this instrument as an indicator is being used by institution and they dony want to looose money so for as long you trade alongside the with patience you will seldomly go wrong

$VIX back into Triangle Pattern, $SPX toppishTVC:VIX gaining some momentum on the daily but cannot deny the damage that was done to it last month
#VIX is a tad harder to chart but it does look like it wants to bottom here
Opening AMEX:VIXM put selling strategy = bull
Keeping tight stops @ support levels
