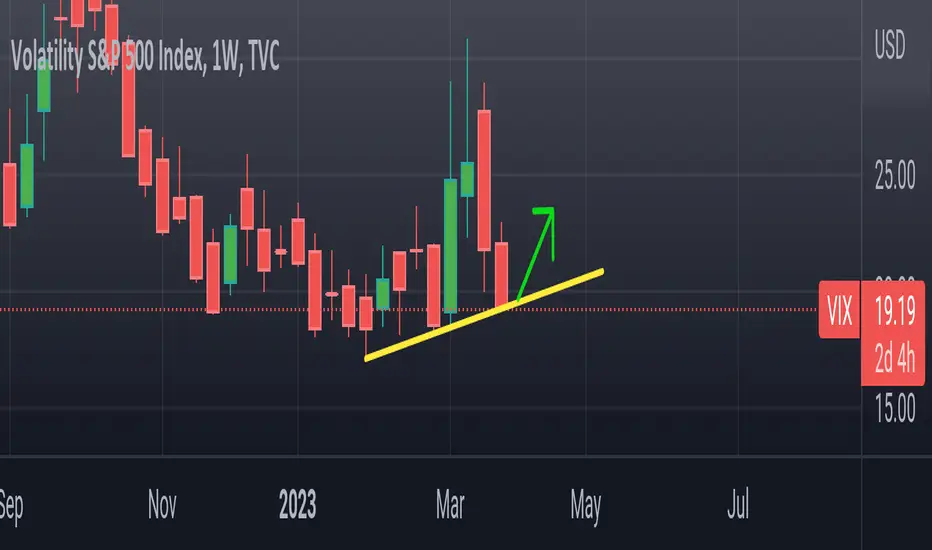
$VIX close to lower level, time for breather soon?Excuse my absolutely HORRIBLE art skills😄
$VIX USUALLY stays close to a "bottom" for few days
Kind of an exception = yellow
We're closing in to lower end of the symmetrical triangle
#VIX tends to bounce there
$SPX has had issues in this area, it does look better than before
Weekly volume on $SPX, see that?
#stocks
VIX trade ideas

FALLING WEDGE (VIX MAY RISE)Looks like the VIX may fancy some action. I don't really trust this symbol especially how it has been broken lately. However, there seems to be a falling wedge. If it is valid this may rise in the near term.

VIX - is the sell 20, buy 30 strategy done?Throughout 2022 you would have done VERY well taking profit when the TVC:VIX hit 20 and accumulating when the VIX hit 30. But has this trend concluded? This movement and profit/accumulation opportunity is consistent with the most recent tightening from 2017 to 2018 where fed funds were rising, and the yield for 2 year treasuries in the bond market exceeded fed funds. When the yield for 2 year treasuries fell below fed funds the VIX remained below 20 until covid hit. The VIX spiked during covid and consistently descended while the market expanded. This pattern is only observed in the most recent cycle and not something that we see consistently repeated historically. If the 2 year remains below fed funds, should not expect the VIX to range between 20 to 30 or will 20 to become the ceiling?

Vix longPulled back to weekly supporting trendline here.
I like the long to 22 here, then we'll go from there.

Does You Guys Like Ramps?VIX. Swing Trade. Careful not to get too big early and get volitlity crushed as the market picks a direction over the next days and coming weeks. MAC D Crossing. High Volume at Bottoms. VIXJ2023. $VIX $UVXY $ SVIX


Vix wants to breakout.breakout of this small down channel most likely will happen either tomorrow or end of week. Powell speakz tomorrow so i'm guessing we get a pump.

Dangerous environmentExpecting 33-35 by mid april, alt path it gets rejected at 28 and comes back down.
Black line was my prediction a couple months back (linked idea), blue lines are forecasted path and alt.

VIX -INVESTORS FEAR/GREED INDICATORVIX showing signals of a bullish market open
1)I believe something will big will happen to the market in the upcoming days as the VIX is almost reaching a new All time Low possibly indicating a bullish shift in the market.
2) In the second chart shown, it seems like the VIX will enter a free fall.
How to translate the VIX: Above 20 we are bearish and below 20 we are bullish. The VIX indicator is a representation of investor fear in the market. As the fear grows, the number increases making it bad for the market overall.
Why should we care?
-This indicator has successfully predicted the 2008 crash and Corona crash. It is a very powerful indicator when it comes to knowing how investors feel psychologically about the market.

$VIX has sold off after top call, now what? The $VIX is trading within the symmetrical triangle, still. As mentioned many times over the last year this pattern can take many months to resolve. Long term traders have to be patient until this revolves.
Short and intermediate time frame traders can use the tops and bottoms to implement buys and sells to maximize profit. It's what we've been doing.
At the moment it looks like the bottom part of the trend is calling. Not to pat ourselves in the back, again and again, we did call this to be a volatile year. Don't see a resolution to that until the triangle is broken.

$VIX - Something is brewingIn my previous post, I outlined where $SPY rejected off the bear flag resistance. You'll see that those two times correlate with the two times $VIX tested pennant support. With the third VIX retest, we may see $SPY near my gray TL of ~$400 (see related idea linked). I'm still expecting another leg down, and will take a short position if I see optimal R:R (I'll update).
No doubt, today was a boring day for $SPY. As I outlined in my update above, staying patient and understanding the right time to execute is what'll get you the W. Good luck!

03/20/2023 (Monday) SPY and Market Analysis and Deep Dive into cIn this Video I discuss The technical analysis of the SPY ETF which is a proxy the S&P500 that is often a tell on general market movements. I also discuss broader market Macros I have been watching including last week's and next weeks economic events. We also discuss some recession indicators, and other charts that show headwinds and tailwinds to equities.
You can use the links below and hit play to see the progression of these indicators from when I initially published them.
Please remember to like and subscribe in You Tube or Follow and Boost In Trading View. The feedback is very welcome also.

Keeping short in the markets We are keeping short in the markets and would recommend increasing shorts

VIXIs VIX finally spiking ? With all this mess people starting discounting a pivot from the Fed, what will happen if they hike next meeting ?

Is this VIX Bull Flag indicating more bank wreckage to come?Just asking for my investing friends ;-)
Cuz' this bullish fear pattern seems to indicate something more is coming.
Stew

vix 8 hour chart another 150% spike in April?Hello traders, today let's review VIX 8hour and daily chart .
Is it possible that another 150% burst is in the making now?
Entirely plausible, in fact based on advanced XABCD setup
the current pullback/correction might be over near 15/16.00
later in April. Based on time/price symmetry point C of
the XABCD pattern structure might come in at 15/16.00
sometime in April 2023.
The pattern is defined by point X at 33.00, point A at18.50,
point B at 30.00, expecting point C print at 16.00 and point
D print at 38.00, based on 127 extension.
Recommended strategy: buy calls / write puts once
we land near point C near 16.00. this is a higher risk
entry strategy, so always do your own due dill and
use other indicators to confirm the entry. good luck!
🎁Please hit the like button and
🎁Leave a comment to support our team!
RISK DISCLAIMER:
Trading Futures , Forex, CFDs and Stocks involves a risk of loss.
Please consider carefully if such trading is appropriate for you.
Past performance is not indicative of future results.
Always limit your leverage and use tight stop loss.

VIX will rallyVIX has been notably subdued lately, and though I don't spend much time with VIX; this chart looks ready to pop to me.

VIX: MICRO VOLATILITY CYCLES / POINTS OF CONTROL / MACD & RSI DESCRIPTION: In the chart above I have provided a MICRO ANALYSIS of the VIX INDEX which represents volatility in the overall US MARKET. This is a short term play for this week based on micro volatility cycles.
POINTS:
1. Deviation in critical thresholds is 4 points a small adjustment from previous VIX charts published as volatility adheres to this more often.
2. 23 Point serves as critical support for VIX.
3. Current Trend = Symmetrical Triangle Formation 2nd Phase
4. Overlapping Green Dotted Lines = Market Open
5. Overlapping Red Dotted Lines = Market Close
IMO: In my opinion whether or not current setup becomes invalidated I do not see current price action falling below 23 POINTS is the POINT OF CONTROL TO THE DOWNSIDE while 31 POINTS is the POINT OF CONTROL TO THE UPSIDE.
MACD: Current MACD levels continue to fall and are bound to flip into negative territory further confirming current setup that needs some pullback for VIX.
RSI: Current RSI levels are dropping and no current signs of DIVERGENCE that would indicate a sudden flip to positive territory.
SCENARIO #1: VIX price action agrees with current setup & respects symmetrical triangle setup and bounces off 25 in coming session & precedes to the upside to break 29.
SCENARIO #2: VIX price action disagrees with current symmetrical triangle setup and breaks below 25 & faces possible bounce at 23 instead.
FULL CHART LINK:https://www.tradingview.com/chart/UUCv2fGk/
TVC:VIX
AMEX:UVXY

CrashcalculationsVIX showing crash will happen between
04/2023 - 04/2024 in the next year.
Prepare yourselves:
- Dont DCA, they gonna take your money
- Dont get emotional, they gonna take your money also
- Dont buy stocks
- Gold, raw materials, oil and BTC are the only hard assets. Rest is bubble that will break
- The moneytakers always say: ‘don’t try to find the bottom’. My plan: ‘find the bottom and go all in’. All in = 1/3 of my hard cash money after it DCA. Not investment advice

$VIX hits top part of Symmetrical triangle$VIX rarely tends to trade in a small & tight range.
#VIX Sold off big last couple months & traded in a decent range for a bit & recently, including today, popped big.
As you can see it hit the top part of the Triangle Formation.
Hard to call here but stocks gaining some momentum, being that many were OVERSOLD, including $DJI & $NDX, $SPX and so on, is not out of the question.
Risk reward @ day lows in #stocks was good. A lot of fear out there is good for reversals.
Keep eye out on 4 hour charts for a good idea of where we stand.
FYI $DJI 4hour close was NOT the best setup BUT it did form a BULLISH Engulfing with GOOD VOLUME.
IMO 32.5k on #DJI is good & if it breaks & holds that is a good sign.

High IV sets up premium selling environmentWith VIX ripping on today's bank FUD the IV Rank and IV Percentile of SPY is the highest in a year's worth of trading days. This sets up opportunities for premium selling that have not existed for a very long time.
Rules:
SELL the 20 Delta Strikes at 45 DTE or greater in monthly expirations.
BUY wings at 10 Delta Strikes same DTE
That ended up being:
SELL May 350 Put
SELL May 414 Call
BUY May 325 Put
BUY May 425 Call
For 4.64 Credit.
The plan is to "manage deltas" and keep this position delta neutral through the duration until 50% credit received. That means if the sides get tested directionally roll up the untested side, increasing credit, to get the delta back to as close to 0 as is reasonable.

VIX 1D: likely up to low 30s againAs above.
VIX looking likely to bounce back up to low 30s again.
Will follow.
