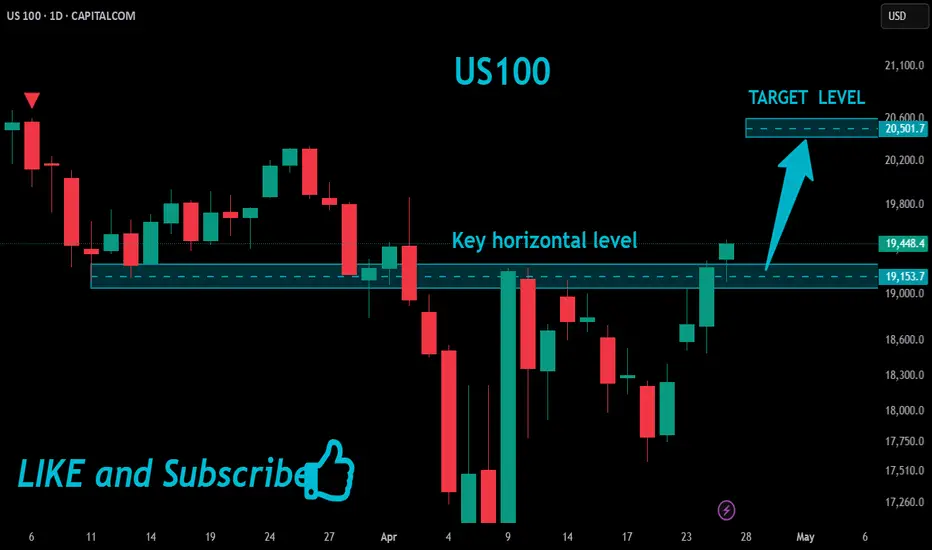
US100 Bullish Breakout!
HI,Traders !
US100 is trading in an
Uptrend and the pair made
A bullish breakout of the
Key horizontal level of 19153.7
And the breakout is confirmed
So we will be expecting a
Further bullish move up !
Comment and subscribe to help us grow !
NAS100 trade ideas
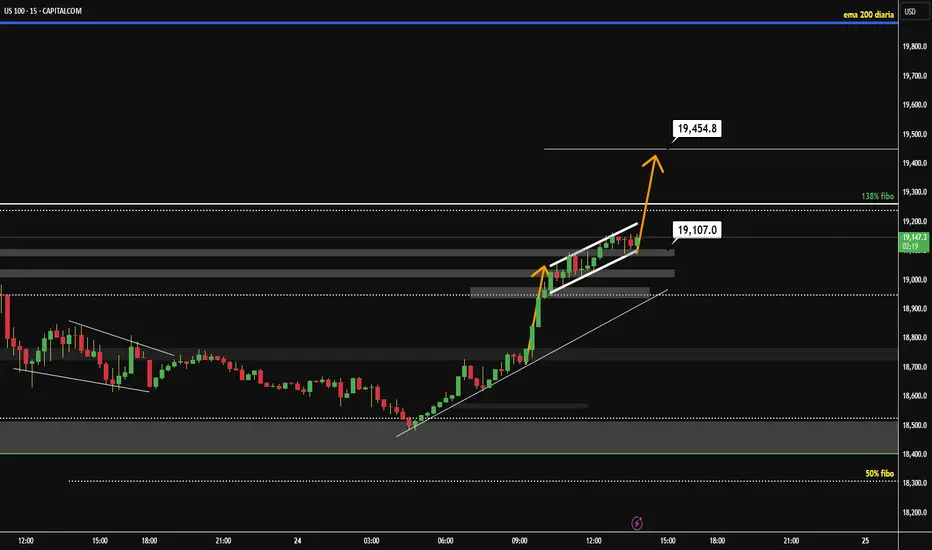
Bullish Continuation Setup Towards📈 US100 - Bullish Continuation Setup Towards 19,454.8 🚀
After a strong impulsive move, US100 is consolidating inside a rising channel, forming a classic bull flag structure. Price has respected multiple demand zones on the way up and currently sits just above the key support at 19,107.0. The bullish momentum is supported by a clean structure of higher highs and higher lows, and a breakout from the flag could trigger the next leg up toward the 138% Fibonacci extension level at 19,454.8.
As long as price holds above the 19,000–19,107 support zone, this scenario remains valid. Keep an eye on volume and a breakout candle for confirmation. 📊💥
It's all about TIME FRAME.For some, this seems a concept to understand...
Yes, you can be BOTH bullish and bearish stock markets at the same time.
It's all about TIME FRAME.

Hanzo | Nas100 15 min Breaks – Will Confirm the Next Move🆚 Nas100 – Hanzo’s Strike Setup
🔥 Timeframe: 15-Minute (15M)
——————
💯 Main Focus: Bullish Breakout at 19450
We are watching this zone closely.
💯 Main Focus: Bearish Breakout at 19300
We are watching this zone closely.
📌 If price breaks with high volume, it confirms Smart Money is in control, and a strong move may follow.
———
Analysis
👌 Market Signs (15M TF):
• Liquidity Grab + CHoCH at 19460
• Liquidity Grab + CHoCH at 19000
• Strong Rejections seen at:
➗ 19100 – Major support / Key level
➗ 19450 – Proven resistance
🩸 Key Zones to Watch:
• 19450 – 🔥 Bullish breakout level X 3 Swing Retest
• 19460 – Strong resistance (tested 5 times)
• 19100 – Equal lows
• 19500 – Equal highs

Hanzo | Nas100 15 min Breaks – Will Confirm the Next Move🆚 Nas100 – Hanzo’s Strike Setup
🔥 Timeframe: 15-Minute (15M)
——————
💯 Main Focus: Bullish Breakout at 19550
We are watching this zone closely.
💯 Main Focus: Bearish Breakout at 19450
We are watching this zone closely.
📌 If price breaks with high volume, it confirms Smart Money is in control, and a strong move may follow.
———
Analysis
👌 Market Signs (15M TF):
• Liquidity Grab + CHoCH at 19460
• Liquidity Grab + CHoCH at 19000
• Strong Rejections seen at:
➗ 19100 – Major support / Key level
➗ 19450 – Proven resistance
🩸 Key Zones to Watch:
• 19450 – 🔥 Bullish breakout level X 3 Swing Retest
• 19460 – Strong resistance (tested 5 times)
• 19100 – Equal lows
• 19500 – Equal highs
Hanzo | Nas100 15 min Breaks – Will Confirm the Next Move

Bearish StructureThe NASDAQ price action shows a clear bearish Elliott Wave structure, currently unfolding a 1-2-3-4-5 pattern. Price is in the corrective wave 4, potentially reversing around the 19,371.9 area, which overlaps with a previous supply zone.
From the local high at 19,508.1, bearish momentum has increased, and we expect one final leg down toward wave 5, targeting the 19,053.1 level or even the extended 18,920 (200% Fibonacci) zone.
Key levels:
Resistance: 19,371.9
Support: 19,053.1 and 18,920
Potential strategy:
Watch for a clear rejection around 19,370–19,400 to enter short positions targeting 19,050 or 18,920. Confirm with price action.

Can We Re Enter From The Same Place To Get Extra 500 Pips ?If we checked we will see that Nasdaq Gave us 300 pips , and that prove the support is very strong and we can re enter if the price hit the entry again and targeting extra 500 pips .so if the price go back to retest the same support we can add a new contract if we have a clear bullish Price action .

Bullish bounce off pullback support?USTEC has reacted off the pivot which has been identified as a pullback support and could rise to the 1st resistance which is an overlap resistance.
Pivot: 19,189.77
1st Support: 18,580.75
1st Resistance: 20,258.77
Risk Warning:
Trading Forex and CFDs carries a high level of risk to your capital and you should only trade with money you can afford to lose. Trading Forex and CFDs may not be suitable for all investors, so please ensure that you fully understand the risks involved and seek independent advice if necessary.
Disclaimer:
The above opinions given constitute general market commentary, and do not constitute the opinion or advice of IC Markets or any form of personal or investment advice.
Any opinions, news, research, analyses, prices, other information, or links to third-party sites contained on this website are provided on an "as-is" basis, are intended only to be informative, is not an advice nor a recommendation, nor research, or a record of our trading prices, or an offer of, or solicitation for a transaction in any financial instrument and thus should not be treated as such. The information provided does not involve any specific investment objectives, financial situation and needs of any specific person who may receive it. Please be aware, that past performance is not a reliable indicator of future performance and/or results. Past Performance or Forward-looking scenarios based upon the reasonable beliefs of the third-party provider are not a guarantee of future performance. Actual results may differ materially from those anticipated in forward-looking or past performance statements. IC Markets makes no representation or warranty and assumes no liability as to the accuracy or completeness of the information provided, nor any loss arising from any investment based on a recommendation, forecast or any information supplied by any third-party.

NAS100 Buy Trade Analysis (4H Timeframe)Entered a buy position on NAS100 after price retraced to the 0.618 Fibonacci level, which also aligns perfectly with the ascending trendline support. This area has acted as a strong confluence zone, showing signs of a potential higher low (HL) formation on the 4H chart.
✅ Confluences supporting the trade:
Price bounced from the 0.618 Fib retracement.
Respecting the trendline support indicating bullish structure continuation.
Formation of Higher Low on both the 4H timeframe and also clearly visible on Daily and Weekly charts, indicating strong bullish momentum from a higher timeframe perspective.
RSI is near the oversold zone (~30), showing signs of a potential bullish reversal.
🎯 Targets:
First TP around the 18,863 zone (previous resistance area).
Final TP in the region of 19,161–19,250, aligning with the 200 EMA and psychological resistance levels.
🛡️ Stop Loss: Placed below the trendline and previous swing low for protection in case of invalidation.

NASDAQ Potential DownsidesHey Traders, in today's trading session we are monitoring NAS100 for a selling opportunity around 19,400 zone, NASDAQ is trading in a downtrend and currently is in a correction phase in which it is approaching the trend at 19400 support and resistance area.
Trade safe, Joe.

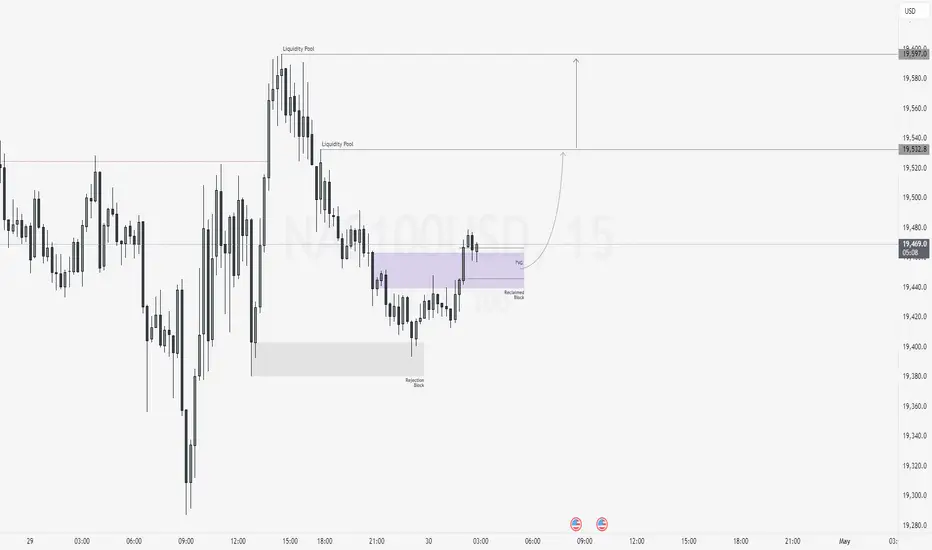
NAS100USD: Bullish Continuation from Reclaimed SupportGreetings Traders,
In today’s analysis on NAS100USD, we identify ongoing bullish institutional order flow, and as such, we aim to align our trading opportunities with this upward bias.
Key Observations:
1. Retracement and Institutional Support:
Recent price action shows a healthy retracement, with price finding institutional support at the rejection block. This was followed by strong displacement to the upside, resulting in a bullish market structure shift. This suggests the retracement may be complete, with further bullish continuation likely.
2. Reclaimed Order Block as Key Support Zone:
Currently, price is approaching a reclaimed order block—a zone where institutions previously initiated buying before price traded higher. When price returns to this area, institutions often reclaim the zone to initiate new long positions. This reclaimed block is further strengthened by the alignment with a fair value gap (FVG), enhancing the zone’s validity as institutional support.
Trading Plan:
We will monitor this reclaimed FVG zone for confirmation of bullish intent. Upon confirmation, we will look to enter long positions targeting liquidity pools in premium pricing zones, where buy-side liquidity is likely to reside.
Stay disciplined, wait for confirmation, and ensure the idea aligns with your broader strategy.
Kind Regards,
The Architect

Bullish bounce?NAS100 is falling towards the support level which is an overlap support that is slightly above the 38.2% Fibonacci retracement and could bounce from this level to our take profit.
Entry: 18,908.67
Why we like it:
There is an overlap support level that is slightly above the 38.2% Fibonacci retracement.
Stop loss: 18,461.05
Why we like it:
There is an overlap support that lines up with the 50% Fibonacci retracement.
Take profit: 20,200.53
Why we like it:
There is an overlap resistance level that is slightly above the 161.8% Fibonacci extension.
Enjoying your TradingView experience? Review us!
Please be advised that the information presented on TradingView is provided to Vantage (‘Vantage Global Limited’, ‘we’) by a third-party provider (‘Everest Fortune Group’). Please be reminded that you are solely responsible for the trading decisions on your account. There is a very high degree of risk involved in trading. Any information and/or content is intended entirely for research, educational and informational purposes only and does not constitute investment or consultation advice or investment strategy. The information is not tailored to the investment needs of any specific person and therefore does not involve a consideration of any of the investment objectives, financial situation or needs of any viewer that may receive it. Kindly also note that past performance is not a reliable indicator of future results. Actual results may differ materially from those anticipated in forward-looking or past performance statements. We assume no liability as to the accuracy or completeness of any of the information and/or content provided herein and the Company cannot be held responsible for any omission, mistake nor for any loss or damage including without limitation to any loss of profit which may arise from reliance on any information supplied by Everest Fortune Group.

NAS100 - Stock Market Waiting for a New Stimulus?!The index is trading above the EMA200 and EMA50 on the four-hour timeframe and is trading in its ascending channel. If the index continues to move upwards towards the specified supply zone, one can look for further Nasdaq short positions with a risk-reward ratio.
Last week, financial markets experienced a brief sigh of relief as U.S. President Donald Trump appeared to ease tensions by signaling a limited retreat in the tariff war with China, sparking hopes for reduced friction. However, this optimism quickly faded once it became clear that Trump’s retreat was neither substantial nor impactful.
From Beijing’s perspective, the trade war has transcended economic concerns, becoming an issue of national pride and sovereignty. As a result, China, the world’s second-largest economy, is not retreating as easily as Trump anticipated. This stance has evolved into a significant challenge for the White House. U.S. officials indicated that tariffs of 145% could be reduced within two to three weeks if an agreement is reached.
Nonetheless, according to Chinese authorities, negotiations have yet to even begin, raising doubts about Trump’s negotiation tactics. Additionally, other concessions, such as reducing tariffs on American automakers, remain uncertain, and Trump has even threatened to raise tariffs on Canadian car imports.
This environment not only fails to clarify U.S. trade policy but also deepens uncertainty for domestic businesses. Although the White House claims it is monitoring markets closely and Trump is eager to strike deals with key partners, these assurances have not alleviated concerns about the future of the U.S. economy.
In the upcoming week, critical economic data could either intensify or ease current worries. On Tuesday, the Consumer Confidence Index for April and the JOLTS job openings data for March will be released. The highlight, however, will be the preliminary estimate of GDP growth, scheduled for Wednesday.
The Atlanta Fed’s GDPNow model forecasts a 2.2% annualized contraction in the U.S. economy for Q1 2025. Meanwhile, a Reuters survey of economists projects a modest 0.4% growth rate, a significant slowdown from Q4’s 2.4% growth.
Accompanying these reports, the ADP private-sector employment data and the Personal Consumption Expenditures (PCE) index will be published. The core PCE for March is expected to show a monthly increase of 0.1% and an annual rise of 2.5%, down from 2.8% previously. Personal spending is anticipated to maintain its 0.4% monthly growth, reflecting resilient household expenditures.
Additionally, on Wednesday, the Chicago PMI and pending home sales figures will be released. Thursday will bring the Challenger layoffs data for April, but market focus will be on the ISM manufacturing PMI, expected to drop from 49 to 47.9.
The week’s main event will be Friday’s release of the Nonfarm Payrolls (NFP) report. Forecasts suggest job growth will slow from 228,000 in March to 130,000 in April, while the unemployment rate is expected to remain at 4.2%. Wages are projected to rise by 0.3%.If NFP and PCE data come in weaker than expected, market expectations for a 25-basis-point rate cut by the Fed in June could intensify, although the likelihood of a cut in May will remain low. Such data would likely be bearish for the U.S. dollar but could support equity markets if recession fears do not dominate sentiment.
Some Federal Reserve officials have suggested that if economic conditions deteriorate significantly, rate cuts could start as early as June. Currently, the Fed has maintained high rates to combat inflation but may lower them to support growth and prevent a sharp rise in unemployment if necessary.
Trump’s trade wars pose a dual risk of increasing inflation while hurting employment, complicating the Fed’s monetary policy strategy. Presently, the Fed is in a “wait-and-see” mode, but several officials indicated last week that cuts could begin if economic data worsens.
Beth Hammack, President of the Cleveland Federal Reserve Bank, told CNBC on Thursday that the Fed might lower rates starting in June if signs of economic weakening due to Trump’s sporadic tariffs appear.
Christopher Waller, a Fed Board member, stated on Bloomberg TV that he could foresee rate cuts if the labor market collapses but does not expect such a scenario before July.
On Thursday, Waller remarked, “It would not be surprising to see an increase in layoffs and a higher unemployment rate, especially if major tariffs return. I would expect faster rate cuts once signs of severe labor market deterioration emerge.”
These comments highlight the Fed’s current dilemma as it awaits clearer evidence of significant economic fallout from Trump’s trade wars.
The Federal Reserve’s mandate is to maintain low inflation and unemployment levels. Its primary tool, the federal funds rate, influences borrowing costs across the economy. The Fed can stimulate growth by lowering rates or curb inflation by raising them.
Economists warn that Trump’s tariffs present the risk of simultaneously driving up inflation while damaging employment, forcing the Fed to prioritize which challenge to address first.

Are You Ready For Nasdaq Next Flight ? 500 Pips Waiting For Us !Here is my opinion on Nasdaq , i think we have a very good closure and we can say we will go up for sometime in the next few days , so i`m waiting the price to go back to my support area ( Lower One ) that already broken , and then we can enter a buy trade and targeting 500 pips . also if the price touch the higher place and give me a good bullish price action , we can enter a buy trade with small lot size and if the price go to the lower one we can add one more contract .

Next up Nasdaq = US100 buy continues.if the correction wave ended at 0.5 fibo level which is current dip next target is new high. in shorter time timezones first targets are 19900 - 20250 - 22300


NasdaqIt came to major OB
Also we have a huge impulsive move, that’s why I expect the pullback
After pullback we can continue our movement to upwards

US100 BREAKS DOUBLE BUTTOM NECKLINE! US100 successfully breaks a neckline of a double buttom like structure! We may continue to see a continuous movement in price to the upside. Next resistance level could be the area of 20,267 (pullback resistance)
A buy opportunity is envisaged from the current market price

Following the Wave StructureAnalysis:
The NASDAQ100 appears to be following a classic 5-wave structure.
Currently, we are finishing Wave 3, with an expected corrective move toward the 50% Fibonacci retracement zone near 19,018.7.
From there, the chart suggests a continuation toward the 19,879 area (close to the daily 200 EMA) and, finally, toward the 20,866 target, completing the cycle.
Key zones:
Support: 19,018.7 (50% Fibo and strong structural level)
Resistance: 19,879.1 and 20,866.2
Additional levels: Daily 200 EMA and previous structural gaps
The path won't be in a straight line — expect consolidation and pullbacks along the way. However, the bullish projection remains intact as long as the 19,018.7 support holds.
Let's keep riding the wave! 🌊

NAS100 SELLGiven the resistance levels and the hidden divergence, it returned to the previous support level.

NQ: Crumbs left to the upsideGood day!
Following the weekly analysis, here are possible movements for the next few sessions.
As I mentioned few times now, there is still small room left to the upside followed by a consolidation before resuming the down trend with the beginning of Wave 3 and its Initial Swing.
Price has already made a new HH. Price might continue up without making a new HL. But I see a HL first. GL!

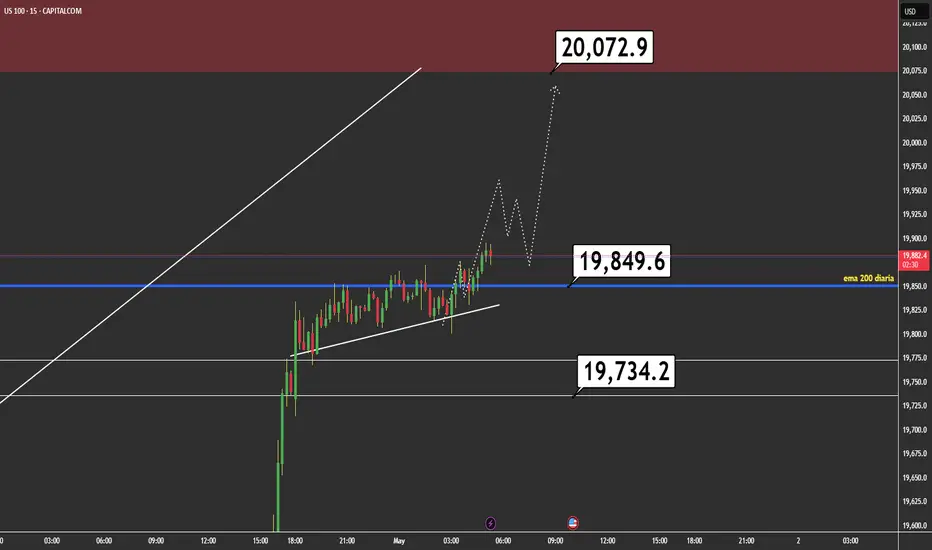
Navigating the Next Trend MoveOverall Trend:
The price shows a clear uptrend, as indicated by the ascending channel (sloping yellow lines). The price has been respecting this channel, with higher lows and higher highs.
Support and Resistance:
Support: The 19,734.2 level (marked on the chart) has acted as a key support. The price bounced from this level after a correction.
Resistance: The 19,849.6 level (also marked) appears to be a resistance zone, as the price has shown difficulty breaking above it on a sustained basis.
Projection: The price is approaching potential resistance at 20,072.9, which could be a target if the uptrend continues.
Indicators:
200-period EMA (blue line): The price is above the 200-period EMA, confirming the uptrend on this timeframe. The EMA is around 19,889.4, acting as dynamic support.
Patterns and Structure:
The price has broken out after consolidating near the 200 EMA and the support at 19,734.2, suggesting that buyers are in control.
Possible Scenarios:
Bullish Scenario: If the price breaks the resistance at 19,849.6 with increasing volume, it could head toward the target at 20,072.9. This would confirm the continuation of the uptrend within the channel.
Bearish Scenario: If the price fails to break above the resistance at 19,849.6 and confirms the pin bar with a downward movement, it could correct toward the support at 19,734.2 or even the 200 EMA at 19,889.4.
Trader Recommendation:
Long Entry (Buy): Wait for a breakout and close above 19,849.6 with confirmation (e.g., a strong bullish candle or increased volume). The target would be 20,072.9, with a stop loss below 19,734.2.
Short Entry (Sell): If a rejection at 19,849.6 is confirmed (e.g., with a bearish candle following the Pin Bar), consider a sell entry with a target at 19,734.2 or the 200 EMA, placing a stop loss above 19,849.6.
Conclusion:
The US 100 is in an uptrend, but the resistance at 19,849.6 and the Pin Bar suggest caution. Traders should wait for confirmation before entering positions, either to take advantage of the bullish continuation or a possible correction. Managing risk is key, especially on a 15-minute time frame, where volatility can be high.