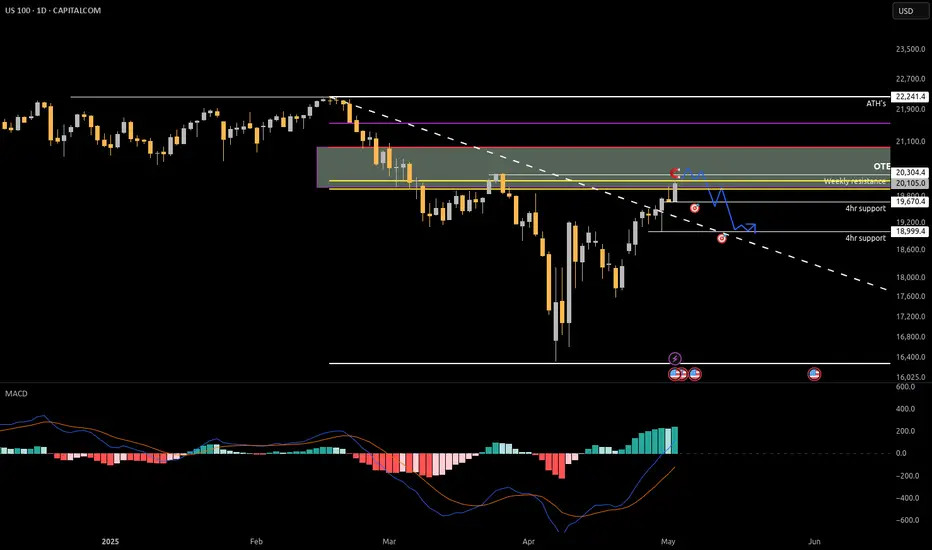
Short idea Us100, sweep of weekly resistancePrice is nearing the weekly resistance after extremely bullish price, expecting price to start stalling next week as it pushes in to the golden pocket zone where we'll see a move down and some higher lows lock in.
Ill be looking for a short entry on a low volume move up on the 5 minute time frame after we've taken the external liquidity above the weekly resistance level
NAS100 trade ideas
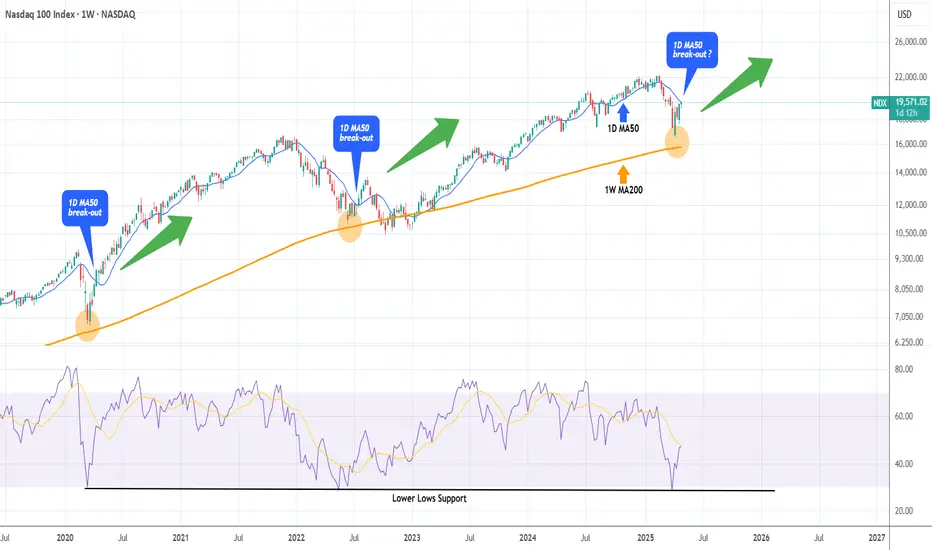
NASDAQ testing its 1D MA50. Break-out or Fake-out?Nasdaq (NDX) has reached its 1D MA50 (blue trend-line) for the first time since February 24. Following the (near) rebound on the 1W MA200 (orange trend-line), this looks like a textbook recovery from a correction to a new long-term Bullish Leg.
Chronologically the last such correction was the March 2020 COVID flash crash, which after it almost touched the 1W MA200, it recovered as fast as the current rebound and when it broke above its 1D MA50, it turned it into the Support of the new long-term Bullish Leg.
What wasn't a break-out but a fake-out was the rebound after the June 13 2022 (near) 1W MA200 rebound, when the break above the 1D MA50 was false as it produced a new rejection and sell-off later on. The difference is that 2022 was a technical Bear Cycle both in terms of length and strength.
Whatever the case, Nasdaq has seen the lowest 1W RSI (oversold) reading among those 3 bottoms. So do you think today's 1D MA50 test is a break-out or fake-out?
-------------------------------------------------------------------------------
** Please LIKE 👍, FOLLOW ✅, SHARE 🙌 and COMMENT ✍ if you enjoy this idea! Also share your ideas and charts in the comments section below! This is best way to keep it relevant, support us, keep the content here free and allow the idea to reach as many people as possible. **
-------------------------------------------------------------------------------
💸💸💸💸💸💸
👇 👇 👇 👇 👇 👇
X2: NQ/US100/NAS100 Long - Day Trades 1:2X2:
Risking 1% to make 2%
NAS100, US100, NQ, NASDAQ Long for day trade, with my back testing of this strategy, it hits multiple possible take profits, manage your position accordingly.
Risking 1% to make 2%
Use proper risk management
Looks like good trade.
Lets monitor.
Use proper risk management.
Disclaimer: only idea, not advice

NASDAQ Weekly Outlook - Potential ShortsPrice pushed up on Friday 25 May into an area of imbalance at 20170 and closed.
Then we have Monday which pushed up through out the day and failed to break and close above Friday 25th Hi, ending the day inside of Fridays candle followed by Tuesday being bear and failing to break and close above Monday hi candle but managed to break and close below Mondays candle close.
By this creating the high of the week, on a weekly time frame, reason for the short is to fill the daily volume imbalance highlighted in yellow. As price always needs to fill gaps in the market left behind by inefficient price action.
Only then I assume one could start looking for longs, as all sell side liquidity has been cleared.

NAS100 - Stock Market, Waiting for FOMC?!The index is above the EMA200 and EMA50 on the 4-hour timeframe and is trading in its ascending channel. I expect corrective moves from the specified range, but if the index continues to move upwards towards 21,000 points, we can look for the next Nasdaq short positions with a risk-reward ratio.
Last week, U.S. equity markets experienced $8.9 billion in capital outflows, while equity markets in Japan and the European Union saw net inflows. Additionally, U.S. Treasury bonds recorded an outflow of $4.5 billion—the largest since December 2023. Meanwhile, the gold market witnessed its first weekly investment decline since January.
Looking ahead, financial markets are focused on the upcoming earnings reports from major companies across sectors such as technology, healthcare, automotive, energy, and financial services. These reports are expected to significantly influence equity trends, investment strategies, and corporate outlooks. Below is a daily breakdown of key companies set to release earnings this week:
Monday, May 5, 2025
The week starts with a focus on the healthcare and biotech sectors:
• Before market open: Companies such as Palantir, Ford, Onsemi, and Tyson Foods will report earnings. Palantir and Ford are particularly noteworthy for investors in the tech and auto sectors.
• After market close: Healthcare firms like Hims & Hers Health, Axsome Therapeutics, and financial company CNA Financial will report.
Tuesday, May 6, 2025
Tuesday highlights several key tech earnings:
• Before market open: Celsius, Datadog, Rivian, and Tempus will publish their results. Rivian’s report is especially anticipated due to the intense competition in the electric vehicle space.
• After market close: Tech giants like AMD and Arista Networks will release earnings, along with Marriott from the hospitality sector.
Wednesday, May 7, 2025
A packed day for earnings reports:
• Before market open: Reports from Uber and Teva are expected, along with ARM Holdings, a key player in semiconductors.
• After market close: AppLovin, Unity, and Robinhood will release their reports—representing digital gaming, software, and fintech respectively.
Thursday, May 8, 2025
This day centers on digital health, cryptocurrency, and e-commerce:
• Before market open: Peloton and Shopify will report. Shopify’s performance is particularly critical in the online retail sector.
• After market close: Crypto firm Coinbase and online sports betting platform DraftKings are in focus.
Friday, May 9, 2025
Fewer companies will report, but some are of strategic interest:
• Firms like 1stdibs, Ani Pharmaceuticals, and Embecta are scheduled, as well as Telos and Algonquin—key names in energy and cybersecurity investing.
This week, markets are closely monitoring Wednesday’s FOMC meeting. At the March session, the Fed left rates unchanged and signaled only two potential cuts totaling 50 basis points for the year, based on its dot plot—suggesting a cautious approach to monetary easing.
Simultaneously, April’s U.S. Services PMI is set to be released today, providing clearer insights into post-tariff business activity.
Amazon’s CEO stated that, so far, there is no indication of reduced demand due to tariff concerns. Some inventory spikes were noted in specific categories, likely driven by stockpiling ahead of tariff implementation. Retail prices, on average, have not significantly increased, and most sellers have yet to raise prices—though that could change depending on how tariff policies evolve. Notably, essential goods have grown at twice the rate of other categories and now account for a third of all unit sales in the U.S.
Following April’s jobs report, the likelihood of a Fed rate cut in June dropped from 75% to 42%. With only one more employment report due before the June 18 meeting, hopes for an early policy shift have faded. Some analysts argue that without the tariff conflict, the Fed might already be cutting rates, given the downward trend in inflation, steady growth, and Congressional focus on fiscal measures.
The April jobs data showed that the U.S. labor market remains resilient—neither too strong to spark inflation fears nor too weak to trigger panic. After the release, with market confidence rebounding, Goldman Sachs forecasted the Fed’s first rate cut to come at the July 30 meeting.
The consensus expectation is for the Fed funds rate to remain in the current 4.25%-4.5% range, unchanged since January. The CME FedWatch tool currently assigns just a 1.8% chance of a rate cut at the upcoming meeting.
Economists warn that Trump’s newly imposed tariffs—active since April—could drive up prices and hurt employment, challenging the Fed’s dual mandate of controlling both inflation and joblessness. However, recent data shows inflation remained mild in March and the labor market held steady in April.
Nancy Vanden Houten, Chief U.S. Economist at Oxford Economics, wrote: “The data is strong enough for the Fed to stay on the sidelines and monitor how tariffs influence inflation and expectations.” While hard data remains stable, forecasts and sentiment surveys signal looming challenges. Business leaders and individuals express concern that rising costs may burden consumers and businesses in the coming months or years, possibly even tipping the economy into recession.

The same repeat as 4 April 2022The market seems to be recovering and more and more positive ideas are emerging. However, on a weekly timeframe, the NDX appears to be forming a pattern very similar to what we saw at the end of 2021. Even the RSI shows remarkably similar levels.
Personally, I’m staying cautious. I haven’t taken a position yet, but I’m ready to buy in on the next significant dip. I’ve set my alert around 14,500 – let’s hope we reach that level again. 😉
What are your thoughts on this? Feel free to share your opinion!

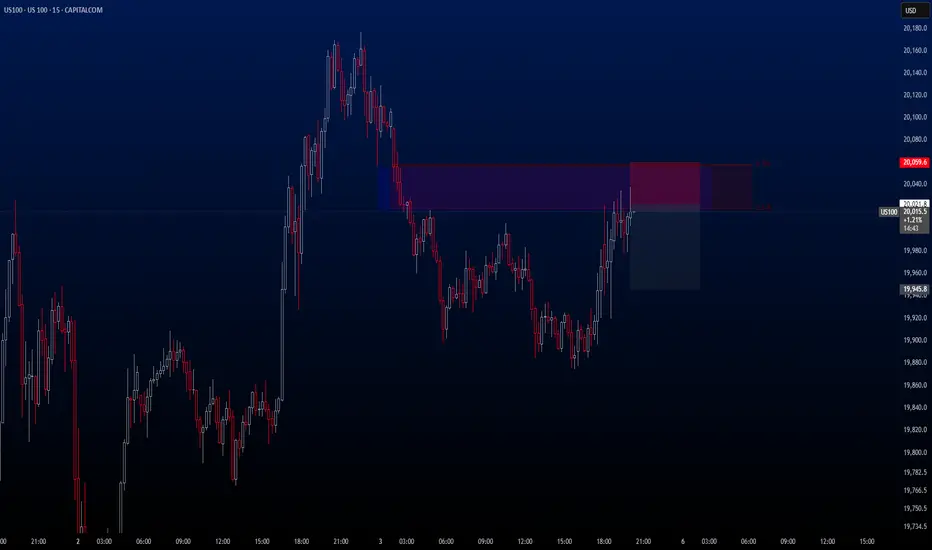
US100There’s a **Sell opportunity** forming on **US100**, but this one carries a bit more risk compared to the others.
That’s why I recommend opening the trade with a **smaller lot size** just for this setup.
🔍 **Criteria:**
✔️ Timeframe: 15M
✔️ Risk-to-Reward Ratio: 1:2
✔️ Trade Direction: Sell
✔️ Entry Price: 20021.8
✔️ Take Profit: 19945.8
✔️ Stop Loss: 20059.6
🔔 **Disclaimer:** This is not financial advice. It's a trade I’m taking based on my own system, shared purely for educational purposes.
📌 If you're also interested in systematic and data-driven trading strategies:
💡 Don’t forget to follow the page and subscribe to stay updated on future analyses.
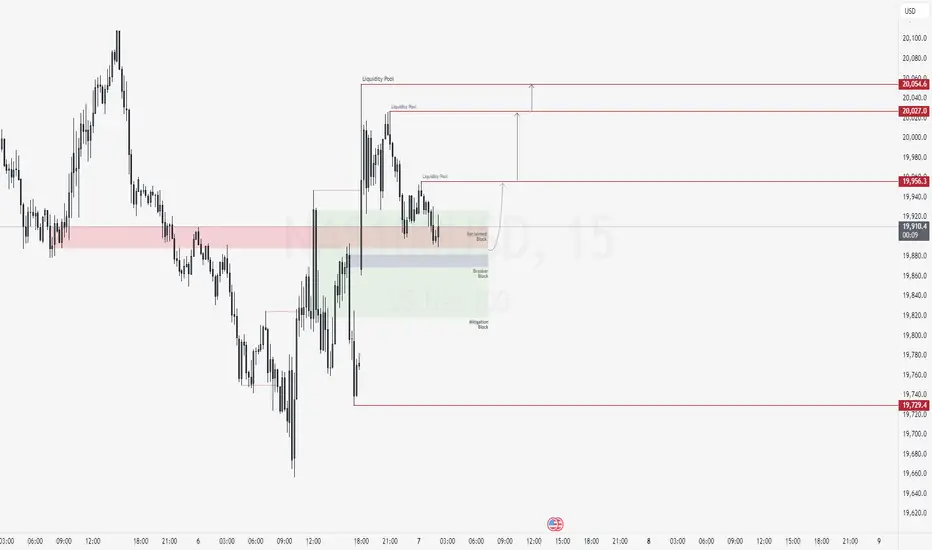
NAS100USD: Institutional Support Fuels Bullish MomentumGreetings Traders,
In today’s analysis of NAS100USD, we observe that institutional order flow remains bullish, and as such, we aim to align our trading opportunities with this directional bias.
Key Observations:
Institutional Support Zones:
Price has recently retraced into a significant institutional support area—a large mitigation block, where smart money typically mitigates previous sell orders and initiates new buy orders. This zone is further reinforced by the presence of a reclaimed order block, signaling an area where prior institutional buying occurred and may now be re-engaged.
Confluence of Bullish Arrays:
The alignment of the mitigation block, reclaimed order block, and an adjacent breaker block provides strong confluence. While price is currently showing signs of rejection at this zone, it is important to exercise patience and wait for confirmation before entering, especially given the size of the mitigation block.
Trading Strategy:
Upon confirmation, we will look to initiate long positions from these institutional support levels, targeting liquidity pools resting in premium pricing zones where buy-side liquidity is likely to reside.
Stay disciplined and let the market confirm your narrative.
Kind Regards,
The Architect
NAS100 buy now more than 1-10RRNAS100 buy now more than 1-10RR. The Ideia I shared before is confirmed for me. Lets see

Next up Nasdaq = US100 buy continues.if the correction wave ended at 0.5 fibo level which is current dip next target is new high. in shorter time timezones first targets are 19900 - 20250 - 22300

5 May Weekly NAS100 Forecast USTECH: Trade Talks and Fed Decision in Focus
Analysis:
Markets are at a pivotal juncture as investors monitor two critical developments: the potential resumption of U.S.-China trade negotiations and the Federal Reserve's upcoming policy decision.
Trade Negotiations: Renewed dialogue between the U.S. and China could alleviate tariff pressures, stabilize global supply chains, and bolster investor confidence, thereby reducing recession risks.
Federal Reserve Decision: The Federal Open Market Committee (FOMC) is scheduled to meet on May 6–7, 2025. While the Fed is widely expected to maintain the current interest rate range of 4.25%–4.50%, market participants are keenly awaiting Chair Jerome Powell's commentary for insights into future monetary policy directions.
Market Bias: Cautiously Bullish
The confluence of potential trade resolutions and a steady monetary policy stance supports a cautiously optimistic outlook. However, market volatility may persist pending concrete developments.
Key Levels to Watch:
USTECH (NASDAQ 100):
Resistance: 20 531
Support: 19 481
Conclusion:
Investors should remain vigilant, monitoring both geopolitical developments and central bank communications, as these factors will significantly influence market trajectories in the near term.
---
Disclaimer: This analysis is for informational purposes only and does not constitute investment advice. Always conduct your own research before making trading decisions.
---

Nasdaq LongsThe setup is self explanatory. If price is to retrace to the marked levels I will take longs, The details are in the charts...If price does not retrace, I will improvise

NASDQhe image shows a daily chart (1D) of the Nasdaq 100 (US100) on TradingView, with a detailed technical analysis suggesting a possible continuation of the long (bullish) trend, supported by various price levels, trendlines, and visual cues. Here's a description based on the chart:
🟦 Current Context
The price has recently broken above a key resistance area around 20,016 – 20,038, which may now act as support.
The current candle is bullish (green) and closes above this range, showing buyer strength.
There is a clear upward trend starting mid-April, with higher lows and consecutive bullish candles.
📈 Key Technical Elements
A target is marked at 21,009.5, highlighted by an orange horizontal line.
A light blue rectangle represents a potential projected move range, starting around the 20,000 zone and aiming toward 21,000.
A red box below the current price likely indicates the invalidation area or stop-loss zone.
Intermediate support levels include:
19,756.0 (blue line)
19,226.9 (orange line)
18,304.8 (deeper support)
🔁 Potential Long Continuation Scenario
If price holds above the 20,000 – 20,038 zone, we may see an acceleration toward the 21,009 target.
The overall pattern suggests a breakout from a consolidation phase, followed by a retest of the broken level (now support), and a potential upward continuation.
The diagonal trendlines indicate the formation of a broad ascending channel.
📅 Timing
The projected target may be reached within the coming weeks: a vertical black line is marked on May 21, 2025, possibly indicating the expected timeframe for the move.
✅ Conclusion
There is a clear bullish market structure, with a resistance breakout and well-defended supports. Unless there’s a false breakout or negative macro news, the long projection toward 21,009 appears technically valid.

next week or two weeks NQ vision as u see in the chart nothing special we need to reach the first high Buyside LQ
then pull back to the last low as second target sellside LQ
note that
any question feel free


Approaching 200SMA and long-term uptrend line, pullback expected(The following is a personal opinion and not investment advice. Please exercise independent judgment before making any decisions.)
Last week, the market remained in a consolidation phase near recent highs. The current price has broken through and is approaching the 200-day moving average, while also nearing a retest of the uptrend line that began in 2023. Considering the price has been on a 9-day upward streak, there is a high probability of a significant pullback upon reaching these key resistance levels.
At present, it is difficult to categorize the overall market trend as either bullish or bearish. With ongoing uncertainty around tariff-related policies, the market appears to be in a consolidation phase rather than a sustained uptrend, lacking fundamental support for further rallies. As such, there is a higher probability that the price will fill the lower gap at 18,264.
Next week, special attention should be given to the FOMC rate decision and the press conference on Wednesday. Recent employment data has been strong, and inflation has shown signs of rising. The Fed is expected to maintain its current stance, which could trigger a market sell off. It's also possible the pullback may begin as early as Monday or Tuesday, offering opportunities for early positioning.
From a technical perspective, if the price continues to rise, it may test the area around the 200-day moving average and previous trend resistance, roughly between 20,226 and 20,400. Should this area be tested early in the week (Monday or Tuesday), I would consider initiating short positions. Light positions can be considered above the 20,000 level, as the current price range offers a relatively favorable risk-to-reward.
To the downside, a break below the 19,000 level is required first, after which there's a higher probability of filling the price gap between 18,264 and 18,583. If supported by macro news, the market may further test lower levels in the coming weeks, including 17,589, 17,278–16,946, and potentially 16,108–16,589. These levels will require further observation as developments unfold.

NAS Targets 21,720- 21,800 Makers holding this thing up...Long for next 2 weeks then, mid May after options expirations... very cautious. 21,720- 21,800 is pivot where one might want to consider taking profits or trying shorts, sfterwards market could go anywhere

Nasdaq The current structure has an imbalance so a collapse is expected from my side plus we have a bearish flag formed waiting breakout towards the lowest low of the structure

Nasdaq-100 H4 | Falling toward a pullback supportThe Nasdaq-100 (NAS100) is falling towards a pullback support and could potentially bounce off this level to climb higher.
Buy entry is at 19,595.55 which is a pullback support.
Stop loss is at 18,900.00 which is a level that lies underneath an overlap support.
Take profit is at 20,343.35 which is a swing-high resistance.
High Risk Investment Warning
Trading Forex/CFDs on margin carries a high level of risk and may not be suitable for all investors. Leverage can work against you.
Stratos Markets Limited (tradu.com):
CFDs are complex instruments and come with a high risk of losing money rapidly due to leverage. 63% of retail investor accounts lose money when trading CFDs with this provider. You should consider whether you understand how CFDs work and whether you can afford to take the high risk of losing your money.
Stratos Europe Ltd (tradu.com):
CFDs are complex instruments and come with a high risk of losing money rapidly due to leverage. 63% of retail investor accounts lose money when trading CFDs with this provider. You should consider whether you understand how CFDs work and whether you can afford to take the high risk of losing your money.
Stratos Global LLC (tradu.com):
Losses can exceed deposits.
Please be advised that the information presented on TradingView is provided to Tradu (‘Company’, ‘we’) by a third-party provider (‘TFA Global Pte Ltd’). Please be reminded that you are solely responsible for the trading decisions on your account. There is a very high degree of risk involved in trading. Any information and/or content is intended entirely for research, educational and informational purposes only and does not constitute investment or consultation advice or investment strategy. The information is not tailored to the investment needs of any specific person and therefore does not involve a consideration of any of the investment objectives, financial situation or needs of any viewer that may receive it. Kindly also note that past performance is not a reliable indicator of future results. Actual results may differ materially from those anticipated in forward-looking or past performance statements. We assume no liability as to the accuracy or completeness of any of the information and/or content provided herein and the Company cannot be held responsible for any omission, mistake nor for any loss or damage including without limitation to any loss of profit which may arise from reliance on any information supplied by TFA Global Pte Ltd.
The speaker(s) is neither an employee, agent nor representative of Tradu and is therefore acting independently. The opinions given are their own, constitute general market commentary, and do not constitute the opinion or advice of Tradu or any form of personal or investment advice. Tradu neither endorses nor guarantees offerings of third-party speakers, nor is Tradu responsible for the content, veracity or opinions of third-party speakers, presenters or participants.

Technical and digital analysisWe notice that we are in an upward correction and there is an increase in momentum. We are waiting for sellers to weaken in order to buy

NAS100: Buyers Stepping InSeems like the bearish move is over, market showing signs of a potential shift. Rising volume and buyer activity suggest a possible bullish move or relief rally

A Possible Play For Nasdaq if you keep a close eye on this here is a possible out come for the next few months for Nasdaq so keep an eye out for it but don't be married to it

Following the Wave StructureAnalysis:
The NASDAQ100 appears to be following a classic 5-wave structure.
Currently, we are finishing Wave 3, with an expected corrective move toward the 50% Fibonacci retracement zone near 19,018.7.
From there, the chart suggests a continuation toward the 19,879 area (close to the daily 200 EMA) and, finally, toward the 20,866 target, completing the cycle.
Key zones:
Support: 19,018.7 (50% Fibo and strong structural level)
Resistance: 19,879.1 and 20,866.2
Additional levels: Daily 200 EMA and previous structural gaps
The path won't be in a straight line — expect consolidation and pullbacks along the way. However, the bullish projection remains intact as long as the 19,018.7 support holds.
Let's keep riding the wave! 🌊
