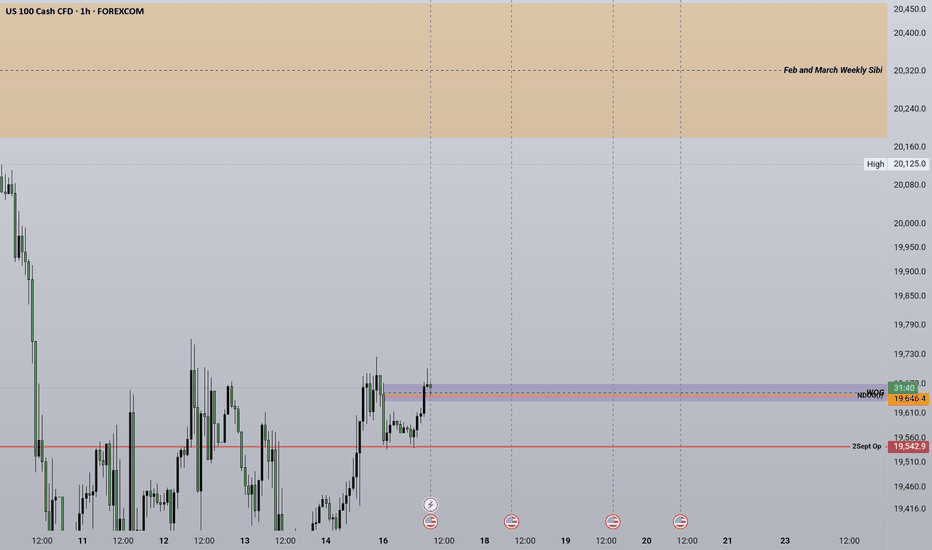
Nas100 Weekly BiasBased on how the market ranges are laid out, I am keen to seehow is it that the market will unfold and what is it that the Institutional Orderflow will rea h out for first. Overall I will be trading on internal ranges and keeping my focus narrowed on that. Anything else outside that will not be of my interest. Due to manual intervention I am expecting because of fundamentals.
OVERALL I would like to see a small run on the upside, going for the Premium arrays and then a deep run for shorts for the purpose of purging sell orders below Lows and then buying them prior long term reversals for longs
NAS100 trade ideas
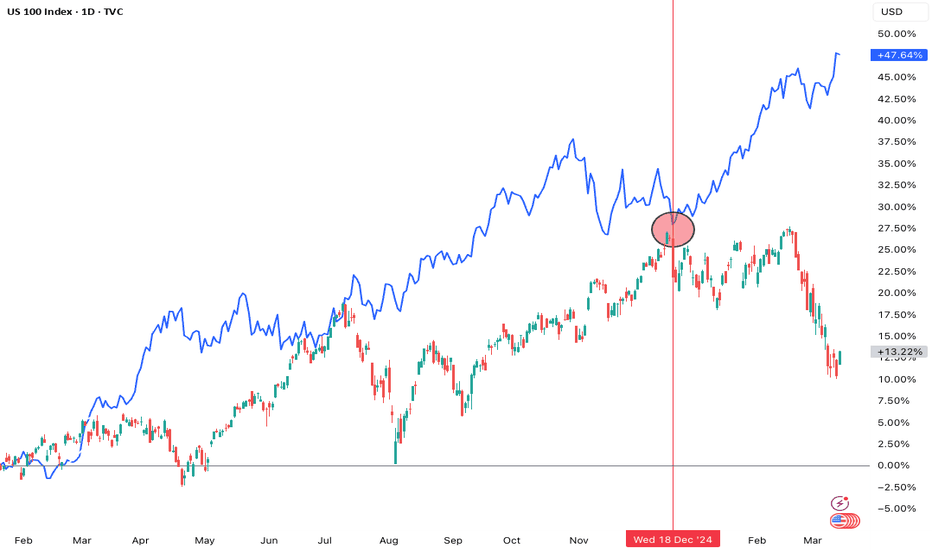
stocks vs gold race to recession safety since fed did its last rate cut in december 2024 fomc, Stocks down gold up
this is classic recession trade - dump risk assets and buy safe heaven
gold hit $3000 on recession panic market crash
if stocks bounce, panic may price out
if stocks fall more, panic selling will trigger which could slow the speed of gold rally
this market action and recent gold bars flying to New York from london may be recession panic buying not the tariff inflation hedge
in 2020 market crash everything went down but when recovery started gold proved better than stocks.
Navigating NASDAQ: Positioning for a Possible Bounce Next Week
- Key Insights: The NASDAQ is presently facing bearish sentiment with a
potential downturn in the short term. Investors should be aware of oversold
conditions that could lead to a short-term bounce. Cautious optimism
prevails among experts regarding a possible correction, suggesting
monitoring key resistance levels for signs of reversal.
- Price Targets: For investors considering a long position, price targets should
be strategically set.
- Next week targets: T1: 20,200, T2: 21,000
- Stop levels: S1: 19,000, S2: 18,800
- Recent Performance: The NASDAQ has fallen 12% over the past few weeks,
highlighting a bearish trend. This downturn has been mirrored across major
stock indices, and recent market volatility has exacerbated the decline.
- Expert Analysis: Analysts currently hold a bearish outlook, highlighting a
critical support level near 19,195 amidst broader economic uncertainty
affecting the NASDAQ. However, signs of a potential rally have emerged, with
futures indicating possible movement toward 20,500.
- News Impact: The downturn includes NASDAQ's worst day since 2022, which has
heavily influenced market sentiment. Analysts are monitoring the Nasdaq 100
with plans for possible expansion into the Russell 2000 and S&P 500,
targeting recovery opportunities amidst volatility.
While the NASDAQ is under pressure, the potential for a short-term recovery
remains plausible. Investors should anticipate volatility, making it crucial to
watch key price levels and resistance points for potential market movements next
week.
NAS100 - Stock Market Enters Downtrend?!The index is trading below the EMA200 and EMA50 on the four-hour timeframe and is trading in its descending channel. If the index moves down towards the specified demand zone, we can look for further buying opportunities in Nasdaq. A break of the channel ceiling will also continue the short-term upward trend in Nasdaq.
According to EPFR data reported by Bank of America, investors withdrew $2.8 billion from equity funds last week, marking the largest outflow of the year so far. Meanwhile, U.S. government bonds saw an inflow of $6.4 billion, the biggest weekly increase since August.
Scott Basnett, the U.S. Treasury Secretary, stated in an interview that there are no guarantees to prevent an economic recession. He welcomed the decline in stock markets, viewing it as a sign of a healthy market. Analysts believe this shift in tone—unusual for a Treasury Secretary who typically reassures economic strength—suggests an effort to prepare the public for a possible recession.
According to data from the Polymarket betting platform, the probability of a U.S. recession in 2025 is currently estimated at 41%. Reuters reports that American households are increasingly pessimistic about the economic outlook. However, the Federal Reserve may be reluctant to respond aggressively to a weakening economy, given growing concerns that the Trump administration’s trade policies could further fuel inflation.
These concerns were reflected in financial markets on Friday, as the University of Michigan’s consumer sentiment survey showed a decline in consumer confidence for March. Additionally, consumers now expect inflation to reach 3.9% over the next five years, the highest level in more than 30 years.
In an interview with Breitbart, Basnett emphasized the need to remain vigilant against persistent Biden-era inflation and expressed support for deregulation to lower costs. He also stressed that while tackling inflation, the government must also address affordability concerns. Additionally, he backed interest rate cuts to help reduce housing costs and auto loan payments.
This week will be packed with major economic events, creating a high-risk environment for precious metals traders amid ongoing geopolitical developments during Trump’s second term.
Central banks are back in the spotlight, as several key monetary institutions are set to announce their policy decisions in the coming days:
• Tuesday: Bank of Japan
• Wednesday: Federal Reserve
• Thursday: Swiss National Bank & Bank of England
Furthermore, a series of macroeconomic data releases could influence market sentiment, including:
• Monday: Retail sales & Empire State Manufacturing Index
• Tuesday: Housing starts & building permits
• Thursday: Weekly jobless claims, existing home sales & Philadelphia Fed Manufacturing Index
The Federal Reserve is expected to keep interest rates unchanged in its upcoming meeting. Market participants will closely watch the Fed’s updated economic projections and Jerome Powell’s press conference for insights into future monetary policy.
According to a Bloomberg survey, economists anticipate two rate cuts by the Fed this year, likely starting in September. However, despite declining stock indices and rising recession concerns, Powell is expected to maintain a cautious stance, avoiding any rushed rate cuts.
While consumer and business confidence has weakened, the Federal Reserve has limited flexibility to lower rates due to persistently high inflation indicators.
going long(buying) on US100 US100 (Nasdaq 100) Analysis – Daily & 4H Timeframe
Key Demand Zone: 17,679.0, where buyers are likely to step in.
Liquidity Sweep: Occurred at 17,676.7, indicating possible stop-loss hunting before a reversal.
Expectation: Price is likely to revisit the demand zone and reverse if buyers show strength.
Trade Plan
Entry Strategy: Wait for bullish confirmation (e.g., rejection wicks, bullish engulfing, or a break of structure on lower timeframes).
Stop-Loss: Placed below 17,676.7 to avoid further liquidity grabs.
Take-Profit Target: Next supply zone or resistance level based on structure.
Risk Management: Consider scaling in with partial entries instead of going all in at once.
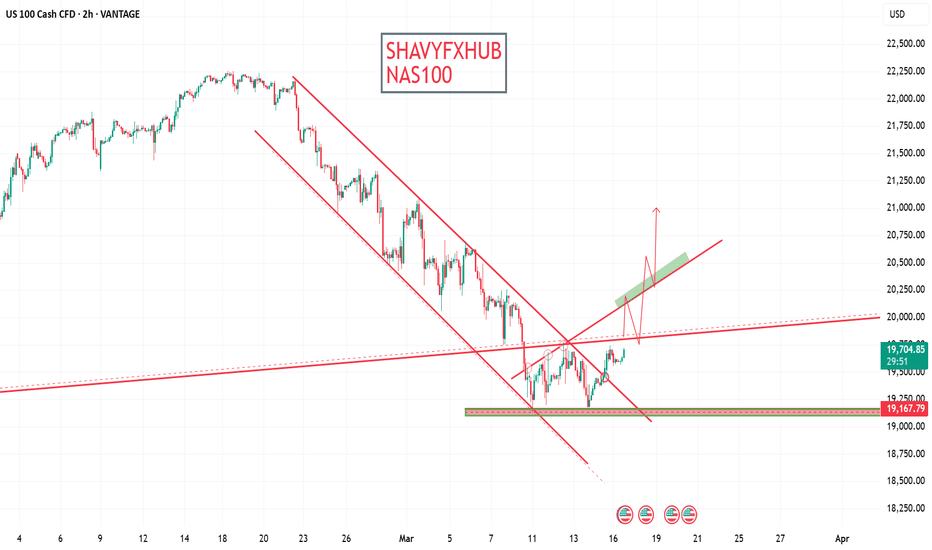
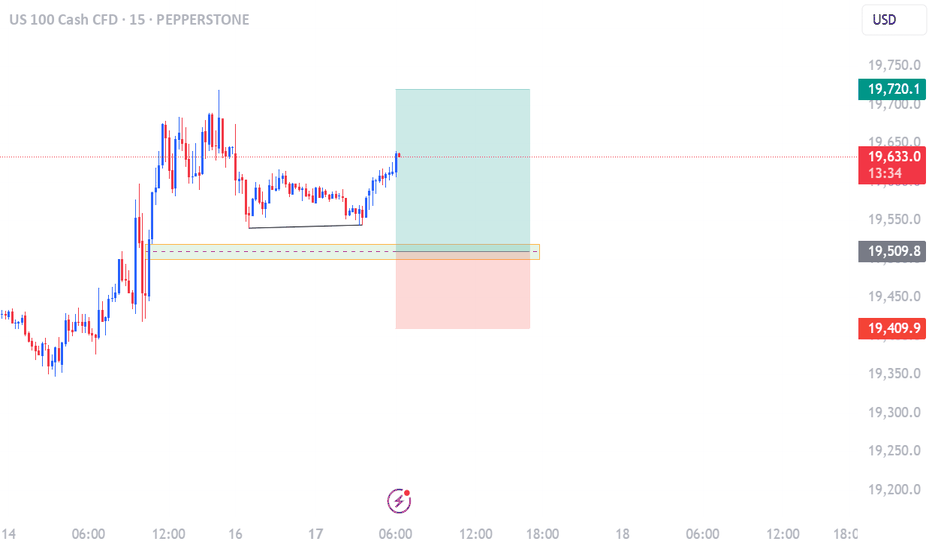
NAS100 1HR // 17 March AnalysisWe can see that the 1 hour downtrend on NAS100 has been broken.
Looking to see if the price can retest the drawn support/resistance zone around the 19500.00 area. Potential buys with 20000.00 being a nice target if we see a nice retest from the marked support/resistance zone.
DISCLAIMER: This analysis is purely for personal reference and record keeping and should be taken as educational material only, NOT FINANCIAL ADVISE. I will not be responsible for profits or loses due to this analysis.
NQ: Upcoming Weekly AnalysisFA Analysis:
1- This week, we have major central banks meetings. The most important one is the FED. Market is seeking hints and signals for free money and rate cuts to tackle the manufactured recession created by Trump "policies".
Any signal of free money from the FED will be well received; any other outcome will be translated in a huge sell-off of stocks and equities.
2- Last week, we saw that US equities and European Equities were moving in opposite direction! This tells us that money is fleeing US market. So the sell-off of US equities is not temporary; Investors and corporations seem lost confidence and trust in US Stocks. This has to be confirmed with the FED.
3- Also last week, we saw a huge undershoot of US Consumer Sentiment.
All the above are very bearish US Equities. The FED and tax cuts are the only factors that might save US equities in the ST. The damage in the MT< seem irrevocable.
TA Analysis:
Weekly TF:
NQ provided a weekly bearish close with a large wick. The weekly close was just above a Monthly support (dashed green line).
If we receive positive signals from the FED, price should retest 20315 (the previous higher swing of the Monthly support (circle).
If not, sellers will continue the downtrend.
Daily TF:
NQ provided a green Friday candle, but it was an inside the previous red candle. So no break, no shake from daily perspective.
I mentioned last week that the area 19100-19600 will be the next MT< Support/Resistance area (yellow box). As you can see, this scenario seems correct.
I think price will continue consolidate in this area until the FED.
Trade safely and wish you Good luck!
Bearish drop?USTEC is rising towards the pivot which is an overlap resistance and could drop to the 1st support which acts as a pullback support.
Pivot: 19,857.80
1st Support: 18,725.96
1st Resistance: 20,398.38
Risk Warning:
Trading Forex and CFDs carries a high level of risk to your capital and you should only trade with money you can afford to lose. Trading Forex and CFDs may not be suitable for all investors, so please ensure that you fully understand the risks involved and seek independent advice if necessary.
Disclaimer:
The above opinions given constitute general market commentary, and do not constitute the opinion or advice of IC Markets or any form of personal or investment advice.
Any opinions, news, research, analyses, prices, other information, or links to third-party sites contained on this website are provided on an "as-is" basis, are intended only to be informative, is not an advice nor a recommendation, nor research, or a record of our trading prices, or an offer of, or solicitation for a transaction in any financial instrument and thus should not be treated as such. The information provided does not involve any specific investment objectives, financial situation and needs of any specific person who may receive it. Please be aware, that past performance is not a reliable indicator of future performance and/or results. Past Performance or Forward-looking scenarios based upon the reasonable beliefs of the third-party provider are not a guarantee of future performance. Actual results may differ materially from those anticipated in forward-looking or past performance statements. IC Markets makes no representation or warranty and assumes no liability as to the accuracy or completeness of the information provided, nor any loss arising from any investment based on a recommendation, forecast or any information supplied by any third-party.
NASDAQ 100 is showing strong bullish momentum after breaking key📍 Entry: Around 19,657.88
📍 Stop Loss: Below 19,499.15 (To minimize risk in case of reversal)
📍 Take Profit: 20,134.84 (Targeting next resistance zone)
🔹 The price is breaking out from consolidation, confirming bullish sentiment.
🔹 Volume and momentum support a continuation move upward.
🔹 Waiting for a slight pullback before entering can provide better risk-reward.
NAS100 is BullishPrice was in a strong downtrend, and it seems that the bottom is in for NAS100, as a double bottom reversal pattern along with bullish divergence has emerged on four hourly time frame hinting the arrival of bulls to the scene. If previous lower high is broken with volume then we can expect a bullish rally as per Dow theory. Targets are mentioned on the chart.
US100 Index Technical Analysis and Weekly Outlook
Daily chart of the US100 (Nasdaq 100) index showing recent price action and technical indicators.
Technical Overview and Key Levels
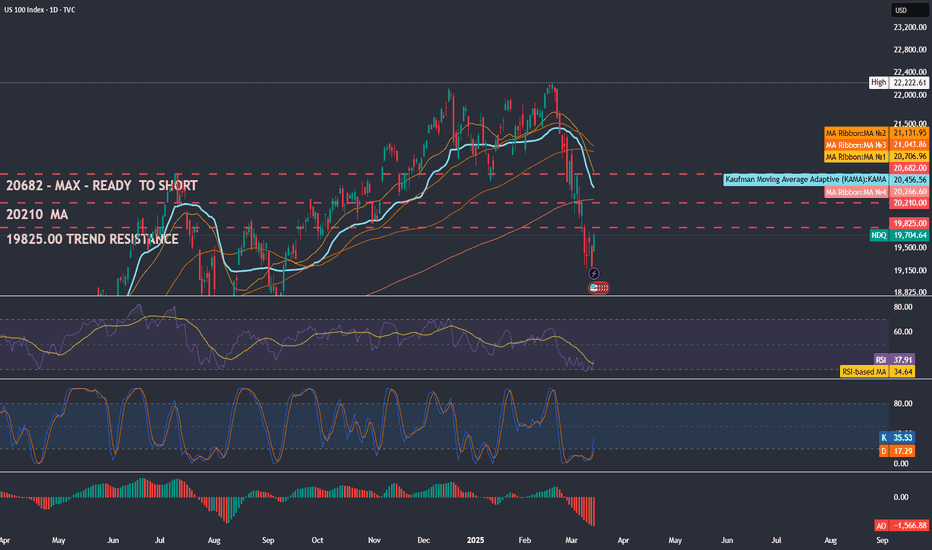
The US100 index (Nasdaq 100) is attempting to rebound after a recent correction. On the daily timeframe, price has climbed back above short-term moving averages (e.g. the 50-day MA around ~19,500) but remains below the longer-term 200-day MA near the 20,300–20,400 zone . This suggests interim bullish momentum with a key overhead resistance still intact. The 20,000 level in particular is a major psychological barrier and support area – it has acted as an important floor multiple times and coincides with the 50-week EMA
Momentum indicators are reflecting the recent sell-off and bounce:
The Relative Strength Index (RSI) plunged into oversold territory during last week’s decline (daily RSI dropped below 30). It has since turned upward toward the 60s (current RSI ~62) as price rebounded . This rising RSI indicates momentum is improving off oversold levels without yet reaching overbought extremes.
The Stochastic oscillator on shorter timeframes has swung up quickly and is now overbought (e.g. %K in the high 90s) after the sharp bounce. This suggests the rally may pause or consolidate in the very near term. A mild pullback from overbought short-term conditions could actually provide a better entry point for buyers.
The MACD is showing early signs of a bullish crossover. The daily MACD line has started curving up and the histogram turned positive, reflecting that downward momentum is waning and bullish momentum is building (MACD on daily was in “Buy” territory by Friday). If this crossover sustains, it strengthens the case for a trend reversal upward.
Support and resistance levels to watch:
19,150 – 19,400: Strong support zone. This area marked recent lows and roughly the 61.8% Fibonacci retracement of the Aug–Feb rally. Buyers have been stepping in here, and as long as it holds, the index may form a swing bottom.
19,765: Initial resistance (last Friday’s low turned into new resistance after Monday’s drop) . The index reclaimed this level, so it now needs to stay above ~19,765 to confirm the dip-buying strength.
20,000: Major psychological round number and pivot. Beyond its psychological significance, this level was noted as a long-term pivot and is near the 50-week EMA . A sustained move above 20k would be a bullish signal, but failure here could invite sellers.
20,300 – 20,400: Next critical resistance area. This is roughly where the 200-day moving average lies (around 20,385) (Nasdaq 100: Clearing This Key Barrier Would Signal Dip-Buying Has Legs | Investing.com). It also coincides with prior highs before the recent sell-off. A breakout above 20,300 would signify the index regaining its longer-term uptrend, potentially targeting the mid-21,000s next. However, this zone may cap the upside in the coming week unless there is a strong positive catalyst.
18,800: If weakness resumes and the recent support fails, 18,800 is a downside level to watch (near the 78.6% Fibonacci retracement) . A drop toward this level would indicate a deeper pullback, though such a move appears less likely given the current bullish rebound bias.
Market Sentiment and News Drivers
Market sentiment has been improving after a volatile period, but it remains mixed. Last week, the Nasdaq 100 officially fell into a correction, dropping over 10% from its December peak amid growth fears and trade conflicts. By Friday, however, stocks staged a relief rally as bargain hunters stepped in, ending a bumpy week on a positive note. This dip-buying rebound, despite lingering risks, suggests traders are willing to re-enter at lower levels.
Several fundamental factors could impact the US100 in the coming week:
Federal Reserve Meeting (Mar 18–19): The Fed’s policy decision is a central focus. The consensus is that the Fed will hold rates steady at the current 4.25–4.50% range on Wednesday (FOMC Meeting 2025 Date & Time: What To Expect From Federal Reserve Interest Rates?), given recent signs of cooling inflation. Fed Chair Jerome Powell’s press conference will be scrutinized for clues on future rate moves. Any surprise hawkish tone could spook equities, while hints at eventual rate cuts later in the year (if economic risks rise) would cheer the market. With policy uncertainty high, expect some volatility around Wednesday’s announcement.
Inflation and Economic Data: The latest inflation report provided some relief – February CPI came in cooler than expected at 2.8% year-over-year (vs ~2.9% forecast) . This easing inflation has bolstered hopes that the Fed can stay on hold or even consider cuts if growth slows. Following CPI, the producer price index (PPI) and jobless claims data (released late last week) also gave insight into price pressures and the labor market . Looking ahead, there aren’t many major U.S. data releases this week, but traders will watch flash PMI surveys and any consumer confidence readings for signs of economic trend changes. Importantly, last week’s uptick in consumer sentiment will be monitored to see if ongoing uncertainties start eroding confidence again
Trade War and Geopolitics: Trade tensions remain a wildcard for the Nasdaq’s largely global tech constituents. President Trump’s recent flurry of tariffs on imports from China, Mexico, and Canada has injected uncertainty into markets Investors have been reacting swiftly to trade news – stocks plunged on tariff threats and bounced on hints of compromise. For example, late last week Trump backed away from an additional 25% tariff on Canadian exports, which “reignited optimism” and helped stocks rebound alongside the benign CPI report . Now, Europe is in focus: the EU threatened counter-measures to U.S. tariffs, and the U.S. warned of reciprocal duties Any escalation or resolution in these trade disputes could swing market sentiment sharply. In the coming week, keep an eye on any U.S.–China trade negotiations or announcements on tariffs – positive developments could fuel a risk-on rally in tech shares, while negative headlines could quickly revive risk-off selling.
Market Internals: The Nasdaq’s heavyweights will be influential. They led the bounce late last week , and continued strength in these leaders (on improving sentiment) would support the index. Additionally, safe-haven flows bear watching – gold prices hit record highs amid the recent stock turmoil If we see gold and bonds pulling back, it might confirm a return of risk appetite benefiting equities. Conversely, renewed flight-to-safety (rising gold, yen, Treasury prices) would signal caution that could cap Nasdaq’s upside.
Overall, the backdrop for the week is one of cautious optimism. The market has shown resilience to bad news recently (buying the dip), and there is hope that the Fed’s steady stance and cooling inflation will allow tech stocks to recover. However, unresolved trade conflicts and any hawkish surprises mean volatility can quickly return. Traders should stay alert to news headlines, as the index may react swiftly to any shifts in macroeconomic or geopolitical tone.
Trade Recommendations and Opportunities (1-Week Horizon)
Given the technical setup and current drivers, there are a couple of potential short-term trade opportunities in the US100. It’s important to choose entries near support or on confirmed breakouts, and always define your risk (stop-loss) and reward targets. Here are two strategies with favorable risk-reward for the coming week:
📈 Buy the Dip (Long near Support): The recent support zone around 19,200–19,400 presents an attractive entry for a rebound trad (Nasdaq 100: Clearing This Key Barrier Would Signal Dip-Buying Has Legs | Investing.com)】. Consider going long if the index pulls back into this area (for instance, if early-week consolidation or a Fed jitters dip brings prices back down near 19,300). This zone has Fibonacci support and buyers have defended it recently. A reasonable stop-loss could be placed just below 19,150 (below the recent swing low), to limit downside if support fails. For the upside, look for a climb back toward 20,000 or slightly below as a profit target. This yields a solid risk-reward – for example, risking roughly 200–300 points to potentially gain 600–800+ points. If bullish momentum is especially strong, you could even aim for the 20,300 area (next resistance), but given a one-week horizon, securing profits near the big 20k level is prudent. Rationale: RSI recovery and bullish momentum suggest the correction may have bottomed; buying near support allows you to ride a possible continuation of the relief rall . Just be mindful of any abrupt negative news (e.g. surprising Fed tone or tariff escalation) that could break support – hence the need for a stop.
📈 Breakout Play (Momentum Long on Break of 20k): If the index doesn’t dip much and instead pushes above key resistance, a momentum trade is possible. A clear break above ~19,765 (last week’s pivot) already signaled buyers return. The next trigger would be a strong move and 1H/4H close above 20,000. If you see the Nasdaq 100 future/index trade firmly through 20k on good volume (perhaps catalyzed by a dovish Fed remark or easing trade fears), that could signal upside follow-through. One could enter a long position on the breakout around 20,050, with a tight stop ~100 points below (back under 19,950, in case it’s a false breakout). The first target would be the 200-day MA zone near 20,300-20,400, which is likely to be tested if 20k is clear. This trade risks ~100 points to make ~250-350, a favorable ~2.5-3.5:1 ratio. Rationale: A break of 20k would indicate the index is overcoming a major hurdle and shorts may rush to cover. With improving sentiment, a quick 1-2% pop could occur. But because 20k is such a strong level, ensure confirmation (don’t jump in on a brief spike). If the breakout falters, be ready to cut losses fast.
🔻 (Alternate) Sell into Strength (Short at Resistance): While the bias leans bullish this week, an aggressive counter-trend trade could be to sell/short if the index spikes into the 20,300–20,400 resistance and shows signs of stalling. For instance, if after the Fed meeting the Nasdaq surges toward the 200-day MA but then prints a reversal pattern (e.g. a bearish candle or RSI divergence) around 20,300+, it may signal a near-term top. A short entry in the 20,300s with a tight stop above 20,500 (just beyond the 200-day and round-number buffer) could be considered. The pullback target could be back to ~19,800 or 19,500. This contrarian idea would be capitalizing on an overbought rally hitting a known supply zone. Rationale: The 200-day MA and prior highs will be tough to crack on the first, especially if there isn’t a new positive catalyst beyond what’s expected. Any disappointment (say the Fed is less dovish than hoped, or no progress on trade issues) around that time could trigger profit-taking. This trade carries more risk (fading the bullish trend), so it’s only for those watching closely and it should be exited quickly if the index powers straight through 20,500.
Risk-Reward and Risk Management: Both long setups above have at least a 2:1 or 3:1 reward-to-risk profile, which is desirable. Always adjust position size so that if the trade goes wrong (stop is hit), the loss is manageable for your account. Given the event risk this week (Fed meeting), consider using stop-loss orders to protect against sudden moves. It’s also wise to take partial profits if the index approaches an interim barrier (for example, lighten the long position near 20k and trail your stop up, in case it reverses from there). The short setup, if taken, should be managed even more tightly due to the overall uptrend resumption — treat it as a quick tactical trade.
Conclusion
In summary, the US100 index is at an inflection point. Technically, it shows signs of a budding short-term recovery: oversold conditions have eased, and the index is climbing from key support toward major resista. The coming week’s news – especially the Fed’s stance and any trade developments – will determine if this rebound has legs. A break above 20,000 would mark a bullish shift in trend, whereas failure to penetrate that ceiling (or a shock that sends the index back below ~19,300) would keep the market in a choppy trading range. By combining technical cues (like moving average levels, RSI/Stochastic signals) with awareness of the news flow, traders can identify high-probability entry points. The best opportunities appear to be buying on weakness as long as support holds, or buying the breakout if bullish momentum accelerates – both with defined risk. With prudent risk management, the US100’s current setup offers an attractive chance to capture a continuation of the tech rally that could play out over the next week.
Nas100 1. Market Structure & Context
The market has been in a bullish uptrend within a rising channel (trendlines).
A "Diagonal Expecting" zone suggests a potential exhaustion of bullish momentum.
A "Trend Trap" indicates a possible liquidity grab before a major move.
2. ICT Concepts Applied
Liquidity Grab & Manipulation:
The market may have engineered liquidity above the previous highs before the sell-off.
The "Sell Off" label suggests Smart Money could be distributing positions at the premium levels.
Market Structure Shift (MSS):
If the price breaks the trend trap zone with conviction, it signals a shift from bullish to bearish order flow.
Fair Value Gap (FVG) & Price Targets:
The first take-profit level at 16,529.9 aligns with an area where liquidity might rest.
The final target at 14,125.1 suggests price filling an imbalance or mitigating an order block (OB) at a lower timeframe.
3. Expected Move
Potential Short-Term Rebound:
A small retracement could occur before the major drop (blue projection).
Overall Bearish Expectation:
A strong downward move into lower levels where Smart Money may reaccumulate positions.
Conclusion
This chart is anticipating a significant bearish move after a liquidity grab at highs, with take-profit zones aligning with ICT principles like FVG fills and order block mitigation. If the market respects these areas, traders could look for confirmation (e.g., displacement, breaker structures) to enter short positions.
NAS100 - Not Out of the Red Forest Yet?How I see it:
Nasdaq did break out of 4Hr trend.
Convincingly enough, I'm not so sure?
If you look at the bigger picture, there is a lot of traffic upwards.
Now key resistance @ 19960.00
Potential " LONG" Target -
TP 1 = 20305.00
(The 38.20% FIB retracement on the complete 4HR bearish trend)
Potential " SHORT" Targets -
TP 1 = 19112.00
TP 2 = 18295.00
Keynote:
As previously mentioned, now you can see why I'm not even considering a
"Bullish Reversal" under 21000.00
Thank you for taking the time to study my analysis.
