NAS100 | 4H Bullish Breakout from Channel – Eyes on 19,970 ZoneNAS100 4H Chart Analysis
Price broke out of a well-respected descending channel with a strong bullish push. Currently approaching a supply zone around 19,970, where we may see a reaction.
Key Levels:
• Resistance/Supply: 19,970
• Support: 19,450 / 18,823
Technical Notes:
• Breakout confirmation above descending trendline
• Clean retest zone formed at previous structure (around 18,800)
• Watching for either a rejection at supply or continuation into 21,000+
Next Steps:
• Waiting for confirmation: reaction or break of the 19,970 zone
• Will look for 15m–1H entry if we get a pullback to structure
NAS100 trade ideas

NSDQ100 INTRADAY trend change supported at 18950 Key Support and Resistance Levels
Resistance Level 1: 19590
Resistance Level 2: 20070
Resistance Level 3: 20344
Support Level 1: 18460
Support Level 2: 17820
Support Level 3: 17330
This communication is for informational purposes only and should not be viewed as any form of recommendation as to a particular course of action or as investment advice. It is not intended as an offer or solicitation for the purchase or sale of any financial instrument or as an official confirmation of any transaction. Opinions, estimates and assumptions expressed herein are made as of the date of this communication and are subject to change without notice. This communication has been prepared based upon information, including market prices, data and other information, believed to be reliable; however, Trade Nation does not warrant its completeness or accuracy. All market prices and market data contained in or attached to this communication are indicative and subject to change without notice.

NQ: On its way to complete Wave 2NQ has completed both Initial and retrace swings of wave 2 and now NQ is in its way to complete the Impulsive swing.
We got a breakout and retest of the upper TL and price is moving up.
We have Manufacturing and Services data in a few.
1- Inline data: A shy retrace and continuation up/
2- Undershoot: Price might retest again the upper TL.
3- Overshoot: Direct move up.

NAS100 | 1H | BUY ZONEHey There;
SIGNAL ALERT
BUY NAS100 / 17,682,18
🟢TP1: 18,000,00
🟢TP2: 18,500,00
🟢TP3: 19,726,64
🔴SL: 16,782,61
RR / 2,2
Please don't forget to like 🙏🏻
Thanks to everyone who supports my analysis with likes. 💙💙💙

NAS100USD: Will Price Fill the Gap?Greetings Traders!
In today’s analysis of NAS100USD, we observe that the market is currently operating within a broader bullish institutional order flow. However, recent price action has left behind an inefficiency—a gap that may serve as a short-term draw on liquidity.
KEY OBSERVATIONS:
1. Gap in Price – Inefficiency Identified:
Price has created an imbalance that is yet to be filled. Typically, such inefficiencies act as magnets for price, drawing it back before resuming its primary trend. In this case, the gap may be partially filled as the market seeks equilibrium.
2. Draw on Liquidity – Last Point of Efficiency:
The last point of efficiency below current price levels may serve as the draw on liquidity. This level could attract price action as institutions look to rebalance orders and facilitate continuation.
3. Active Order Block – Potential Entry Zone:
Price is currently testing a bearish order block. Upon confirmation, this area may offer a short-term selling opportunity with the objective of targeting the liquidity pool and the inefficiency below.
TRADING PLAN:
Entry Consideration:
Look for bearish confirmation within the current order block zone before entering. The goal is to trade the short-term retracement within a bullish environment.
Profit Targets:
Target the liquidity pool and the unfilled gap near the last point of efficiency as short-term objectives.
Remain diligent, patient, and aligned with your trading plan. Always conduct your own analysis to ensure any setup is in harmony with your strategy and risk tolerance.
Kind Regards,
The Architect

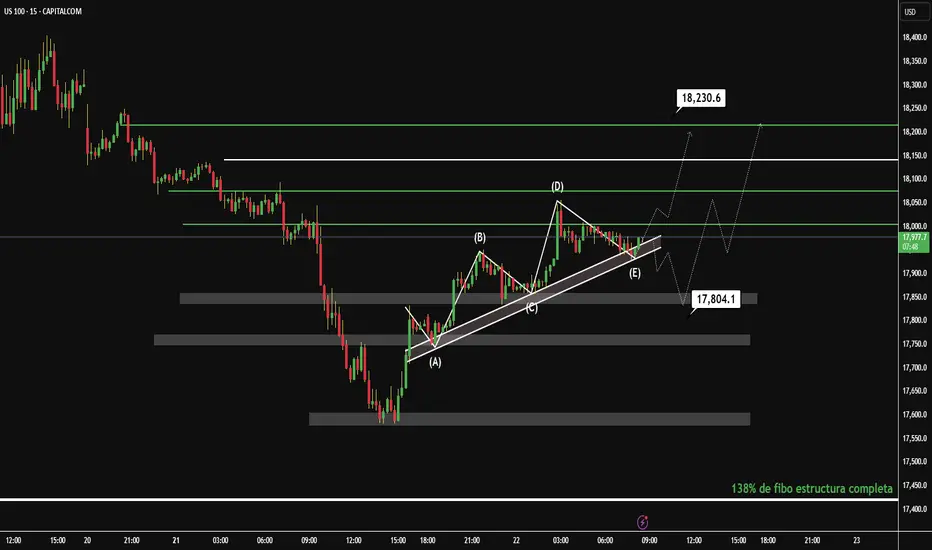
Ready for Takeoff: Buy Signal DetectedThe 15-minute chart of the NASDAQ shows a recent bullish move following a correction. I identify an interesting technical structure that could indicate an upcoming directional move.
Technical Analysis:
Patterns and Structure:
Symmetrical Triangle (A): The price has formed a symmetrical triangle between points (B) and (D), suggesting consolidation before a breakout. This pattern is neutral, but the recent upside breakout indicates a possible bullish continuation.
Fibonacci: The retracement from the high at (D) to the low at (E) reached the 38.2% Fibonacci level, which acted as dynamic support (17,804.1). This level is key and reinforces the validity of the current rebound.
Support and Resistance:
Support: The 17,804.1 level (38.2% Fibonacci) and the triangle base at 17,797.2 are key supports.
Resistance: The next upside target is at 18,230.6, a previous resistance level. If the price breaks above it, it could target 18,400.
Trend:
The breakout of the symmetrical triangle and the rebound from the 38.2% Fib confirm a short-term uptrend. The price is breaking the triangle's downtrend line (E), reinforcing the bullish momentum.
Trading Idea:
Entry: Consider a long entry (buy) at the current level (~18,000) or wait for a pullback to the support at 17,804.1 for a better risk-reward ratio.
Target: First target at 18,230.6 (resistance). If the momentum continues, the next level to watch is 18,400.
Stop Loss: Below the support at 17,797.2, to protect against a false breakout.
Risk/Reward: An entry at 18,000 with a stop at 17,797 and a target at 18,230 offers an R/B ratio of approximately 1:1.2.
Conclusion:
The NASDAQ at 15M shows a bullish breakout following a symmetrical triangle, with support at the 38.2% Fibonacci level. The short-term trend is bullish, with an initial target at 18,230.6. Monitor support at 17,804.1 to confirm the continuation of the move.
This analysis is concise and structured for a TradingView post. If you need adjustments or more details, please let me know.
Disclaimer: Grok is not a financial advisor; please consult one. Do not share information that could identify you.
US 100 Index - Is 17404/749 Support Important?As European traders return from their extended Easter break they turn on their screens to find US assets back under pressure. The US 100 index dropped 2.2% yesterday to close at 17779, which included a late rally from a mid session low at 17570.
These moves are potentially reflecting a growing unease around numerous important issues, including, a lack of progress in trade talks with US allies, US economic growth concerns and President Trump's on-going challenge to Federal Reserve independence.
Looking forward, US 100 traders have a lot to focus on this week, Tesla reports its earnings after the close tonight, against a backdrop of weekend news reports which suggested it may be about to delay production of cheaper EVs. That aside, investors may also be focused on sales projections for 2025, autonomous driving plans and the impact of tariffs on the company's profitability.
It may well be a similar story when Alphabet reports its earnings after the close on Thursday.
Throw in the latest April Preliminary PMI Survey releases on Wednesday from the developed economies, which could well start to show the impact of tariffs on growth, business sentiment and inflation, and it is possible that the recent US 100 index volatility could continue across the week.
Technical Update: Could Potential Support at 17404/17749 Be Important?
As impressive as the 18% recovery in the US 100 index from the April 7th 2025 low to the April 10th 2025 high (16290 up to 19222) appeared, after the latest price weakness, this upside may prove to be a limited reactive move, although further confirmation may still be required.
As the chart above shows, the latest upside strength saw the index back to what some traders may have viewed as an important resistance, marked by a combination of the declining Bollinger mid-average (18992 at the time) and the 50% Fibonacci retracement of the February 18th 2025 to April 7th 2025 weakness, which stands at 19258.
With the latest price activity seeing weakness materialise again, it might now be suggested
this potential resistance range remains the important focus on the topside, although much will depend on future market sentiment and price trends.
With this in mind, what are the potential supports we might wish to monitor, to help us gauge how much further the current weakness may have to carry?
Possible Support Levels:
Fibonacci retracements can offer an insight into potential support zones, with them possibly able to hold, even reverse price weakness back to the upside. Therefore, 17404/17749, which is equal to the 50% and 61.8% Fibonacci retracements of the April price strength, maybe an area traders are currently focusing on.
However, there could still be potential for a further period of price weakness if this 17404/17749 range is broken on a closing basis. In that case, the next support may well then be represented by the April 7th 2025 session low at 16290, possibly further, if this in turn gives way.
Possible Resistance Levels:
The 17404/17749 support range is still intact, and while this remains the case on a closing basis, attempts at price strength could still be seen. However, with the declining Bollinger mid-average currently at 18648 and having recently seen it reverse attempts at price strength, closing breaks above this level might be required to trigger a more extended phase of strength.
That said, as proved the case in early April, 19258, the 50% Fibonacci retracement level, may also now need to give way on a closing basis, to suggest further attempts to develop price strength towards higher resistance levels.
The material provided here has not been prepared in accordance with legal requirements designed to promote the independence of investment research and as such is considered to be a marketing communication. Whilst it is not subject to any prohibition on dealing ahead of the dissemination of investment research, we will not seek to take any advantage before providing it to our clients.
Pepperstone doesn’t represent that the material provided here is accurate, current or complete, and therefore shouldn’t be relied upon as such. The information, whether from a third party or not, isn’t to be considered as a recommendation; or an offer to buy or sell; or the solicitation of an offer to buy or sell any security, financial product or instrument; or to participate in any particular trading strategy. It does not take into account readers’ financial situation or investment objectives. We advise any readers of this content to seek their own advice. Without the approval of Pepperstone, reproduction or redistribution of this information isn’t permitted.

NAS100 BUY NOW!!!!!!!!!!Nas took out the buyside liquidity currently we looking at the price making a pull back or a retest to the buyside for a big rally up 19,107 is my target on nas am in on buy right now.....

NASDAQ Decision making becomes easy after seeing this chart.NASDAQ (NDX) is currently on the 3rd straight red month (1M candle), following the February High and subsequent sell-off due to the Trade War. This has been analyzed extensively in previous analyses and how the fundamental scene is only now starting to show some positive progress but still has a long way to go.
Technically though, the picture is very clear and favors long-term investing. The market has been trading within a Fibonacci Channel Up since the U.S. Housing Crisis in 2008 and along with the 2022 Inflation Crisis, those have been the only real Bear Cycle events in the past 18 years.
In between those there have been another 5 shorter term corrections, that offered great buying opportunities for the long-term and the recent 3-month one classifies as one.
There reasons are three. First it has come very close to the 1M MA50 (blue trend-line), which only broke during the Major Corrections. Second, the 1M RSI hit the 50.50 Symmetrical Support, which has held during all those 5 prior Minor Corrections. Third, those corrections only range between two Fibonacci levels.
The current correction fulfills all those conditions. And since the 'weakest' rally we've have on this 5 event sample has been +37.57% and the strongest +96.77%, we have a medium-term Target on Nasdaq at 22800 and a long-term one at 32500.
Do you still reserve doubts at investing long-term after seeing this macro chart?
-------------------------------------------------------------------------------
** Please LIKE 👍, FOLLOW ✅, SHARE 🙌 and COMMENT ✍ if you enjoy this idea! Also share your ideas and charts in the comments section below! This is best way to keep it relevant, support us, keep the content here free and allow the idea to reach as many people as possible. **
-------------------------------------------------------------------------------
💸💸💸💸💸💸
👇 👇 👇 👇 👇 👇

Choose your Side- i often compare TheKing with Nasdaq right now.
- Have a main reason :
- NAS100 (Nasdaq) have mostly "Top Tech Companies" acting as Thermometers in this index.
- SPX (SP500) have Tech Companies + traditional ones. Nasdaq Companies are also included in SPX, but 500 Companies start to be a lot.
- DJIA (Dow Jones Industrial Average) is a Mastodons, i don't use it much because this top 30 is too mixed ( coca cola, boeing, techs, big banks, nike.. etc).
- i mostly use very high TFs, i prefer look from far, less noise, more easy and less headaches.
- i use sometimes to trade with 1D, H12, H4 TFs but when we are bullish. In bearmarket, it's hard to find entries points in bearish mode.
- i don't short markets and accumulate more coins/tokens, so i just DCA, Dollar Cost Averaging is investing a fixed amount of money into a particular investment at regular intervals.
- so this chart is basically only about MACD :
- it's really interesting to see Nasdaq making another red columns in 3W TF, while the markets should recover slowly.
- if you take a look at BTC, columns stayed in Light Red Color and reducing size.
What could it means ?
- Keep in mind that BTC is not a STOCK.
- One of the most pivotal events on Bitcoin's blockchain is the halving, when the supply of new bitcoins is cut in half (2024).
- BTC have 21M Supplies and that's all. no more will be created.
- At any time BTC could stop to follow Nasdaq and do his way, TheKing used to do that before already.
- A small bounce in Nasdaq could be also a huge move for BTC.
- " Choose your side " and DCA the money you don't need for living.
Happy Tr4Ding !

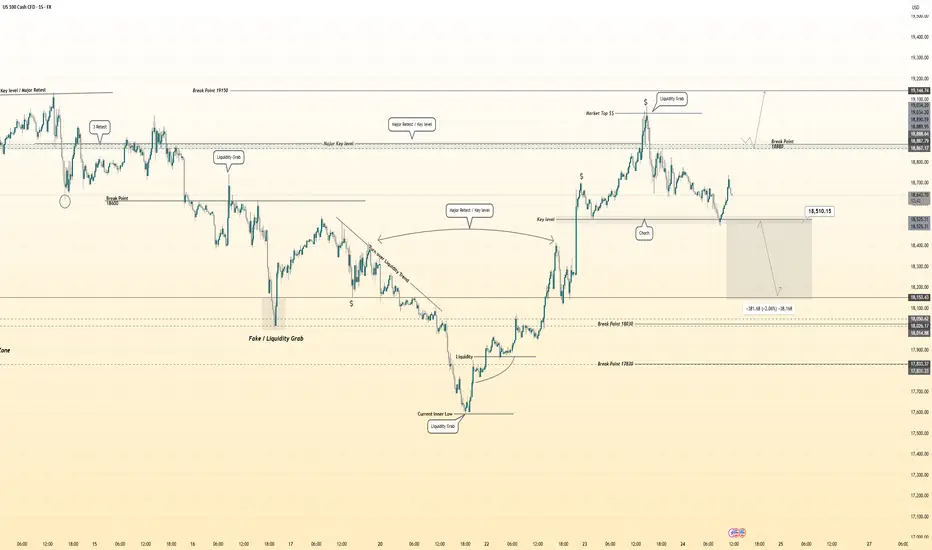
Hanzo | Nas100 15 min Breaks – Will Confirm the Next Move🆚 Nas100 – Hanzo’s Strike Setup
🔥 Timeframe: 15-Minute (15M)
——————
💯 Main Focus: Bullish Breakout at 18880
We are watching this zone closely.
💯 Main Focus: Bearish Breakout at 18510
We are watching this zone closely.
📌 If price breaks with high volume, it confirms Smart Money is in control, and a strong move may follow.
———
Analysis
👌 Market Signs (15M TF):
• Liquidity Grab + CHoCH at 19050
• Liquidity Grab + CHoCH at 18500
• Strong Rejections seen at:
➗ 18500 – Major support / Key level
➗ 18900 – Proven resistance
🩸 Key Zones to Watch:
• 18500 – 🔥 Bullish breakout level X 4 Swing Retest
• 18900 – Strong resistance (tested 6 times)
• 18500 – Equal lows
• 19050 – Equal highs
Hanzo | Nas100 15 min Breaks – Will Confirm the Next Move
Nasdaq - This Is Still Not The End Yet!Nasdaq ( TVC:NDQ ) cannot resist bearish pressure:
Click chart above to see the detailed analysis👆🏻
Over the past three months, we saw such a harsh correction on the Nasdaq that a lot of people are freaking out entirely. However technicals already told us that something feels wrong and this is the result. If we see another -10% from here, buying the dip will most likely pay off.
Levels to watch: $16.000
Keep your long term vision,
Philip (BasicTrading)

Current Analysis for NASDAQ I'm currently looking for short term sells for price to make a correction and fill the inefficiency. After that is completed, I'll be looking for Long term buys targeting the 19,233.9 level and afterwards I'll be targeting -27.0 percent level on the fibs.

Trade Update Based on NASDAQ PredictionsThis is an update on my trade idea that I posted a few hours ago for NASDAQ. Made over $6,912 on all positions!

QQQ FORECAST Q2 FY25: 13% RECOVERY APRIL FOOLSlike comment follow all the signals here are lit
comment your instrument below ill analyse it bonds crypto etf reits all dat paperwork
The recovery was swift exactly at our $16811 price level (great bargain) if you watched last call
now im calling bluff on this 90 day hype stop loss above entry targets set
there might be a bullish continuation by the mid point narrated by the path line
$17709 if confluence presents itself and necessary events present themselves im hopping out and longing these tariff games can go anyway in a heartbeat

Hanzo | Nas100 15 min Breaks – Will Confirm the Next Move🆚 Nas100 – Hanzo’s Strike Setup
🔥 Timeframe: 15-Minute (15M)
——————
💯 Main Focus: Bearish Breakout at 18700
We are watching this zone closely.
📌 If price breaks with high volume, it confirms Smart Money is in control, and a strong move may follow.
———
🔻 Every warrior needs a tribe.
Follow Hanzo. Support the path.
Analysis
👌 Bearish Signs (15M TF):
• Liquidity Grab + CHoCH at 18700
• Liquidity Grab + CHoCH at 18400
👌 The Market Has Spoken – Are You Ready to Strike?

STOCKS LOWER??This is what Im gauging on the NAS100, as well as the Dow Jones and SnP500 (even though the charts aren't presented).
Technically, I see a 4H QM which sets the high, with the lows not giving the same HTF strength that the highs have given. We've got a nice trading range as price hasn't realigned for the stocks to show its true bullish direction to the ATHs, meaning I see this huge sell off continue until those lows have been ran. I see price printing lower.
Fundamentally, I like to think of the worst case scenario for Trump and the season we're in currently, its made me nice trades. Lets see

Will Nasdaq Test Liquidity at 17,800 Before an Upside Move?NASDAQ is experiencing bearish slow down at the support level for the past 3 weeks. A re-test of the recent low looks imminent. and if price could be rejected after clearing H4 liquidity at 17,800, then we could see a sharp upside move.
Key risks: Fed commentary, major tech earnings, and geopolitical headlines.
N.B!
- NASDAQ price might not follow the drawn lines . Actual price movements may likely differ from the forecast.
- Let emotions and sentiments work for you
- ALWAYS Use Proper Risk Management In Your Trades
#nq!
#nasdaq

Correction and Before a Push The US 100 shows an ascending triangle pattern that has not yet reached its projected high.
Context of the Ascending Triangle:
The price has formed an ascending triangle with an ascending support line (lower blue line) from point 1 to point 2.
Horizontal resistance is at 18,842.3 (point 3), and the price has not broken this level in a sustained manner or reached 18,979.0, as incorrectly indicated earlier.
Currently, the price is at 18,861.3, but for this scenario, we will assume it is retracing from a level close to resistance without having reached 18,979.0.
Correction to 18,670:
The price could retrace toward the key support at 18,671.7 (near point 2), which coincides with the triangle's ascending trend line.
This level has previously been solid support, making it a likely point for a rebound.
Rebound to 18,980:
From 18,670, the price could initiate an upward movement toward 18,980, a level projected as a target after breaking the triangle's resistance at 18,842.3.
This target is calculated by measuring the height of the triangle and projecting it from the breakout point.
Volume:
Volume shows a peak in previous upward movements, but has decreased in the current pullback, which is typical in a correction.
An increase in volume near 18,670 could confirm the entry of buyers for the rebound.
Trading Strategy:
Entry: Buy at 18,670 after confirming a rebound (e.g., a bullish candle with increasing volume).
Stop Loss: Place a stop loss below 18,600 to protect against a bearish breakout.
Take Profit: Target 18,980.
Risk: If the price falls below 18,600, the bullish scenario could be invalidated, targeting lower levels such as 18,500.
TradingView Idea:
US 100 (15M) - Correction to 18,670 before rising to 18,980.
Direction: Bullish after correction.
Entry: 18,670 (after confirming a rebound).
Stop Loss: 18,600.
Take Profit: 18,980.
Risk/Reward Ratio: Approximately 3:1.

NSDQ100 INTRADAY resistance retest U.S. futures rose and the dollar strengthened after Donald Trump eased concerns that had been weighing on markets. He stated he has no plans to fire Fed Chair Jerome Powell, despite ongoing frustrations over interest rates. While this helped calm nerves, Bloomberg's John Authers cautions against viewing it as a major shift in sentiment.
Trump also struck a more conciliatory tone on China, saying he intends to be “very nice” in trade talks and suggested tariffs could be lowered if a deal is reached—indicating a possible softening of his approach toward Beijing.
Key Support and Resistance Levels
Resistance Level 1: 19195
Resistance Level 2: 19600
Resistance Level 3: 20080
Support Level 1: 17820
Support Level 2: 17330
Support Level 3: 16700
This communication is for informational purposes only and should not be viewed as any form of recommendation as to a particular course of action or as investment advice. It is not intended as an offer or solicitation for the purchase or sale of any financial instrument or as an official confirmation of any transaction. Opinions, estimates and assumptions expressed herein are made as of the date of this communication and are subject to change without notice. This communication has been prepared based upon information, including market prices, data and other information, believed to be reliable; however, Trade Nation does not warrant its completeness or accuracy. All market prices and market data contained in or attached to this communication are indicative and subject to change without notice.

NAS100USD: Reclaimed Order Block Signals Further DownsideGreetings Traders!
In today’s analysis of NAS100USD, we observe a momentary shift into bearish institutional order flow, confirmed by the formation of successive lower lows. This structural development signals the potential for continued downside movement.
Key Observations:
Bearish Institutional Order Flow:
The consistent break of lows supports a bearish bias, providing a framework for seeking short opportunities in alignment with institutional intent.
Confluent Bearish Arrays:
Key bearish arrays—including the mitigation block and a reclaimed order block—are currently aligned. These zones, if respected, could serve as strong resistance and provide high-probability entry areas for short positions.
Trading Strategy:
Should price retrace into these arrays and provide confirmation, we can look to enter sell positions with the expectation of further downside aligned with the prevailing order flow.
Stay disciplined, remain patient, and trade only with confirmation.
Kind Regards,
The Architect

My directional Bias for NASDAQ/USTECH/NAS100/NQAnd stated before in my previous post. This is my idea behind the direction of nasdaq for the next few days. I will be maintaining a bullish bias with an open mind to take advantage of short term sells to fill the inefficiency.

Quick technical piece on Nasdaq100From the technical side, we are near the short-term downside resistance line, which if broken, may open the door towards higher areas. But will it be enough?
Let's take a look.
MARKETSCOM:US100
Let us know what you think in the comments below.
Thank you.
77.3% of retail investor accounts lose money when trading CFDs with this provider. You should consider whether you understand how CFDs work and whether you can afford to take the high risk of losing your money. Past performance is not necessarily indicative of future results. The value of investments may fall as well as rise and the investor may not get back the amount initially invested. This content is not intended for nor applicable to residents of the UK. Cryptocurrency CFDs and spread bets are restricted in the UK for all retail clients.
