NAS100USD: Bearish Continuation Likely After Liquidity GrabGreetings Traders!
As we transition into the New York session, increased market volatility is expected. Currently, NAS100USD is showing signs of potential further bearish continuation. This outlook is supported by a draw on liquidity toward downside liquidity pools and a notable inefficiency—an unfilled gap left earlier in the week.
Key Observations:
1. Unfilled Gap – A Draw on Liquidity:
The market has left behind an inefficiency in the form of a price gap, which typically acts as a magnet for price. Although such inefficiencies are not always filled immediately, they often become targets for future price movement as the market seeks balance.
2. Reclaimed Order Block Breach – Engineered Liquidity:
Price has recently broken below a reclaimed order block that was serving as a temporary resistance zone. This indicates that the market was hunting for liquidity at a relatively premium price—above a key resistance level. The presence of relatively equal highs in this area further supports the notion that this was an engineered liquidity zone.
Engineered liquidity refers to zones designed by smart money to entice retail participation. Once sufficient liquidity is gathered, institutions then drive price through these zones to execute large sell orders at a premium.
3. Downside Targets – Liquidity Pools and Gaps:
With resistance now confirmed as engineered liquidity, smart money is likely to shift focus to the downside. Key targets include liquidity pools at lower price levels and the aforementioned inefficiency, which represents an area of fair value—ideal for profit-taking and potential continuation of institutional selling.
Trading Strategy:
Monitor price for confirmation within any short-term retracements. Selling opportunities aligned with institutional intent may present themselves as price gravitates toward the inefficiency and deeper liquidity zones.
Stay focused, remain patient, and ensure all trades align with your trading plan.
Kind Regards,
The Architect
NAS100 trade ideas

WHERE TO GO....NDXGood Morning,
I entered a trade with QQQ yesterday as the market has signaled a strong movement for the bulls. By no means is this a confirmed moved however I saw an opportunity for early entry.
We still need to beat out the overall trend reversal resistance which is at the 19,700 mark of April 2th.
Prior to that we need to make it through:
18,400$ First resistance.
19,000 2nd Resistance.
Trend is showing that we will break both of those levels.
Enjoy!

NASDAQ-100 (NDX) daily analysis by TradingDONAlright, folks: here’s my take on today’s 15‑minute CAPITALCOM:US100 action—Buckle up.📈
**When the Market Faked Us Out**
I was watching price flirt with a fresh high up around 18,500–18,550, but it couldn’t stick. You know that moment: the rally teases you into thinking bulls have taken over, then promptly rolls over. I marked the false higher‑high with a tiny red “X” on my chart—classic stop‑hunt before the reversal. In plain English: institutions swept buy stops, then handed off into those get‑rich‑quick hopes.
**Key Zones:**
- **Premium (18,800+):** Smart money sells here—price always stalls or dumps.
- **Discount (18,000–18,100):** Institutions buy the dip—bounces here carry weight.
**FVGs & Stop‑Hunt:**
I’ve got Fair Value Gaps around 17,600–17,750 that act like magnets on a pullback. The drop to 17,562.6 was a classic sell‑side stop hunt before the big reversal.
- Distribution hit the Premium zone.
- Accumulation’s brewing in the Discount zone + FVGs.
- That sweep of 17,562.6 was classic smart‑money stop‑hunt + scoop.
- 💡My long at ~17,880 sits at a neat support confluence—so, for now, I’m leaning bullish to the next structural level.
*This is my educational breakdown of ICT concepts—not trading advice. Do your own homework and manage risk.*

Technical Breakdown on US100 Cash CFD | 1H Timeframe1. Key Observations (Volume, Gann & CVD + ADX Focused)
a) Volume Profile Insights:
Value Area High (VAH): 18,758.52
Value Area Low (VAL): Approx. 18,259.03
Point of Control (POC):
Recent Session POC: 18,758.52
Previous Session POC: 18,259.03
High-volume nodes: Clustered around 18,600–18,750 – area of high interest and possible re-accumulation.
Low-volume gaps: Below 18,300 – could act as fast-move zones on breakdown.
b) Liquidity Zones:
Stop Clusters:
Above 18,800 (recent swing high).
Below 18,250 (previous swing low).
Absorption Zones (Delta Volume Focus):
Strong absorption around 18,580–18,600; price has consolidated here indicating order filling.
c) Volume-Based Swing Highs/Lows:
High-volume swing low: 18,259.03 (POC) – strong buying response seen post drop.
High-volume swing high: 18,758.52 – rejection seen here on low follow-through.
d) CVD + ADX Indicator Analysis:
Trend Direction: Currently Range-bound (CVD not showing clear accumulation/distribution trend).
ADX Strength:
ADX ≈ 18–20: Suggests weakening trend; possible sideways movement.
DI+ ≈ DI-: Confirms indecision.
CVD Confirmation:
CVD flattening at resistance suggests equal pressure from buyers and sellers.
No strong rising or falling trend in CVD; supports ranging bias.
2. Support & Resistance Levels
a) Volume-Based Levels:
Support:
VAL: 18,259.03
Previous swing low/absorption: 18,300
Resistance:
VAH: 18,758.52
Rejection level: 18,800
b) Gann-Based Levels:
Confirmed Gann Lows: 18,259
Key Retracement Levels:
1/3 retrace from recent high: ~18,430
1/2 retrace: ~18,500
2/3 retrace: ~18,580
3. Chart Patterns & Market Structure
a) Trend:
Range-bound (confirmed by ADX near 20 and mixed CVD).
b) Notable Patterns:
Bearish rejection at VAH zone.
Potential descending channel forming from highs.
Fake-out above 18,750 followed by rejection – possible liquidity grab.
4. Trade Setup & Risk Management
a) Bullish Entry (If CVD + ADX confirm uptrend):
Entry Zone: Near 18,300–18,350 (absorption + VAL zone)
Targets:
T1: 18,580
T2: 18,750
Stop-Loss: Below 18,250
RR: Minimum 1:2
b) Bearish Entry (If CVD + ADX confirm downtrend):
Entry Zone: Near 18,750–18,800 (rejection area)
Target:
T1: 18,300
Stop-Loss: Above 18,850
RR: Minimum 1:2
c) Position Sizing:
Risk 1–2% of total capital per trade for optimal drawdown management.

NASDAQ MEGA BOUNCE ZONEI want to see a super bounce from this demand zone tomorrow due to the recent reactions around this price level. Lots of interest being shown here. I am sized in pretty heftily on MNQ futures. In a $0 or HERO position. WIll be closing my laptop now...

Nasdaq 100 Prepares for Launch — Reclaiming Critical GroundNAS100 8H TECHNICAL ANALYSIS 💻🧠
OVERALL TREND
📈 UPTREND — Structure is shifting bullish. Recent higher lows and strong rebounds from April lows confirm the current upward momentum. This is supported by 12/13 Moving Averages flashing BUY , including critical 50- and 200-period EMAs/SMA clusters. MACD and Momentum indicators also favor continued upside.
🔴 RESISTANCE ZONES
22,248.00 — 🔴 SELL STOPLOSS | Final Pivot High
21,955.77 — 🔴 SELL ORDER 2
21,364.19 — 🔴 SELL ORDER 1
🎯 TARGETS & BUY ORDERS
21,065.42 — 🎯 TP4 | EXIT THE RALLY
19,989.54 — 🎯 TP3 | Momentum confirmation
19,291.55 — 🎯 TP2 | Mid Pivot Zone
18,286.55 — 🎯 TP1 | Initial Profit Target
17,258.99 — ✅ BUY ORDER 1
16,630.74 — ✅ BUY ORDER 2
16,335.10 — ✅ BUY STOPLOSS | Pivot Low
🟢 SUPPORT STRUCTURE
PIVOT LOW @ 18,286 — Support holding for now
PIVOT LOW @ 17,258 — Strong confluence with previous structure
BUY ORDER zones between 16,330 – 17,258 — Demand cluster for reversals
🤓 STRUCTURAL NOTES
MACD shows bullish divergence with a rising histogram and crossover confirmation Momentum (+694) and RSI (66.69) suggest strength, though nearing overbought territory Price has reclaimed 10, 20, 50, 100, and 200 MA levels — rare alignment of major trend confirmation
Only outlier: Hull MA (9) signaling short-term overextension — may suggest brief consolidation before continuation
🌍 GLOBAL TECHNICAL SUMMARY
📊 12 of 13 Major Moving Averages = BUY
📈 MACD & Momentum Oscillators = BUY
🧭 Majority of Oscillators = Neutral — supporting a “calm before breakout” thesis ⚖️ CCI shows slight overbought = caution near resistance zones
📉 No major bearish divergence detected — trend remains intact
TRADE OUTLOOK 🔎
📈 Bullish Bias above 18,286.55 (TP1) targeting 19,291.55 (TP2) and beyond
📉 Bearish rejection likely near 21,065+ if volume fades — monitor RSI/MACD
👀 Watch for volume confirmation as we approach 19,989.55
🧪 STRATEGY RECOMMENDATION
CONSERVATIVE BREAKOUT ENTRY:
— Entry: 18,286.55
— TP Levels: 19,291.55 / 19,989.55 / 21,065.42
— SL: Below 17,258.99
RISK-ON DIP BUY STRATEGY:
— Buy Zone: 16,630 – 17,258
— TP: 18,286.55 / 19,291.55
— SL: Below 16,335.10
“Discipline | Consistency | PAY-tience”

Bullish Breakout on NAS100 – Momentum ShiftingNASDAQ 100 (US100) – Bullish Setup Developing
1. Falling Wedge Breakout:
Price has broken out of the falling wedge (purple trendlines), signaling a potential reversal to the upside.
2. Retesting Breakout Zone:
Current price action is retesting the breakout level near the 18,000 zone, indicating potential support forming.
3. Trendline Confluence:
The breakout aligns with the lower boundary of the broader ascending channel (blue), acting as dynamic support.
4. Strong Bullish Rejection at Lows:
Price showed strong buying interest near 17,700, forming a bullish rejection wick and bounce.
5. Clean Target Ahead:
Next key resistance zone lies around 18,540, where price may face selling pressure again – this matches previous structure and descending channel resistance.
6.Momentum Shift Noted:
Lower highs and lower lows structure has been invalidated, hinting at a possible trend shift.
Thanks for your Time..

NAS100 - Will the stock market go bullish?!The index is trading below the EMA200 and EMA50 on the four-hour timeframe and is trading in its descending channel. If the index moves down towards the specified demand zone, one can look for the next Nasdaq long positions with a good risk-reward ratio.
Economists remain divided over whether President Donald Trump’s tariff policies are weakening the economy enough to trigger a recession. Some believe the possibility of a recession is significant, citing the rising costs of tariffs that are burdening both businesses and consumers. Others argue that the U.S. economy is strong enough to weather the trade war without falling into recession, pointing to resilient employment levels and consumer spending.
Forecasting experts also express differing views regarding the risk that Trump’s tariff campaign could tip the economy into a downturn. A Wall Street Journal survey conducted in April among 57 economists revealed that, on average, participants estimated a 45% chance of a recession occurring within the next 12 months—up from just 20% in the January survey.
The economic outlook took a notable downturn in February, when Trump began announcing tariffs against key U.S. trading partners. Many forecasters, who had expected a “soft landing” from post-pandemic inflation, are now preparing for a possible recession, as these tariffs and other economic barriers are forcing both households and businesses to tighten spending.
A separate survey of financial professionals working with businesses found that many companies have recently faced greater difficulty in collecting payments from clients, indicating growing financial strain among key economic players. The Credit Managers’ Index, overseen by the National Association of Credit Management and monitored by economist Chris Kuehl, still showed growth in March, though at a slower pace than before.
On the more optimistic side is Allen Sinai from Decision Economics, who assigns only a 20% probability to a recession within the next year. Although this is an increase from his January estimate of 10%, he still considers it an unlikely scenario.
Sinai’s primary reason for optimism is the strength of the labor market, which has remained stable since recovering from the massive layoffs during the COVID-19 lockdowns. March’s unemployment rate was 4.2%—close to historic lows—and not indicative of an economy in recession.
One major point of disagreement between recession pessimists and optimists lies in the interpretation of consumer sentiment data. Surveys have shown that people are increasingly worried about inflation, the job market, and their personal finances. If such concerns lead to more cautious consumer spending, it could weigh heavily on the overall economy.
The upcoming week is expected to begin quietly in terms of economic data releases, particularly due to global markets being closed on Monday in observance of Easter. However, midweek brings key reports that could significantly influence market expectations. On Wednesday, the preliminary S&P Global composite purchasing managers’ index for April and March new home sales figures are due. Thursday will feature a packed slate of indicators, including durable goods orders, jobless claims, existing home sales, and the final reading of the University of Michigan’s consumer sentiment index.
Alongside the data releases, investors will closely monitor remarks from Federal Reserve officials. Following Jerome Powell’s firm stance last week, upcoming speeches by Kashkari, Goolsbee, and Harker could shape or reinforce market expectations regarding the Fed’s future policy path.
Meanwhile, Apple is grappling with mounting challenges in the global marketplace. In China, the company has lost a significant portion of its market share, with sales declining by 9%, while Huawei’s sales have grown by 10%, and Xiaomi now holds the top spot with an 18.6% market share. These shifts reflect a notable pivot in Chinese consumer preferences toward domestic brands. Furthermore, U.S.-imposed tariffs on Chinese goods have put additional pressure on Apple’s profit margins in its home market, placing the company in a tough position.

FOR SCAPLER THATS A SHORT USTECHThemakert is showing a rejection on that trendline so wait in 1 Hour if that candlestic closes a revesal candlestic GO Short to cover The Gap

Hanzo | Nas100 15 min Breaks – Will Confirm the Next Move🆚 Nas100 – Hanzo’s Strike Setup
🔥 Timeframe: 15-Minute (15M)
———————
💯 Main Focus: Bullish Breakout at 18030
We are watching this zone closely.
📌 If price breaks with high volume, it confirms Smart Money is in control, and a strong move may follow.
💯 Main Focus: Bearish Breakout at 17830
We are watching this zone closely.
📌 If price breaks with high volume, it confirms Smart Money is in control, and a strong move may follow.
———
🔻 Every warrior needs a tribe.
Follow Hanzo. Support the path.
Analysis
👌 Bearish Signs (15M TF):
• Liquidity Grab + CHoCH at 18700
• Liquidity Grab + CHoCH at 18400
• Strong Rejections seen at:
➗ 18400 – Major support
➗ 19000 – Proven resistance
———
🩸 Key Zones to Watch:
• 18700 – Bearish breakout level
• 19130 – Strong resistance (tested 6 times)
• 18400 – Equal lows
Hanzo | Nas100 15 min Breaks – Will Confirm the Next Move


Nasdaq Big Move (Trump Tariff Pause Effect)yesterday S&P 500 did biggest reversal move since 2008,
its bullish sign for use stock, therefor smart money expecting to buy again ,
there for we are expecting sharp move on CPI event, where smart money will buy with big order for log next 90 days

Downtrend looks to be continuing with a new lower highAre we targeting a new lower low? Time will tell, but with every passing day the true nature of a sitting president full of hot air comes to light. The words that are spewed will have less and less gravity on the markets until his words are put out onto deaf ears and the markets can get back to a functioning state. When you hear a liar speak the first time you don't know the words are lies, but eventually you just stop listening to the nonsense because it all seems like lies after. Either way the words hold little punch. Shock and Shock is the ploy, I guess? I'm not shocked any longer and maybe the markets will get it too eventually.

TECH STOCKS ON SCHEDULE TO RALLYWith the Tariff shocks well behind us, tech companies are looking extremely cheap at current prices. Price sustaining a close above 16,994.8 further confirms this

What is ICT Order Block and How to Trade it
👉🏻 ICT order block is basically an area on the price chart which indicates the huge institutional orders and signals the strong reversal or continuation of price.
You can use the order block as a confirmation of your trade entry or for the reversal of price.
In this article, we will teach you all about order block trading strategy from definition to its identification and to use along with examples.
You can jump to the part of this guide, you are most interested in or you can continue reading the whole article :
Table of Contents 👇🏻
1 : What is ICT Order Block?
2 : Types of Order Block
3 : Bullish Order Block
4 : Bearish Order Block
5 : Bullish Order Block Trading Strategy
6 : Bearish Order Block Trading Strategy
7 : Final Thoughts
What is ICT Order Block? ⚡️
ICT Order block is the area in the price chart, where a large number of orders are executed by institutional traders in the market and market shows sudden strong move from that area.
Retail traders follow institutional foot prints, so they wait for these order block zones to buy or sell in the market & make profit along with big institutions like banks.
You can see the example of order blocks in the picture given below :
Types of Order Block
As you know market has two price moves bullish & bearish. So on the basis of price moves, order block is divided into two types.
(I) Bullish Order Block
(II) Bearish Order Block
Bullish Order Block
A bullish order block is the last bearish candle before the bullish impulse (strong sudden) move, it typically consist of two candles, with the first candlestick being a bearish and the second candlestick being a bullish one.
How to Identify a Bullish Order Block? ⚡️
To identify a valid bullish order block you need to check following things.
(I) Second candle being a bullish candle, should grab the low of previous bearish candle. Price should go below the low of previous bearish candle.
(II) Second candle being a Bullish candle should close above the high of previous bearish candle.
(III) Imbalance in lower time frame in the order block zone.
(IV) Structure shift in lower timeframe.
To sum it up we can say, second candle should completely engulf the first candle – body to body & wick to wick.
You can see the example of bullish order block in the picture below :
Bearish Order Block ⚡️
A bearish order block is the last bullish candle before the bearish impulse move, it typically consist of two candles, with the first candlestick being a bullish and the second candlestick being a bearish one.
How to Identify a Bearish Order Block? ⚡️
To identify a valid bearish order block you need to check following things.
(I) Second candle being a bearish candle, should grab the high of previous bullish candle. Price should go above the high of previous bearish candle.
(II) Second candle being a bearish candle should close below the low of previous bullish candle.
(III) Imbalance in lower timeframe in the order block zone.
(IV) ICT Market Structure Shift in lower timeframe.
To sum it up we can say second candle should completely engulf the first candle – body to body & wick to wick.
You can see the example of bearish order block in the picture below :
Bullish Order Block Trading Strategy ⚡️
In bullish order block trading strategy you would look for shift of price delivery from bearish to bullish and then execute a buy trade utilizing a bullish order block.
When the trend is bearish and it approaches a demand zone where you would seek reversal of price and at that area price shifts its structure to the buy-side.
Then you will be looking for the order block at the bottom of the impulse move which changed market trend.
When you find the bullish order block in that move, it means it was a move involving institutions so you need to wait for the price to test the bullish order block zone to execute a buy trade.
When price retraces back and tests the bullish order block zone you can execute a buy trade as shown in the picture below :
When tradin bullish Order block trading strategy your stop loss will be 10/20 pips below the low of order block zone.
Bearish Order Block Trading Strategy ⚡️
In bearish order block trading strategy you would be looking for the shift of trend from bullish to bearish and then execute a sell trade utilizing a bearish order block.
When market trend is bullish and it approaches a supply zone where you seek reversal of price and at that area price shifts its structure to the sell-side.
Then you would look for the order block at the bottom of the impulse move which changed price trend.
When you find a bearish order block in that move it means it was a move involving institutions so you need to wait for the price to test the bearish order block zone to execute a sell trade.
When price retrace back and tests the bearish order block zone you can execute a sell trade.
A real market example of bearish order block trading strategy is shown below in the picture.
Final Thoughts⚡️
When trading using bearish Order block trading strategy our stop loss will be 10/20 pips above the high of order block zone.
Order blocks can also be found in a trend after a pull back and these order blocks confirm the strength of trend. We can use these order blocks to trade the trend or to add new positions in the trend.
Like in a bearish trend after a bullish pullback a bearish order block may form, which confirms the strength of bearish trend and we can add a new sell order to enjoy the bearish trend.
Likewise in a bullish trend after a bearish pullback a bullish Order block may form which confirms the strength of bullish trend and we can add a new buy order to enjoy the bullish trend ❤️ .

NAS100USD: Bearish Bias Expected to Hold After RetracementGreetings Traders!
In today’s analysis of NAS100USD, we maintain a bearish outlook despite short-term bullish movements in price action. These bullish signs appear to be corrective and in alignment with institutional objectives to rebalance inefficiencies created during yesterday’s sharp decline.
KEY OBSERVATIONS:
1. Inefficiency Rebalancing Completed:
Price has retraced to fill fair value gaps left behind by recent downside volatility. With those inefficiencies now rebalanced, we anticipate a continuation of the dominant bearish institutional order flow.
2. Buy Stops Taken – Institutional Order Pairing:
The sweep of buy stops confirms liquidity collection for institutional sell-side positioning. This aligns with a classic distribution phase, where institutions utilize buy-side liquidity to enter short positions.
3. Institutional Resistance – Rejection Block:
Price is currently reacting at a key institutional resistance zone, known as the rejection block. This zone, formed prior to the latest downside move, may act as the final area of resistance before renewed bearish continuation.
TRADING PLAN:
Entry Consideration:
Monitor price behavior at the rejection block. Upon confirmation, this area offers a high-probability setup for short entries.
Profit Targets:
Focus on targeting liquidity pools resting at deeper discount levels. These areas represent logical destinations for price based on institutional order flow dynamics.
Remain diligent and patient in your execution. Let the market confirm the direction before committing to a position.
Kind Regards,
The Architect

Nasdaq-100 H4 | Potential bearish reversalThe Nasdaq-100 (NAS100) could rise towards an overlap resistance and potentially reverse off this level to drop lower.
Sell entry is at 18,144.20 which is an overlap resistance.
Stop loss is at 18,800.00 which is a level that sits above an overlap resistance.
Take profit is at 16,779.34 which is a swing-low support.
High Risk Investment Warning
Trading Forex/CFDs on margin carries a high level of risk and may not be suitable for all investors. Leverage can work against you.
Stratos Markets Limited (tradu.com):
CFDs are complex instruments and come with a high risk of losing money rapidly due to leverage. 63% of retail investor accounts lose money when trading CFDs with this provider. You should consider whether you understand how CFDs work and whether you can afford to take the high risk of losing your money.
Stratos Europe Ltd (tradu.com):
CFDs are complex instruments and come with a high risk of losing money rapidly due to leverage. 63% of retail investor accounts lose money when trading CFDs with this provider. You should consider whether you understand how CFDs work and whether you can afford to take the high risk of losing your money.
Stratos Global LLC (tradu.com):
Losses can exceed deposits.
Please be advised that the information presented on TradingView is provided to Tradu (‘Company’, ‘we’) by a third-party provider (‘TFA Global Pte Ltd’). Please be reminded that you are solely responsible for the trading decisions on your account. There is a very high degree of risk involved in trading. Any information and/or content is intended entirely for research, educational and informational purposes only and does not constitute investment or consultation advice or investment strategy. The information is not tailored to the investment needs of any specific person and therefore does not involve a consideration of any of the investment objectives, financial situation or needs of any viewer that may receive it. Kindly also note that past performance is not a reliable indicator of future results. Actual results may differ materially from those anticipated in forward-looking or past performance statements. We assume no liability as to the accuracy or completeness of any of the information and/or content provided herein and the Company cannot be held responsible for any omission, mistake nor for any loss or damage including without limitation to any loss of profit which may arise from reliance on any information supplied by TFA Global Pte Ltd.
The speaker(s) is neither an employee, agent nor representative of Tradu and is therefore acting independently. The opinions given are their own, constitute general market commentary, and do not constitute the opinion or advice of Tradu or any form of personal or investment advice. Tradu neither endorses nor guarantees offerings of third-party speakers, nor is Tradu responsible for the content, veracity or opinions of third-party speakers, presenters or participants.

today igot 1:650 RR trade in #nas100today igot 1:650 RR trade in #nas1004ht pd aray
and
15min aray
and
1 min entry

NQ/US100/NAS100 Short - Day Trades 1:2 RRRisking 1% to make 2%
NAS100, US100, NQ, NASDAQ short for day trade, with my back testing of this strategy, it hits multiple possible take profits, manage your position accordingly.
Risking 1% to make 2%
Use proper risk management
Looks like good trade.
Lets monitor.
Use proper risk management.
Disclaimer: only idea, not advice

Definite downward trend. Great buying potential in near future.Hello all traders and learner charters. As you can see definite downward trend.
Some are even saying sell everything.
I added the five year percentages, as you can see its not very promising for the moment,
but definitely promising for anyone wanting to get into nasdaq or SP500.
There are seldom opportunities like this.
I would suggest to keep watching it, as a lot of people who rode the bull market after
Trump call, have taken there profits and sold. This trend will force others to sell as no one
wants to make a loss on nasdaq. So with that in mind, it will be red all over for a while I would say about two weeks maybe even more, but if you just keep on buying little amounts
DCA dollar cost averaging, you will get some good buying positions down low. And then hold them for the next few years. This is a great opportunity. Good luck.

Hanzo | Nas100 15 min Breaks – Will Confirm the Next Move🆚 Nas100 – Hanzo’s Strike Setup
🔥 Timeframe: 15-Minute (15M)
———————
💯 Main Focus: Bullish Breakout at 18160
We are watching this zone closely.
📌 If price breaks with high volume, it confirms Smart Money is in control, and a strong move may follow.
💯 Main Focus: Bearish Breakout at 18000
We are watching this zone closely.
📌 If price breaks with high volume, it confirms Smart Money is in control, and a strong move may follow.
———
🔻 Every warrior needs a tribe.
Follow Hanzo. Support the path.
Analysis
👌 Bearish Signs (15M TF):
• Liquidity Grab + CHoCH at 18700
• Liquidity Grab + CHoCH at 18400
• Strong Rejections seen at:
➗ 18400 – Major support
➗ 19000 – Proven resistance
———
🩸 Key Zones to Watch:
• 18700 – Bearish breakout level
• 19130 – Strong resistance (tested 6 times)
• 18400 – Equal lows

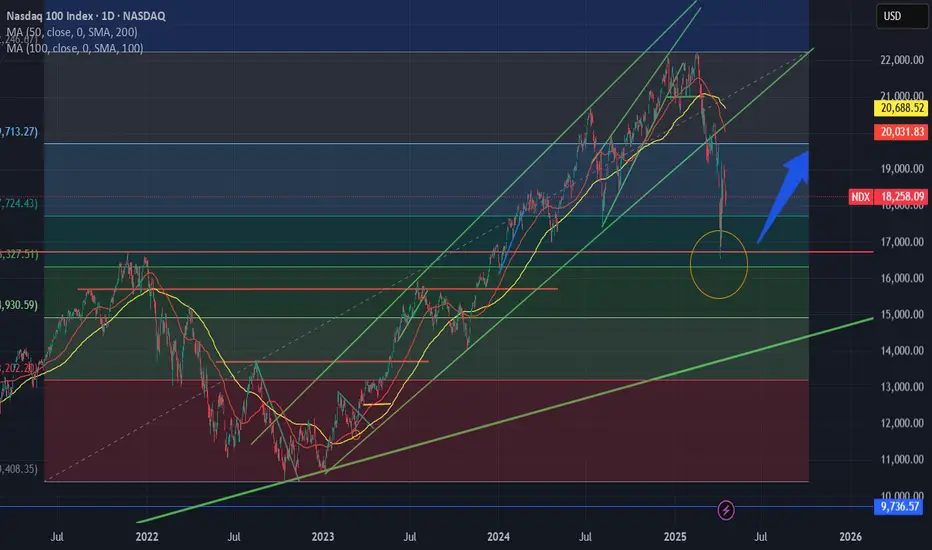
Long - assuming nothing else blows upThe recent drop seems to be due by policy that is still ambiguous and evolving, good chance trade war dies down when deals are made. other than that, NDX bounced off a previous high and has momentum to at least revert to the ma
NAS100USD: Bearish Momentum Likely to Extend in NY SessionGreetings Traders!
At present, NAS100USD continues to reflect clear bearish institutional order flow. This is evidenced by the consistent formation of lower lows and the way bearish arrays—such as fair value gaps and order blocks—continue to hold as effective resistance zones.
Key Observations:
Sustained Bearish Structure:
The market has maintained a downward trajectory, with each rally being absorbed by bearish arrays. This behavior reinforces the dominance of institutional selling pressure.
High Volatility Window – New York Session:
With the New York session now underway, heightened volatility is expected. This presents a favorable environment for bearish continuation trades, particularly if price respects the key supply zones.
Trading Strategy:
Entry Consideration:
I am awaiting a retracement into a key bearish array—either a fair value gap or a bearish order block. Upon confirmation of rejection from these zones, I will seek to enter short positions.
Profit Targets:
The primary objective will be to target liquidity pools residing at lower discount levels. These areas represent external liquidity where institutional participants are likely to complete order execution.
By aligning with the prevailing bearish institutional narrative and waiting for high-probability confirmations within premium zones, we can strategically position ourselves to benefit from further downside momentum during this high-impact session.
Kind Regards,
The Architect
