Nasdaq analysis: 17-APRIL-2025Good morning, traders! Today's Nasdaq analysis will help you achieve your trading goals. Let's work together towards success.
NAS100 trade ideas

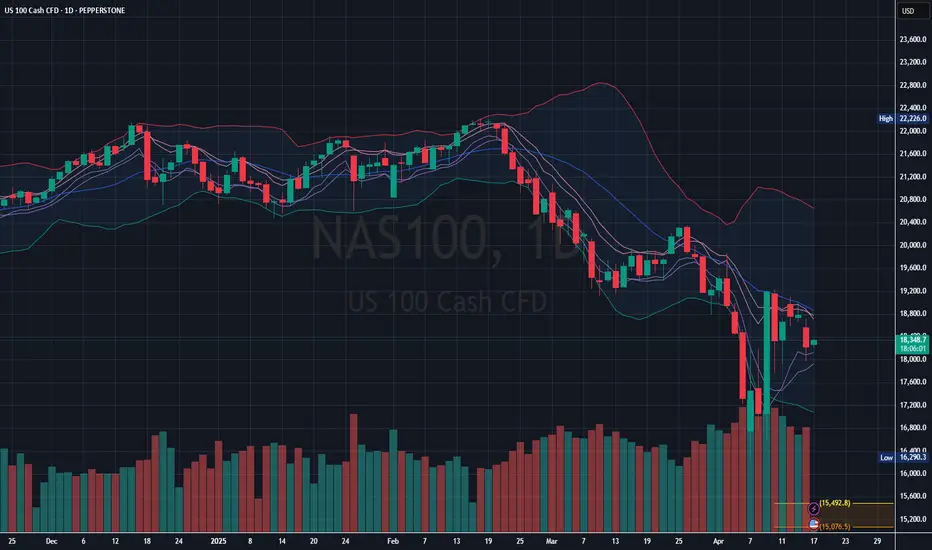
Oversold but Not Safe – NAS100 Bears Still in Control
Currently trading below the 20-day SMA (middle of Bollinger Bands), indicating bearish momentum.
Support zone: ~17,600 (recent lows and high volume area)
Resistance zone: ~18,800–19,200 (middle Bollinger Band & recent highs)
Failure to break above 18,800 and another test of 17,600 could lead to continuation downward, possibly toward 17,000–16,800.
Nasdaq Avoiding all necessary setbacks today,let me just look at it until it gives me what i understand

US100 shortThis should be a little piece of what will happen this week in my opinion!
Ofc no financial advice!!! ;) <3

NASDAQ Potential DownsidesHey Traders, in today's trading session we are monitoring NAS100 for a selling opportunity around 19200 zone, NASDAQ is trading in a downtrend and currently is in a correction phase in which it is approaching the trend at 19200 support and resistance area.
Trade safe, Joe.

Incoming fall and riseNasdaq is struggling to move past the 19200 and 19000 barriers, and this may lead to a bearish correction aiming for 17,886 and 17,333 support. If price action does fall, the 17k region will be the likely barrier, which may spearhead the bullish continuation targeting 19,700 and 20,200.
Currently, price action is rising from 18,500, trying to reach 19,200 and 19,000. As long as price action is under the 19k zone, the bearish correction may likely occur. Failure to fall and finding strength above the 19k barriers, the indice may continue its upward trajectory!

NSDQ100 INTRADAY resistance retest Tech stocks tumbled after the U.S. announced new restrictions on Nvidia chip exports to China and ASML posted weaker-than-expected results, sparking renewed trade war fears. The selloff wiped out $155 billion in market value between the two companies.
Meanwhile, China is holding off on trade talks, wanting the U.S. to take certain steps first—like toning down harsh rhetoric from officials—according to a source familiar with Beijing’s stance.
U.S. stock futures trimmed losses after that China news but still point to a lower open due to the tech slump. The dollar slid to a six-month low, while investors moved into safe havens, gold hit a record high and the Swiss franc gained.
Key Support and Resistance Levels
Resistance Level 1: 19200
Resistance Level 2: 19550
Resistance Level 3: 19870
Support Level 1: 17250
Support Level 2: 16773
Support Level 3: 16300
This communication is for informational purposes only and should not be viewed as any form of recommendation as to a particular course of action or as investment advice. It is not intended as an offer or solicitation for the purchase or sale of any financial instrument or as an official confirmation of any transaction. Opinions, estimates and assumptions expressed herein are made as of the date of this communication and are subject to change without notice. This communication has been prepared based upon information, including market prices, data and other information, believed to be reliable; however, Trade Nation does not warrant its completeness or accuracy. All market prices and market data contained in or attached to this communication are indicative and subject to change without notice.

Exclusive Analysis: Key Reversal Zones & Time Targets for NAS100Dear Trader,
I’m excited to share my latest analysis of $Subject with you! This report uses advanced mathematical strategies to pinpoint potential market reversals—both in price and timing—to help you trade smarter.
What’s Inside?
✅ Price Targets: Clear horizontal lines mark key support/resistance levels (north/south targets).
✅ Timing Tools: Vertical lines highlight potential reversal times (UTC+4 time zone) with +/- 1-2 candle accuracy.
✅ Actionable Tips: Monitor the 5M/15M charts for high-probability reversal signals like:
Doji
Double Top/Bottom
Bullish/Bearish Engulfing
Hammer/Inverted Hammer
Morning/Evening Star
Shooting Star
Triple Top/Bottom
Want to Level Up?
Join Shunya Trade’s Mentoring Program to master these strategies and sharpen your technical analysis skills.
Your Feedback Matters!
Let me know how this analysis works for you—your insights will shape future reports!
Let’s navigate the markets together—wisely and proactively.
Best regards,
Shunya Trade
Stay Connected for More:
👉 Follow me on TradingView “shoonya0000” for daily charts, tips, and live market updates.
On the chart numbers are printed those are for Reversal of Time
328, 391, 400, 463, 424, 472, 535, 295, 520, 319, 544
And these are Key price levels
Bear. Bull
18694.55 18733.46
18679.82 18748.22
18645.66 18782.46
18577.45 18851.05
18509.36 18919.76
18441.40 18988.60
18373.56 19057.56
18305.85 19126.65
18238.27 19195.86
18170.80 19265.20
17902.21 19543.79
17635.61 19824.39
17371.01 20106.99
17108.41 20391.59
16847.81 20678.19
16589.21 20966.79
16332.62 21257.38
16078.02 21549.98
⚠️ Disclaimer: This post is educational content and does not constitute investment advice, financial advice, or trading recommendations. The views expressed here are based on technical analysis and are shared solely for informational purposes. The stock market is subject to risks, including capital loss, and readers should exercise due diligence before investing. We do not take responsibility for decisions made based on this content. Consult a certified financial advisor for personalized guidance.

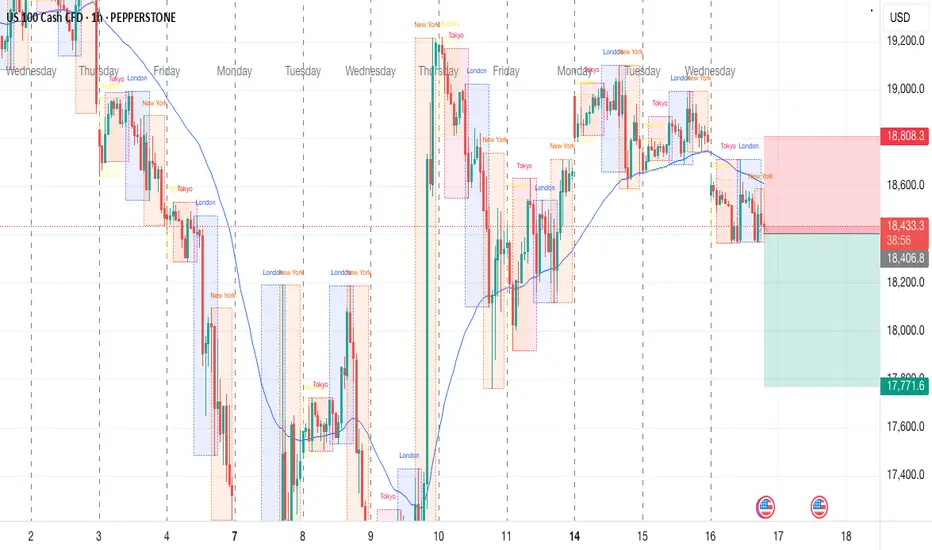
US100 Technical Analysis by TradingDONHere’s the CAPITALCOM:US100 lowdown: That “bullish reversal??” tag’s throwing up a question mark because nothing’s set in stone yet—if the market holds above the 18,400 sweep low and starts pushing past recent swing highs around 18,650–18,700, especially knocking off that short label near 18,700, it could kickstart a short-term bullish turn; but if it rallies into that 18,700 zone and then stalls or flips, we’re still in bearish territory, with a likely retest of the 18,400 level or even a deeper dive to snag more liquidity.

Hanzo | Nas100 15 min Breaks – Will Confirm the Next Move🆚 Nas100
The Path of Precision – Hanzo’s Market Strike
🔥 Key Levels & Breakout Strategy – 15M TF
🔥 Deep market insight – no random moves, only calculated execution.
☄️ Bullish Setup After Break Out – 19150 Zone
Price must break liquidity with high volume to confirm the move.
☄️ Bearish Setup After Break Out – 18600 Zone
Price must break liquidity with high volume to confirm the move.
🩸 15M Time Frame Confluence
————
CHoCH & Liquidity Grab @ 19200
Key Level / Equal lows Formation - 18820
Strong Rejection from 19300 – The Ultimate Pivot
Strong Rejection from 17800 – The Ultimate Pivot
Strong Rejection from 19100 – The Ultimate Pivot
🔥 1H Time Frame Confirmation
Twin Wicks @ 18820 – Liquidity Engineered
Twin Wicks @ 18500 – Liquidity Engineered
Twin Wicks @ 17800 zone – Liquidity Engineered
☄️ 4H Historical Market Memory
——
💯 18 jan 2024 – Bearish Retest 16900
💯 11 jan 2024 – Bearish Retest 16900
💯 18 jan 2024 – Bullish Run After Break That level

US100 - Lots of opportunities unfoldingChart Overview:
This analysis focuses on the US 100 (NAS100) index, sourced from CAPITAL.COM . The chart highlights critical price levels, Fair Value Gaps (FVGs) , and a Buy side liquidity (BSL) , offering actionable insights for traders.
Key Observations:
1. Price Action & Structure:
- The index has shown significant volatility, with a clear Break of Structure (BSL) indicating a potential shift in market sentiment.
- The price is currently navigating between key support and resistance zones , marked by horizontal levels.
2. Fair Value Gaps (FVGs):
- Two prominent FVGs are visible on the chart, representing areas where price may revisit to fill imbalances. These zones often act as magnet levels for price retracements.
- Traders should monitor these FVGs for potential entry or exit opportunities , depending on price reaction.
3. Critical Price Levels:
- Resistance Zones:
- 20,250.0 : A major psychological barrier.
- 19,750.0 - 20,000.0 : Intermediate resistance cluster.
- Support Zones:
- 17,000.0 - 17,250.0 : Strong historical support.
- 16,000.0 : A pivotal level for long-term bias.
Trading Strategy:
- Bullish Scenario: A break above 20,250.0 could signal further upside, targeting 20,500.0 and beyond.
- Bearish Scenario: A drop below 17,000.0 may confirm a deeper correction, with 16,250.0 - 16,000.0 as the next target.
- FVGs as Confluences: Use the identified FVGs alongside volume and momentum indicators to refine entries.
Timeframe & Validity:
This analysis is based on the daily timeframe (Apr 19, 2025) and remains valid until key levels are breached or new structures form.
Final Notes:
Always pair this analysis with risk management (stop-loss, position sizing) and confirm with additional indicators (RSI, MACD, volume). The market may fill FVGs before continuing its trend.
Like, follow, and comment if you found this useful! Happy trading!

Nasdaq insights: 16-APRIL-2025Good morning, traders! As a seasoned price action trader, I'll share my Nasdaq insights to help you improve your trading skills.

Nas100 Buyside Rally Towards target is Pending.Nasdaq is looking to target the buyside and it will rally soon within a 2 days and it will target it faster than anything

NASDAQ Heading to 14K – WXY Correction UnderwayUS100 (NASDAQ) Technical Analysis
📆 Daily Chart (1D)
🧭 Updated: April 15, 2025
🟠 General Context and Structure
The price reached a high of 22,236.5, completing an ascending wedge (orange lines), which was broken down with strong volume and bearish momentum, signaling a change in the larger structure.
After the collapse from that high, the index formed what appears to be a W wave within a complex corrective structure (WXY), completing in the 16,176.3–16,992.2 range.
🌀 Elliott Wave Structure (Projection)
We are currently seeing the development of the upward corrective wave X, which appears to be structuring as a 5-wave impulse:
(1) and (2) already completed
Projection of (3), (4), and (5) with a target in the 21,025.9 area
After this upward movement, the start of a downward correction (a)-(b)-(c) is expected, which would complete the bearish wave Y of the broader WXY pattern.
🔍 Key Support and Resistance Zones
🔴 Major resistance: 22,239 – 22,236.5 (Highs and strong rejection zone)
⚪ Intermediate resistance: 20,356.6 and 21,025.9 (Potential targets for wave X)
⚪ Intermediate support: 18,523 (Zone where wave (4) could form)
🟢 Strong support:
16,992.2 and 16,176.3 (base of wave W)
14,054.4 (potential target for wave Y, critical point)
12,719.4 (extreme extension if the decline intensifies)
📉 Movement Projection
Current bullish reaction remains impulsive → wave (3) is underway.
Possible extension to 21,025.9 before a reversal.
Drop in 3 waves (a)-(b)-(c) towards:
🎯 First bearish target: 16,176
🎯 Second (final) target: approximately 14,580 (area marked as the end of wave Y)
⚠️ Conclusion / Trading Idea
We are seeing a complex WXY-type correction developing. The most likely scenario suggests a bullish continuation towards 21,025 to complete wave X, followed by a sharp drop towards the 14,580 area.
📌 Possible trading plan:
Swing long to 21,025 if the momentum is confirmed.
Strong short from that area, looking for targets towards 16,000 – 14,580 in the coming months.
🧭 Risk Management
Stop loss above the all-time high of 22,236.5 for short positions.
Bearish confirmation after reversal structure at 21k.

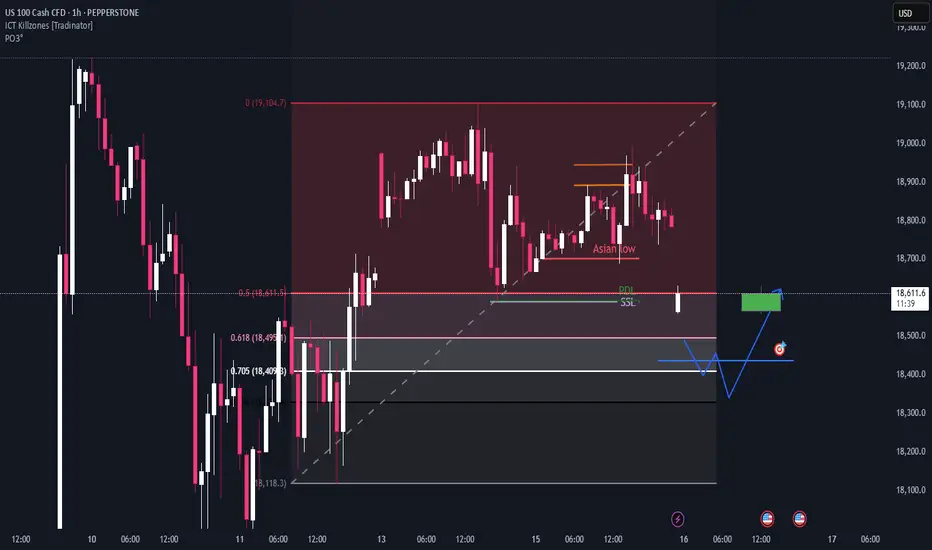
NAS100 Liquidity Trade Analysis 4hr and 1hr Time FrameNasDaq100 is currently in consolidation zone on 1hr levels of $19,035 resistance and $18,633 support zone. We traded of the 1hr tf with break of resistance at $18,630 this was our indication of bullish momentum, waited for correction to retouch our resistance line and took buys off the continuation of bullish momentum.

NASDAQ 16/04/2025 opening on this gap will drop more to the first target from yesterday
as u see the trade was respectfully just gave us confirmation from the orange line up and went down thankfully the target was the PDL ( previous daily low ) and well done open in target today
the next move probably will be lower in the target line and u must to wait confirmation over there no entry pls i gave u the zone where the market should react and u have to be patience and wait confirmation to buy and then good luck
any questions feel free to ask
<3

NASDAQ H9 IdeaPotential for a bullish pullback on the NASDAQ H9 which could lead to a price movement towards the resistance level at 20100. BUY levels from 18550

UNCONFIRMED VIEW - NDXGood Morning Everyone,
Hope all is well. NDX is looking toppy throughout the last week. Lets break it down.
We had a nice strong bullish movement April 7th. This led to a bloom in the market and some nice green rallies. We have only had "1" confirmed support throughout this rally and "1" confirmed resistance.
We have a double top that has formed, you can see this in the two yellow circles. The trend itself is starting to top out on RSI & volume is decreasing. This is all signalling that a path down to find a new support is coming.
Right now I hold 0 of anything. I sold my portfolio this morning and am waiting for re-entry. Yes this was a bit early as I have not confirmed a 2nd resistance however I am playing safe right now.
Enjoy!

Daily Price Action: Nasdaq NDX Tuesday 4/15/2025In this video, we are looking into the potential daily price action of NDX.

NAS100 BUY 4 HOUR TIME FRAMEStrong Demand Zone
Multiple Rejections at the zone
Price has to fill the gaps to the left
3:1 Risk Reward
Let’s See:)

