TA and BIAS for; PERPJUSDT*Assessment:* EXPANDING TRIANGLE (REVERSAL TYPE)
This technical analysis is powered by FIGO TRADER® - The pinnacle of trade
NB:
For best results, ENTRY should be executed at the breakout of chart pattern.
PERPUSDT trade ideas

PERP, look very nice for huge profit. BINANCE:PERPUSDT.P
It was so hot. Look at its nice chart. It currently has a small bounce from its trendline and from fib 768.
With a tight stoploss , I think this will be a good setup. You can enter now or wait it retest the trendline to go in.
Enjoy! Moon it!!!
Do your own risk management.
Follow me for more chart analysis.
Patience is the key to success.
DYOR

BUY SOME $PERP here📈 $PERP, after a recent 2.5x split following a strong surge, is now consolidating with a market cap of $40M.
$PERP It’s almost enough after grinding. The current price is 0.6, and the profit-loss ratio is pretty good.
$PERP Adding some here maybe we will see a upside soon if #BTC remain Stable once we break this trendline expecting a upside move

Perpertual Protocol/Theter A Rreaction or new gain.All of us, or very many crypto investors, were surprised by the rapid increase a few days ago. Having reached the apex, I currently see something more than a reaction to increase something. Currently at x5 leverage 50-75% profit. However, I assume a retest. Let's see where it goes. Currently only the zones are drawn, I will try to interpret this more precisely when the first profit is achieved. I don't expect any sales in this first zone, it will probably pick up strongly over the weekend. Don't forget SL. To do this, use the last low 1h candle and add 1% security
Reversal Pattern or Continue PatternChart 1H TF
I figure out two chart patterns for now
#1. Reversal Pattern which is Inverse Head Shoulders
#2. Continue Pattern which is Triangle Pattern
I more likely PERP will happen Continue Pattern
If down, PERP has support around 0.54
If up, PERP has resistance around 0.69
Wait and see what happen

PERPUSDT ABSOLUTE BOTTOM : BUY SIGNALBeen tracking this coin and it's just hit the end of its retracement.
This is a gem. Go long at current price point : $0.60
BTW, THIS MARKS THE START OF THE BULLRUN.

PERPUSDTPERPUSDT is in bearish trend currently market moving sideways for a little time.
No sign of trend reversal from here.
We wait for the breakout fo last LL.
If it breaks last LL then trend will definately continue.

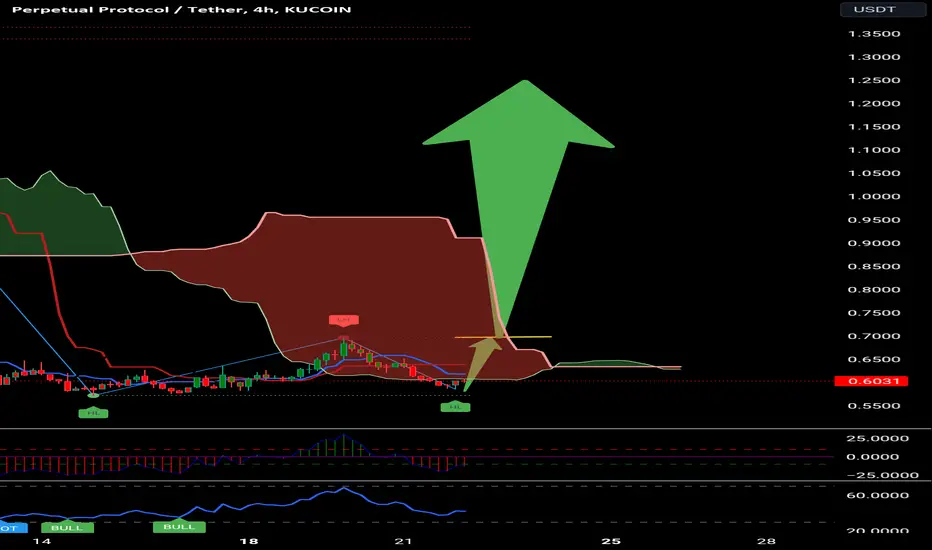
PERP, bargaIn sale: Ready again for a generous rebound!Perp after touching an impressive peak at 1.4, is currently solidifying its new base.
It is showing some price-shifting moves on the 4H and metrics are suggesting a generous rebound from the current range as notable accumulation has been detected.
The coin touched 61.8 fib level and currently bouncing off it with precision.
Expect some more than average upside volatility from the present price levels.
Spotted at 0.660
TAYOR.
Safeguard funds always.

Brief Analysis——PERP (Recap)Last week we conducted a brief analysis on PERP and introduced the WTA indicator. In the past few days, although the project has not released any news, PERP's trading volume is still high and its price fluctuates greatly. So the brief analysis today will provide a recap of PERP and WTA indicators.
After the brief analysis was released last week, PERP continued to pump, reaching a new high, 1.3, almost three times the level before the rise. Starting from last Saturday, the bears gradually increased, a long red candle appeared, and the price turned downward. Although the bulls tried to attack during the decline, the rebound was eventually covered.
Combined with WTA indicators:
·In the early stages of the rise(the first green rectangle), there are obvious blue and red columns, which indicate that the whale may be continuing to buy.
·In the second green rectangle, although the whales are still involved, the lengths of the blue and red columns have been reduced. There is a divergence between the indicator and the price trend. This is not good.
·Close to the first red rectangle, the price begins its third wave of pump and reaches new highs. But there are almost no whales participating in the WTA indicators. The whales may have gradually take profits and close the long position at this stage. And after reaching the high, a long red candle appear and whale participation increases on the way down. This confirms that the whales continued to take profits during this stage.
·In the last red rectangle, we can see that although PERP has rebounded, the whale has almost disappeared, only retail investors are trading. The price continues to fall.
In the process of PERP turning from rising to falling, we see that the WTA indicator presents a complete cycle. It allows the normal trader to see more clearly what the whales are doing.
Disclaimer: Nothing in the script constitutes investment advice. The script objectively expounded the market situation and should not be construed as an offer to sell or an invitation to buy any cryptocurrencies.
Any decisions made based on the information contained in the script are your sole responsibility. Any investments made or to be made shall be with your independent analyses based on your financial situation and objectives.

🆘#PERP N-type structure was broken, and RSI diverged.DUMP!🧠The first is the divergence of the RSI indicator, which shows that most investors are leaving the market at a profit.
But we cannot open short positions based on this yet, because the uptrend is not over yet.
But when we see the N-shaped uptrend broken, we are convinced here that the downside is coming, so we set up a short position✔️
➡️Now we intend to lock in more than 80% of the profits and move SL to breakeven.

WHY PERP COIN PRICE CRASH !! PERP COIN POSSIBLE TRADE SETUPS!!$PERP Coin Update and Possible Trade setups Near me !!
• Manipulation by whales is high under this token.. Don't use upto 10% fund if you take trade on it.
FOLLOW US FOR MORE FREE ANALYSIS

PERPUSDT bullish ride?💎🐂 PERP Today Analysis💎 It's primed for an impressive move as it has nicely tapped the Order Block (OB) and initiated a bullish surge.
💎 Upon deep analysis, we notice that the previous demand turned into supply, causing a downward price movement. The presence of liquidity is the driving force behind this move.
💎 The first bounce saw a price rejection, but the second bounce was weaker despite the rejection, leading to a downward move.
💎 Given the clear imbalance, liquidity, and bearish OB above, we expect the price to reach this level to mitigate this OB.
💎 In the dynamic world of crypto, staying informed and adaptable is key. Stay tuned for more updates and enjoy your trading journey

perp short we have another extended third wave with divergence between wave 3 and 5. moreover it is just on the weekly resistance zone . so I set a short position here which has a small stoploss and can have a precious profit.
this is just an idea that I share with you , act just on your mind and researchs

WHP PERP COIN PRICE PUMP TOO MUCH?? PURP COIN ANALYSIS!!CRYPTOCAP_OLD:PERP Coin Analysis !!
• RSI Creat Tripple Top on 4h chart & major indicators look overbought on 1D & 4h Chart . ( Bearish sign )
• Currently Price moving Know in a bullish trend.
• There is a two possible trade setups...👇👇👇
1st
Price touch its monthly resistance area 1.38$-1.43$ and then we see drop in its price. ( but this deos not meat my trading strategy wining chances 60/40 )
2nd
Price reach on its new expected H.H Then we see health Correction .. ( REASON :- Current long positions on exchanges is more then shorts so exchanges possible do manipulation ... Instant pump rekt shorters and then big drop rekt longs )
FOLLOW ME FOR MORE ANALYSIS

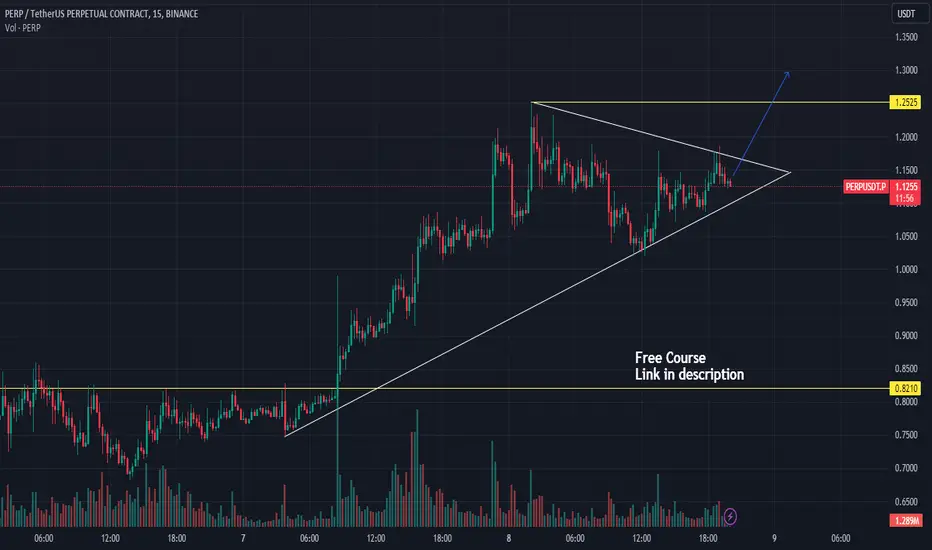
PERP hs bullish triangleUpward structure, growth and consolidation on increased volumes, which statistically indicates the strength of the buyer. At the moment, a local downtrend has been formed, which I am considering for scrapping and further movement into the long, as well as the price is being squeezed near the round number of $ 1.15.
PERP at resistancePERP is at weekly resistance within 1.25-1.38 region.. taking some short trades from 0.125 region and stop loss above 1.5 region
do your own analysis and research
if you are a leverage trader, wait for smaller time frame breakout

PERPUSDT To The Moon🌙 Profit: 254.55% ✅🚀#PERPUSDT
BoooooooM 🚀🚀 BoooooooM 🚀🚀
All Targets: done✅
Entry price: 0.4925$✅
Price reached : 1.2537$ ✅
Profit: 254.55% ✅🚀🚀🤑
💰 Insane Profits Await: The recent market fluctuations have opened doors to astonishing gains.on Binance Spot, you have the potential to rake in profits like never before!

PERP/USDT Potential Rejection, Downward Momentum ?? Yello Paradisers, PERP Analysis: Potential Rejection in Bearish OB Area
💎 PERP recently experienced a significant price surge of over 100%, breaking through supply levels with ease.
💎 However, it faced rejection after hitting the Bearish Order Block (OB). Today, PERP is in a consolidation phase in lower timeframes, which suggests that it may either resume testing the Bearish OB area or experience a sharp drop back to the demand zone around $0.6.
💎 It's worth noting that many low-cap coins have exhibited similar patterns in the past, where they pump significantly and then experience sharp declines in the following days.
💎 Invalidation Scenario: This analysis will be invalidated if PERP breaks the Bearish Invalidation level and closes daily above it.

Perp Buy Trade Here is My Study On ANKR.
Welcome to my channel! Here you'll find daily technical analysis ofthe latest trends in the crypto market. From Bitcoin to altcoins, I'lIl be sharing my insights and predictions to help you make informed decisions
about your investments. Follow me for the latest updates and join the conversation in the comments!
Crypto technical analysis uses past price history to predict future price. It's not a guarantee and shouldn't be relied on solely for investment decisions. Consider other factors such as market trends, economic strength and
information dissemination. Use with caution.
This Is Not A Finacial Advise

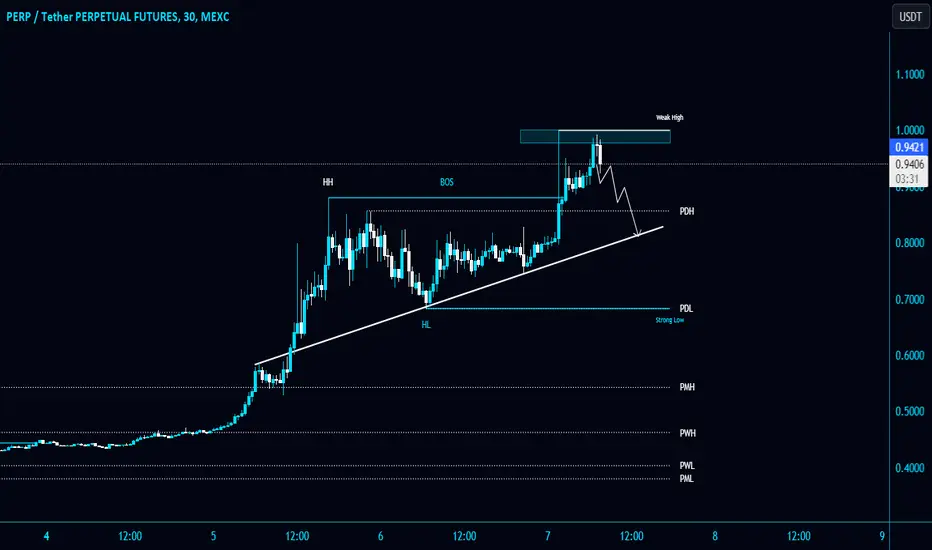
perp analysis (30M TF)It looks like this uptrend is an ascending diametric and it started from where I put the green arrow
I expect the rest of the waves of this diametric to be completed in this way.
In rsi, we are below the resistance line and forming a bearish qm.
Do not enter the position without capital management and stop setting.
This coin is small and has its own risks.

Opening a Short Scalp on #PERP/USDT in 30-Minut TF!Opening a Short Scalp on #PERP/USDT in 30-Minut TF!
Risking only 1%.
Expecting Trendline retest soon.
Brief Analysis——PERPRecently, the sentiment of market has been flat, and the movements of most tokens are mainly fluctuating. But there are some Alt-coins that pump during this period. In the past 24 hours, PERP has risen by nearly 60%, becoming one of the hottest tokens in the market. So today we choose PERP as the token for brief analysis.
The project of PERP is a derivative DEX on the OP mainnet. Among the numerous derivatives DEX, the TVL of PERP is not outstanding. The liquidity provision method of PERP adopts the Uni V3 model. There is no major news about PERP in the market recently.
PERP has basically maintained a wide range of fluctuations from 0.36 to 1.20 in the past year. Starting in March, price fluctuated down to near lows. The price had an obvious pump yesterday, and judging from the PERP history, there were almost no green candles of such length and high trading volume. The bulls is strong on the daily level.
Switching to the 1h level, we can see that after PERP reached 0.85, the bears increased, and the gains of the green candle was quickly covered by the red candle. Price remained fluctuating at the top. At this level, the gap between bulls and bears is not that big. Price may remain fluctuating.
What is more interesting is that we can see that in this round of rise, the WTA indicator shows there are a lot of whales involved in the transactions. In the past, when PERP increased and WTA showed increased whale participation, the price continued to rise, but then the price began to fall back after whale participation decreased. Therefore, this time the PERP rise may not end immediately. If "the whales disappeared into the gray ocean," then you need to be careful if they have quietly departed.
Disclaimer: Nothing in the script constitutes investment advice. The script objectively expounded the market situation and should not be construed as an offer to sell or an invitation to buy any cryptocurrencies.
Any decisions made based on the information contained in the script are your sole responsibility. Any investments made or to be made shall be with your independent analyses based on your financial situation and objectives.

Perp Sell TradeHere is My Study On Perp
Welcome to my channel! Here you'll find daily technical analysis ofthe latest trends in the crypto market. From Bitcoin to altcoins, I'lIl be sharing my insights and predictions to help you make informed decisions
about your investments. Follow me for the latest updates and join the conversation in the comments!
Crypto technical analysis uses past price history to predict future price. It's not a guarantee and shouldn't be relied on solely for investment decisions. Consider other factors such as market trends, economic strength and
information dissemination. Use with caution.
This Is Not A Finacial Advise
