PHA Bounce from Historical Support ZonePHA is showing signs of a potential bullish reversal after bouncing off a long-standing support zone. Price has consistently respected this support level since mid-2022, creating a strong base. Now, we’re seeing bullish momentum building as the weekly candle breaks above the 50-week EMA, which had acted as dynamic resistance in the past.
A break above the recent swing high could trigger a larger move toward the $0.25–$0.35 resistance area. As long as the support zone remains intact, the structure remains bullish.
Cheers
Hexa
PHAUSDT trade ideas

PHAUSDT 1D#PHA has formed a symmetrical triangle on the daily chart. It is currently trading above the Ichimoku Cloud and the daily SMA100, which is a strong bullish sign. In case of a breakout above the triangle resistance, the targets are:
🎯 $0.1454
🎯 $0.1642
🎯 $0.1890
🎯 $0.2242
⚠️ Always use a tight stop-loss and practice proper risk management.

LONG PHA NOWPHA ~ 1W Analysis
#PHA Buy back on retest of this support block with short term target of at least 20%+ from this support.
ENTRY : < $0.11
TP 1 : $0.5
TP 2 : $1

PHAUSDT 1W AnalysisPHA ~ 1W Analysis
#PHA Buy back on retest of this support block with short term target of at least 20%+ from this support.
PHA/USDTKey Level Zone: 0.13800 - 0.14100
HMT v8.1 detected. The setup looks promising, supported by a previous upward/downward trend with increasing volume and momentum, presenting an excellent reward-to-risk opportunity.
HMT (High Momentum Trending):
HMT is based on trend, momentum, volume, and market structure across multiple timeframes. It highlights setups with strong potential for upward movement and higher rewards.
Whenever I spot a signal for my own trading, I’ll share it. Please note that conducting a comprehensive analysis on a single timeframe chart can be quite challenging and sometimes confusing. I appreciate your understanding of the effort involved.
Important Note :
Role of Key Levels:
- These zones are critical for analyzing price trends. If the key level zone holds, the price may continue trending in the expected direction. However, momentum may increase or decrease based on subsequent patterns.
- Breakouts: If the key level zone breaks, it signals a stop-out. For reversal traders, this presents an opportunity to consider switching direction, as the price often retests these zones, which may act as strong support-turned-resistance (or vice versa).
My Trading Rules
Risk Management
- Maximum risk per trade: 2.5%.
- Leverage: 5x.
Exit Strategy
Profit-Taking:
- Sell at least 70% on the 3rd wave up (LTF Wave 5).
- Typically, sell 50% during a high-volume spike.
- Adjust stop-loss to breakeven once the trade achieves a 1.5:1 reward-to-risk ratio.
- If the market shows signs of losing momentum or divergence, ill will exit at breakeven.
The market is highly dynamic and constantly changing. HMT signals and target profit (TP) levels are based on the current price and movement, but market conditions can shift instantly, so it is crucial to remain adaptable and follow the market's movement.
If you find this signal/analysis meaningful, kindly like and share it.
Thank you for your support~
Sharing this with love!
HMT v2.0:
- Major update to the Momentum indicator
- Reduced false signals from inaccurate momentum detection
- New screener with improved accuracy and fewer signals
HMT v3.0:
- Added liquidity factor to enhance trend continuation
- Improved potential for momentum-based plays
- Increased winning probability by reducing entries during peaks
HMT v3.1:
- Enhanced entry confirmation for improved reward-to-risk ratios
HMT v4.0:
- Incorporated buying and selling pressure in lower timeframes to enhance the probability of trending moves while optimizing entry timing and scaling
HMT v4.1:
- Enhanced take-profit (TP) target by incorporating market structure analysis
HMT v5 :
Date: 23/01/2025
- Refined wave analysis for trending conditions
- Incorporated lower timeframe (LTF) momentum to strengthen trend reliability
- Re-aligned and re-balanced entry conditions for improved accuracy
HMT v6 :
Date : 15/02/2025
- Integrated strong accumulation activity into in-depth wave analysis
HMT v7 :
Date : 20/03/2025
- Refined wave analysis along with accumulation and market sentiment
HMT v8 :
Date : 16/04/2025
- Fully restructured strategy logic
HMT v8.1 :
Date : 18/04/2025
- Refined Take Profit (TP) logic to be more conservative for improved win consistency

PHAUSDT Forming a Bullish Flag PatternPHAUSDT is currently displaying a classic bullish flag pattern on the daily chart, which is often considered a strong continuation signal in technical analysis. After a sharp upward move, the price has entered a consolidation phase within a descending channel—forming the "flag" portion of the pattern. With good volume backing the previous rally, this consolidation suggests that the bulls are simply taking a breather before the next leg higher. A breakout above the upper boundary of the flag could potentially trigger a 40% to 50% gain in the coming sessions.
From a market sentiment standpoint, PHA is gaining increased traction among crypto investors due to its underlying fundamentals and the growing use case of privacy-preserving technologies. As part of the Phala Network, which focuses on decentralized cloud computing with built-in privacy, the token has positioned itself well in the Web3 and privacy niche. This unique narrative is attracting more attention, and it reflects in the technical setup that's ripe for a breakout.
Traders should closely monitor the breakout zone near the flag's resistance. If PHAUSDT pushes through with strong volume confirmation, it could mark the beginning of a new bullish wave. Price action, along with volume spikes, RSI crossover, and MACD bullish alignment, further support this scenario. The potential risk-to-reward ratio favors strategic long entries for both swing traders and mid-term investors.
This pattern is a compelling opportunity for those looking to capitalize on breakout moves in trending altcoins. If market conditions remain favorable, PHAUSDT could easily exceed expectations, offering a solid gain for those positioned early.
✅ Show your support by hitting the like button and
✅ Leaving a comment below! (What is You opinion about this Coin)
Your feedback and engagement keep me inspired to share more insightful market analysis with you!


$PHA Buy ideaif it breaks 0.124 levels, we might see 3x from there.
add it to your watch list and monitor.

PHA Multi-Timeframe Setup – Reversal in Progress?🚨 PHA Update Across Weekly & Daily Charts!
🧱 Weekly Chart: Price recently bounced from a strong support zone, showing signs of a potential reversal from this critical level.
📈 Daily TF: After breaking out of a falling wedge, PHA is now trending within an ascending parallel channel—a bullish continuation pattern.
⚡ Key Level to Watch: A breakout above 0.13 could confirm upside momentum and trigger the next leg up! 🚀
👀 Clean structure and growing buyer interest—keep this one on your radar!

PHAUSDT 1D AnalysisPHA ~ 1D Analysis
#PHA Buy when re -testing this support block with a short -term target of at least 10%+ from here.

PHA USDTHere is a good and simple setup for PHA. Prioritize preserve your capital and avoid over expectation. It's been awhile since the last I posted. Many invalid calls in my profile. Crypto market moved unexpected to the downside and I was unable to anticipate. All market got liquidated. Cheers to those who still in the game.

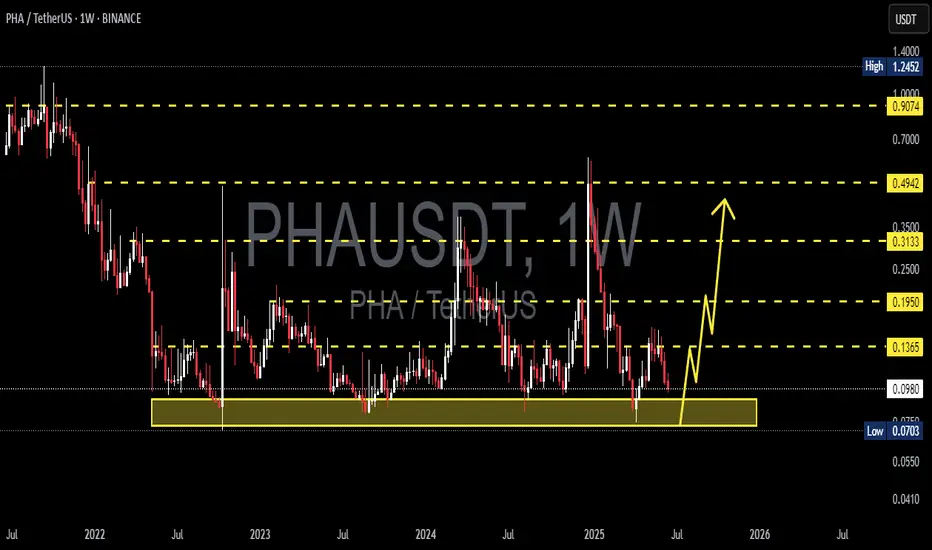
Phala Network 2,400% Profits Potential Target & 2025 Bull MarketThe steepest decline ever for Phala Network just happened between late December '24 and April 2025. This was a really strong correction and broke two long-term support levels, August 2024 and August 2023, just to recover the next week.
This drop activated the market's All-Time Low. A price that was hit once only in October 2022. This same support level was activated only briefly with a higher low. The low back then happened at 0.0700 and the higher low this month at 0.0753. Buyers were ready almost at the lowest possible point. A long-term double bottom.
The last time this low price was hit the reaction was a super strong rise. PHAUSDT rose more than 600% the same week that it produced its All-Time Low. The high produced was only challenged again in December 2024, it broke by 10 cents. Back then the peak happened at 0.5000 (October 2022), in December 2024 the peak happened at 0.6000. This small difference makes a huge difference for the upcoming bull market bull-run, it is good news.
Another positive signal for this pair comes from the session close. Back in October 2022, the session that hit 0.5000 on a wick ended up closing at 0.2148. This time, the December 2024 peak at 0.6000 ended up with a close at 0.4919, a huge difference, more than 100%. This is a signal of strength and good news for the upcoming bull market.
The bulls were testing the waters and removing a very strong resistance point. This was a success. The market went through a full flush and is ready to grow again. Phala Network can hit a new All-Time High this year based on these simple signals, so be prepared.
An entry now and a long-term hold can produce a nice and easy 300% in the coming weeks or months. By late 2025, profits can amount to 1,350% or even 2,400%, all these targets can be seen mapped on the chart.
This is another good pair. The chart looks strong and the action went through a full reset. Bottom prices are present today. A huge discount. The best possible timing. This is your chance.
Thank you for reading.
Namaste.

PHAUSDT 1WPHA ~ 1W Analysis
#PHA Buy back gradually from here with a short -term target of at least 20%+.
This is the lowest support for now.

PHALA : Bullish Momentum can be here soon...Very likely to sweep the low into the OTE + VAL. It will be the ideal scenario though.
LTF structure shift after the sweep of low and I'll be a buyer.

PHAUSDT 1WPHA ~ 1W Analysis
#PHA Buy gradually from here if you still have a Conviction on this Coin. with a short -term target of at least 20%+.

Long Entry Signal for PHA/USDT - Trading System ConfirmationBased on our custom trading system rules, we have a confirmed entry signal for PHA/USDT today:
MLR Crosses SMA: The Moving Regression Line (MLR) has crossed above the Simple Moving Average (SMA), indicating a shift towards a bullish trend.
MLR Crosses BB Center Line: The MLR has also crossed over the Bollinger Bands Center Line, further confirming the bullish momentum.
PSAR Flips: The Parabolic SAR (PSAR) has flipped, signaling a bullish trend as it follows the MLR.
Price Above 200-period MA: The current price is above the 200-period Moving Average, confirming a long-term bullish trend.
Entry Strategy:
Action: Enter a long position on PHA/USDT based on these signals.
Risk Management:
Trailing Stop: Immediately set your trailing stop at the current PSAR level, which will adjust dynamically with price movements.
Standard Exit Strategy:
Exit: Monitor for when the MLR crosses back below the SMA. This crossover will signal a potential end to the bullish trend and an opportunity to exit the position.
This signal presents a potential trading opportunity according to our system's parameters. Remember, always consider additional analysis and risk management practices before making trading decisions.
That is it
Disclaimer: This idea is for educational purposes only and should not be considered financial advice. Always do your own research or consult with a financial advisor before trading.

Phala (PHA/USDT) Bullish Setup on the 1H Chart - Zoom outPhala (PHA) is currently showing a promising bullish setup on the 1-hour chart. The price has been moving within an ascending channel recently, with clear signs of bullish momentum. Here are the key points indicating a potential rise:
If the bullish scenario plays out, traders could set profit targets around $0.30and $0.40. To manage risk, stop-loss orders can be placed below the rising support line or the most recent low, depending on individual risk tolerance.

PHA will move in buying zone between 1.7 and1.3 before aiming .6PHA will move in buying zone between 1.7 and1.3 before aiming .6

PHA is moving our buying Range usr only 5% of your capital
good risk / reward
Good project of AI AGENT

PHAUSDTWe can attempt to buy PHAUSDT from specified level as it makes HL , also 0.618 FIB level intact indicate that it moves upward.
SL , TP mention in chart.

PHA USDT💰 PSE:PHA (Phala Network)
Phala Network (#PHA) is breaking out of a falling wedge pattern, a classic bullish reversal signal. The rounded bottom structure further supports the upward momentum 🚀.
The breakout indicates strong potential for continued upside, supported by the rounded trajectory on the chart 🔥.
🎯 Target 1: $0.5500
🎯 Target 2: $0.7000

trading using consolidation strategytrying out a consolidation strategy,taking keen look at upper and lower bolinger bands to implement this strategy and the 200 MA as the guide on tokens to trade,price should be above 200MA

PHAUSDT (PhalaNetwork) Updated till 16-01-25PHAUSDT (PhalaNetwork) Daily timeframe range. Finally its trying for a retrace back a clean close above 0.4353 can run it back. not a fake close keep in mind. failed close will lead it back to 0.2884 or lower. 0.2884 needs to hold for the push.
