#PHA/USDT #PHA
The price is moving in a descending channel on the 1-hour frame and is expected to continue upwards
We have a trend to stabilize above the moving average 100 again
We have a descending trend on the RSI indicator that supports the rise by breaking it upwards
We have a support area at the lower limit of the channel at a price of 0.2860
Entry price 0.3201
First target 0.3634
Second target 0.4000
Third target 0.4400
PHAUSDT trade ideas

PHAUSDT UPDATEPHAUSDT is a cryptocurrency trading at $0.3209. Its target price is $0.5000, indicating a potential 50%+ gain. The pattern is a Bullish Falling Wedge, a reversal pattern signaling a potential trend change. This pattern suggests that the downward trend may be ending. A breakout from the wedge could lead to a strong upward move. The Bullish Falling Wedge is a positive signal, indicating a potential price surge. Investors are optimistic about PHAUSDT's future performance. The current price may be a buying opportunity. Reaching the target price would result in significant returns. This pattern typically leads to a strong upward move.

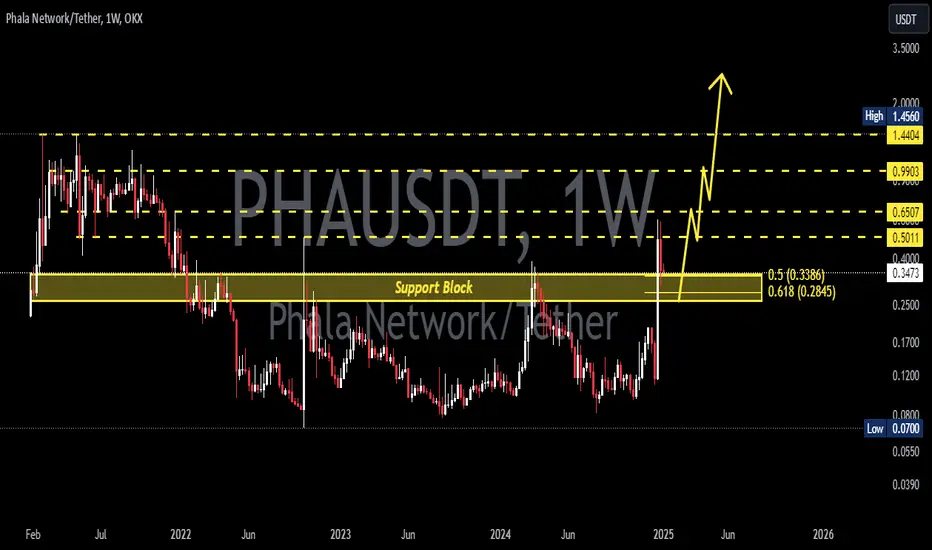
PHAUSDT 1WPHA Update ~ 1W
#PHA So far it still maintains its bullish structure. This is the support block of the golden ratio,. Buy in stages. with a minimum target of 20%+
PHA i am very interested to see tomorrow morning if it will trigger the alarm for long..
probability for 20-25% long rally tomorrow afternoon it is 90%
lets see...
gn everyone, this trade is monitoring.

PHALA/USDTphala has more potential upside.
if this is the bottom and we look at the extended fib levels it could go to over a dollar. but always take some profits a certain levels just in case. and also put you stopploss to break even at TP1 and leave some position open.

PHA - Under the radar potentialThe good looking chart shows us breakout and retest confirmation on the weekly very clearly. This is an AI focused coin PHA.
I have followed their recent updates and seems like they have a very unique business model when it comes to utilizing AI agents. I think the coin has a good use case and a good inflation model to be sustainable.
I will hop on this one. Lets ride the AI train.
Let me know of your thoughts.

Prepare to BUY Spot PHPUSDT on the New D1 Cycle
🌟 Capitalize on the Fresh Opportunity with PHPUSDT! 🌟
🌍 Market Overview:
PHPUSDT is showing strong bullish potential on the D1 timeframe, making it a promising setup for short-term gains within the week.
📊 Trade Plan:
📌 Entry Point: $0.35 - $0.5 – Distribute capital across 3 entries to optimize positioning.
🎯 Target: x1 (100% gain) – Doubling your initial investment with strategic execution.
⏳ Hold Time: Until the end of this week – Short-term hold aligned with the D1 cycle.
🔍 Strategy Insights:
D1 Momentum Focus:
Signals from the indicator suggest a high-probability setup for strong upward movement.
Capital Distribution:
Splitting entries ensures flexibility and risk management.
🚀 Next Steps:
💬 Reach out if you need personalized guidance or more strategy insights.
💡 Note: This is not financial advice. Always DYOR before trading.
🔥 PHPUSDT is set for a powerful move – Position yourself now! 🔥

Phala Network | TA Theory & Fib. TargetsHello my dear supporter, I would like to thank you for choosing to read what I have to share. I promise to give you engaging content, entertaining and enlightening. You will learn something new with each and every single trade-idea or, in the least, you will be entertained.
Phala Network (PHAUSDT) produced a long consolidation phase in 2023, last year. The blue channels depicted on the chart (left side). This consolidation phase lasted 238 days.
The bullish wave that followed was relatively small in terms of the cryptocurrency market. Such a long consolidation phase would normally yield a stronger bullish wave. You cannot find this in books nor anywhere, this is 100% experienced based information.
The fact that the consolidation phase was long in duration, the bullish wave relatively short and the correction strong yet ending in a higher low (early August), can tell us that a new bullish wave can develop without much (new) consolidation.
This is my theory based on technical analysis. Follow my thinking; it is like the strength generated by the previous consolidation phase wasn't fully used, therefore, little consolidation is needed for a new and strong wave.
We have really high buy volume in June, again, a higher low in August while this date produced the strongest crash of the year marketwide, signaling that sellers on this pair are no longer active.
It is likely that this pair can grow. The signals are good and leaning toward the strong side.
On a drop, support can be found at the last low and if a drop does happen, a recovery can be quick because the correction hit almost 100% of the previous bullish wave.
When we consider that the correction removed all gains, we can count the entire period from June 2023 through present day as the consolidation phase. That would be more than 430 days of strengthening action; the bullish jump earlier this year is just the whales buying, in anticipation of the 2025 bull-market.
The targets can be seen on the chart.
I love you.
Namaste.

PHA LONG H1Phala Network tackles the issue of trust in the computation cloud. By organizing a decentralized network of computation nodes around the world, it offers high-performance services without relying on any cloud vendor. Phala workers run the programs in Secure Enclaves, a privacy technology already embedded into modern processors, enabling versatile and confidential execution. Together, this creates the infrastructure for a powerful, secure, and scalable trustless computing cloud.

PHAUSDT Nearing Breakout Zone!PHAUSDT technical analysis update
PHAUSDT has been ranging for the last 1100 days and is now moving towards the range resistance line for a breakout. A strong bullish move can be expected once a breakout is confirmed on the daily chart. An increase in volume near the resistance is also observed.
Stop loss : $0.18
Take Profit 1: $0.41
Take Profit 2: $0.61
Take Profit 3: $1.23

PHA/USDT: Trade Opportunity
PHA is targeting a breakout of the blue resistance level on the 1-hour timeframe.
Entry: Now
Stop Loss: $0.2257
Target: $0.4056
Risk/Reward: 2.13
⚠️ Stay tuned and follow me for more updates and insights!

Phala PHA price analysisA rather old altcoin, #PHA whose price suddenly shot up.
🔴 Does this indicate the super strength of buyers or some new interest in the #PLAHA project? Rather not.
🟢 It's more likely that MM took advantage of the “stagnation” in the market and slightly “rocked the price”.
Is there a chance for OKX:PHAUSDT to go to ATH - yes, but after it manages to gain a foothold above $0.32 (because buyers have been failing to do so for the last 2 years)
Otherwise, be careful, as the price may fall by $0.14 once again
_____________________
Did you like our analysis? Leave a comment, like, and follow to get more

#PHAUSDT ( prision break ? )The ascending pattern has created a powerful green that could even
be a beautiful triangular floor.
Crossing the ceiling of the pattern,
especially the flashing red resistance line, can throw it
so WAIT & WATCH it

PHA | AI InfrastructurePhala recently partnered with ai16z, the AI agent framework, and they will launch version 2.0 of their network next year. The chart has held its bear market lows and looks okay. Though I would wait for a safer entry on the retest of the breakout in the green box.

#PHA ( SPOT_TRADES)BINANCE:PHAUSDT
Entry (.132- .152)
SL 4H close below .130
T1 .162
T2 .174
T3 .187
T4 .207

PHAUSDT (PhalaNetwork) Updated till 24-12-24PHAUSDT (PhalaNetwork) Daily timeframe range. we can see a nice pump today. retraced above 0.1835 all it needs a confirm close to get to 0.2347. it got volume but retail interest needs to keep up. recent support at 0.1384.

PHA Retrace Opportunity to 0.12XX to 0.13XX before taking OFF PHA Retrace Opportunity to 0.12XX to 0.13XX before taking OFF
PHA is about to break out but it may be rejected to test the 0.12XX Area

PHAUSDTPHA ~ 1W
#PHA So far have continued to maintain this support block. If you still have Conviction on this coin,. This support block would be a very good buy for now. With a minimum target 20%++

Phausdt strong buy opportunityPHAUSDT made a significant move, as highlighted in our last analysis as shown here
But encountered a strong supply area that led to a sharp decline, bringing the coin back to the base of the previous demand zone. This zone remains valid, and we anticipate strong accumulation to occur here.
Expected targets are outlined feel free to share your thoughts on this coin!

PHAUSDTPHA ~ 1W
#PHA Maybe if you are interested in this coin,. you need to pay attention to this key Support,. Last time the price bounced off this key support. at least for a minimum 20%++ profit.

PHAUSDT.1DLooking at the chart you provided for PHA/USDT, I'll provide a detailed technical analysis from a first-person perspective:
Starting with the general trend, I observe a significant downtrend from April through late July, with the price attempting to find support. In recent weeks, there has been a notable recovery, indicating a possible shift in momentum or at least a short-term reversal.
Focusing on key support and resistance levels, the chart highlights two major resistance levels at $0.1452 (R1) and $0.1817 (R2). These levels are critical as they represent previous points where buying pressure exhausted, leading to reversals. On the flip side, the support levels at $0.1023 (S1) and $0.0801 (S2) are equally crucial. S1 represents the immediate floor beneath the current price, suggesting a potential area where buyers might re-enter if the price dips.
The current price, at approximately $0.1199, is positioned above S1 but below R1. This places the price in a consolidation zone, awaiting further cues from the market. The pivot point at $0.1023 is key. Staying above this level could indicate continued buyer interest, potentially pushing the price toward R1.
For a comprehensive analysis, I consider the volume and potential candlestick patterns (though not visible here). A surge in volume accompanying a move towards a resistance or support level would confirm the strength of that move. Additionally, I would look for candlestick patterns such as bullish engulfing or hammers near support levels to validate entry points.
In conclusion, my strategy involves watching for a solid close above R1 with increased volume, which might suggest a potential entry for a long position with a target near R2. Conversely, a break below S1 with significant volume could be a signal to consider short positions or to exit long positions, targeting S2 as the next probable support level. Trading should always be accompanied by tight risk management, setting stop-loss orders slightly below support levels or above resistance levels, depending on the position.

PHAUSDTWe can attempt to short PHAUSDT from specified level if it break HL , also there is bearish divergence occur indicate that it moves downward.
SL , TP mention in chart.

PHAUSDT 6 Day timeframe TargetBINANCE:PHAUSDT
PHA USDT , I am seeing a falling wedge on a 6 Day timeframe that can take phala to the next level.
also it touches the bottom.
A very good project AI and DEPIN.
not a financial advise.DYOR
