#PHB/USDT is rejecting from the Diagonal Trendline#PHB/USDT is rejecting from the Diagonal Trendline on the 4-Hour TF.
⏳ Plan: Wait for a breakout (BO) and successful retest before considering a long position.
🚩 Key Levels:
Resistance: PWH $1.51
Support: PWL $1.2063

PHBPhoenix looking so great for spot, do not let this price escape, monitor it during the next week and if the market will be positive for alts, PHB will give 1x on spot, very quickly...
nfa
dyor
$PHBThis is a significant level for $PHB.
Expecting it to bounce here as its forming bullish shark pattern.


PHB ANALYSIS🔮 #PHB Analysis
💲💲 #PHB is trading in a Symmetrical Triangle Pattern. If the price of #PHB breaks and sustain the higher price then will see a pump. Also there is an instant strong support zone. We may see a retest towards the support zone first and then a reversal📈
⁉️ What to do?
- We have mark

phb - bear flagThe "bear flag" pattern is formed on 12h TF. When the price breaks through $1.5, you can open a short with a target of ~$1.2

PHBUSDT 3DPHB ~ 3D
#PHB for now continues to maintain this Support block,. Buy gradually on this support,. with a minimum target of 20%++

PHB looks bullishIt looks like the PHB is forming a triangle.
We are now in wave E of this triangle.
The green range is a suitable support where we can look for buy/long positions.
The targets are marked on the chart.
Closing a daily candle below the invalidation level will violate this analysis.
For risk manag

Phb/usdtSoon we will see phb at the green levels! Important thing is to note down the weekly closing candle but regardless we will see phb at those levels.
If we get a weekly closing candle above previous all time highs. That could create opportunity for further growth.

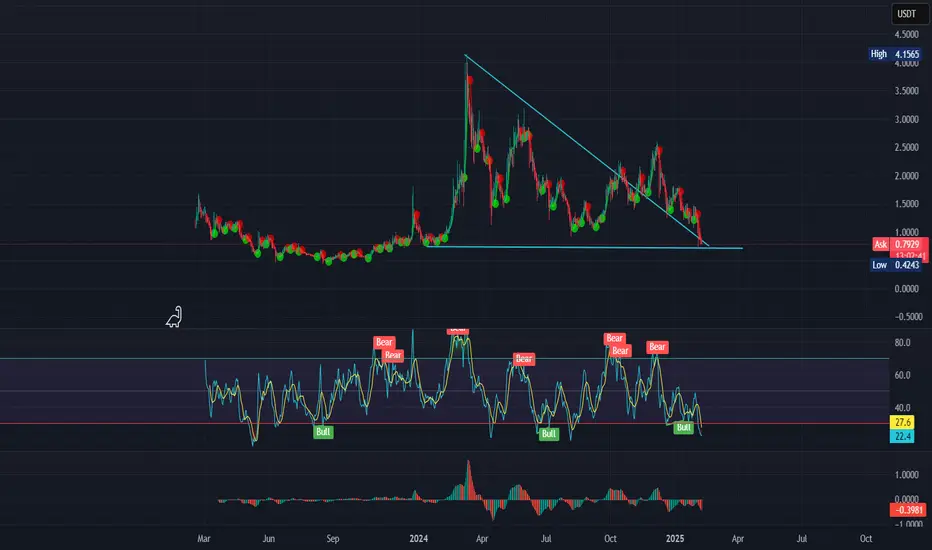
PHB ANALYSIS🚀#PHB Analysis :
🔮As we can see in the chart of #PHB that there is a formation of "Descending Channel Pattern". Expecting a bullish move after the breakout of major resistance zone in few days.📈
🔰Current Price: $2.010
🎯 Target Price: $2.815
⚡️What to do ?
👀Keep an eye on #PHB price action. We

See all ideas
Displays a symbol's price movements over previous years to identify recurring trends.