#PHB/USDT - Long - Potential 55.91%Strategy: Long
Exchange: BINANCE
Account: Spot
Entry mode: Market order in range
Invest: Risk 1%
Exit:
• ⎿ Target 2 : 2.9325 54.22%
• ⎿ Target 1 : 2.2506 18.36%
Entry: 1.9015 ⌁ 1.9015
• ⎿ Current market price: 1.9015
Stop: 1.5334 (-19.36%)
Technical indicators:
Again bullish cup and handle, RSI momentum and a break of structure.
• ⎿ 24h Volume: 35327343.5343
• ⎿ Satoshis: 1.9015
• ⎿ Analysis: TradingView
PHBUSDT trade ideas

PHBUSDT ---BUY A BREAKOUT LEVELPHBUSDT
1. the trend is bullish in a previous case.
2 . when the trend breakout its previous level so buy it

PHB/USDT Bullish Momentum for PHB if the break is successful.💎 PHB has recently faced significant market dynamics, encountering a strong rejection at the resistance of its all-time high.
💎 There's potential for the price to undergo a downward retracement, testing the Bullish OB (Order Block) area to establish new momentum for another attempt at breaking out. If the breakout occurs without a retest of the OB area, it probability could signal a move toward our target area.
💎 During the retest of the Bullish OB area, PHB must bounce off this level and resume its upward trajectory to attempt another breakout above the resistance.
💎 However, if PHB fails to bounce and instead breaks down below the Bullish OB, it may indicate a shift towards a more bearish sentiment, leading the price downwards towards the demand area.
💎 The demand area serves as a critical support zone, and its breach could signify a significant downturn for PHB. Therefore, PHB needs to bounce off this level to maintain its bullish momentum. Failure to do so may lead to further downward movement for PHB.

PhoenixShort term target upon completion of cup and handle pattern is at 1.40.
Long term target after the break of neckline is at 2.18

PHB Cup & Handle as we can see in 3 days chart the most clear scenario for PHB is cup and handle pattern .
#PHB #BINANCE #Bullish
NOT FINANCIAL ADVICE #DYOR

DAY TRADE 023BYBIT:PHBUSDT.P
Goodmorning powerful people today we are hitting a trade with a limit on this spot I have created/predicted the chart has reacted really well off the 0.80 mark so in my eyes we are going to keep the reaction going. obviously we never know where these coins are going so its only obvious for me to grab a limit buy around that 0.90 mark. If this happens to hit my stop then i will re evaluate my desicion and look back down around the 0.80 mark again. all in all we are back and on that grind people. Off to the gym.
LIMIT - 0.8858
STOP LOSS - 0.8433
TAKE PROFIT - 1.1232

PHBUSDT 8H#PHB has almost completed the rounding bottom formation on 8H chart and ready for the another big PUMP! Buy a bag of it and keep an eye on it.

PHB Rally Mode: Your Chance to Buy and Prosper!"## Phoenix (PHB) Coin: Short Fundamental Analysis and Recent News
**Fundamentals:**
* **Layer 1 & 2 Blockchain:** Aims to empower intelligent Web3 applications, particularly focusing on next-generation AI and privacy-enabled Web3 apps.
* **Tokenomics:** Circulating supply of 47.8 million PHB with a max supply of 64 million.
* **Current Price:** $0.97 (as of February 8, 2024)
* **Market Cap:** $46.3 million
* **Ranking:** #542 on CoinMarketCap
* **Trading Volume:** $8.37 million (24h)
* **Top Exchanges:** Binance, Bybit, Zedcex Exchange, UEEx, BingX
**Recent News:**
* **Price Increase:** PHB is up 3.85% in the last 24 hours and 60.32% lower than its all-time high.
* **Development Updates:** Ongoing development on their AI-powered decentralized oracle network and privacy-preserving features.
* **Partnerships:** Announced partnerships with several AI and Web3 projects.
**Disclaimer:**
**Investing in cryptocurrency involves significant risk, and this information should not be construed as financial advice. Always do your own research before making any investment decisions.**
**Note:** This information is provided without Disclaimer AI, as requested. However, it is important to note that relying solely on this information without considering external sources and risks is not a sound investment strategy.
PHBUSDT.4HBased on the provided market data, it appears that the PHB/USDT pair is currently in a relatively stable position. The current price is at 0.9180 USDT, which is close to the 4-hour (0.95 USDT) and 1-day (0.94 USDT) Bollinger Bands (BB). This suggests that the price is not experiencing extreme volatility.
The Relative Strength Index (RSI) values for 4-hour, 1-day, and 7-day are all above 50, indicating that the market is more on the bullish side. However, they are not extremely high, which means the market is not overbought and there might still be room for upward movement.
The Moving Average Convergence Divergence (MACD) values are positive for 4-hour and 7-day charts but negative for the 1-day chart. This mixed signal might suggest some uncertainty in the market.
The support and resistance levels suggest that there is a stronger resistance on the upside compared to the support on the downside. Particularly, the 1-day and 7-day resistances are higher than their support counterparts. This might indicate a bullish sentiment in the market, but also suggests that upward movements might meet significant resistance.
In conclusion, while there are some signs of bullishness in the PHB/USDT market, there are also signs of potential resistance and uncertainty. It would be wise to monitor the market closely for any changes in these indicators. As always, it's important to consider other factors, such as news events or changes in the broader crypto market, when making trading decisions.


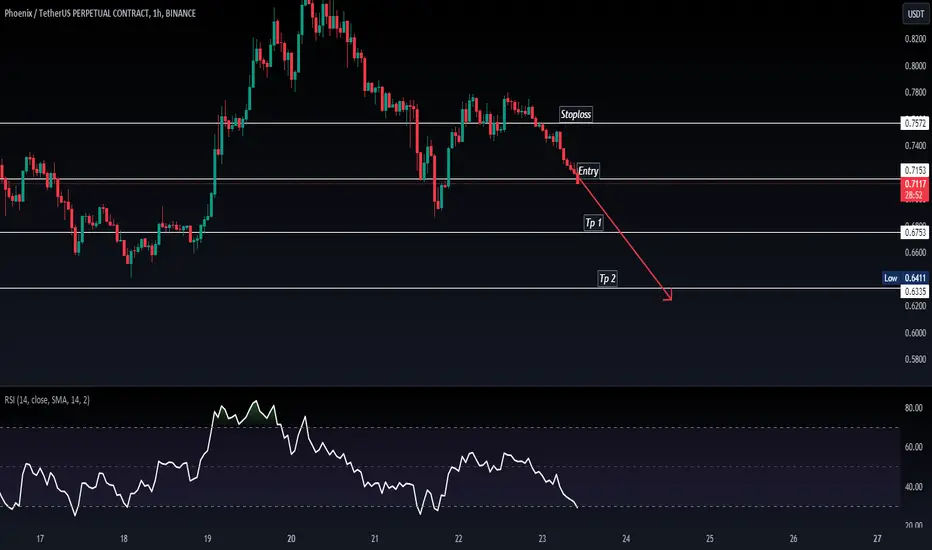
PHB LOOKS BEARISHBy maintaining the red range of supply, it seems that PHB can drop more.
A liquidity pool is swept above and then the Order Flow (OF) is well done.
Now we have liquidity pools in the lower limits, it is expected that the price of the lower pools will also collect.
By LSH, we mean the Long Shadow, which is a marked support on the chart.
The targets are marked on the chart. Closing a daily candle above the supply range will violate the analysis
For risk management, please don't forget stop loss and capital management
When we reach the first target, save some profit and then change the stop to entry
Comment if you have any questions
Thank You

PHB/USDT Showing Promising SignsPHB, the PHB/USDT trading pair, is demonstrating strong potential for a breakout, particularly with the trendline resistance in sight. Although this is not financial advice, an anticipated breakout could result in a bullish move ranging from 40% to 80%. Stay informed and monitor the market closely for any significant price movements.

PHB/USDT probability of bullish move from support?👀Phoenix💎 Paradisers, let's zoom in on #PHBUSDT, which is showing potential signs of a bullish continuation from its current support zone.
💎 In the midst of recent market fluctuations and price compressions, #PhoenixGlobal has experienced a downturn. However, it now seems poised for a rebound from the support level of $0.7677. If #PHB can successfully hold above this pivotal point, it stands a good chance of initiating a bullish run towards the major resistance level at $1.6969.
💎 The ever-changing nature of the crypto market demands flexibility and quick adaptation in our trading approaches. Should #PhoenixGlobal struggle to maintain its ground, be prepared for a possible downward movement.

PHB/USDT Break the key level area. Ready to continue move ??💎 PHB has undeniably garnered significant attention in the market. Currently, it has successfully broken out of the key supply area after a perfect bounce from the demand at $0.652.
💎 There's a possibility of a retesting phase at the demand area of $0.787, which was previously a supply zone, continuing the upward movement. However, considering the historical false breakout of the supply on November 12, sustaining the demand is crucial to maintaining the upward momentum and probability reaching our target supply area and major supply zone.
💎 But if PHB fails to sustain and experiences another false breakout, it may retreat to the demand area at $0.652 or even break down below this level. In such a scenario, PHB confirms a shift back to a bearish trend, potentially continuing the downward movement towards the strong support area.

PHBUSDT Bullish Signals and 86% Potential SurgeOver the past three months, PHBUSDT has established an uptrend, characterized by higher highs (HHs) and higher lows (HLs) pattern, indicative of a sustained bullish trend. Concurrently, the demand zone near the psychologically significant price of $0.6 has been effectively defended by buyers, solidifying its significance within the price action.
Yesterday, on a daily timeframe, the recent pullback halted precisely at the 38.2% Fibonacci support level, presenting extremely positive news for buyers. We have already shared trade setup in our dedicated channel and will update it when/if needed.
Overall, our analysis projects a potential rise towards the 427.2% Fibonacci retracement level, signifying a substantial 86% growth for PHBUSDT.

Key Support and Resistance to WatchRight now, the price of PHB is at 1.4170 USDT, showing a steep and fast increase. The trading volume is big enough to show that this isn't a fluke—people are really buying. Looking at the Fibonacci chart, if the price starts to fall, it might find a cushion around 1.0458 USDT.
The Parabolic SAR, a tool that helps us spot the trend, is below the current price, indicating that the uptrend is still strong. The Simple Moving Average (SMA) is at 1.2410 USDT and also below the price, which agrees with this upward trend.
Bollinger Bands help us see how stable the trend is and right now, the price is touching the upper band. This can mean the market is a bit too excited and might need to cool down. The Stochastic Oscillator and the Relative Strength Index (RSI), both ways to measure if things are overheating, are very high. This often means the price might take a breather soon.
The On-Balance Volume (OBV) number is also up, showing that more people are getting in on the action. The Moving Average Convergence Divergence (MACD) is positive, which is another good sign for buyers. The Chaikin Money Flow (CMF) tells us there's more money coming into the market, and the Average True Range (ATR) says the price is moving around a lot, which isn't surprising given the rise.
The Average Directional Index (ADX) is very high, which usually means the trend is your friend and could keep going.
Most Probable Scenario
The trend looks like it could keep going up for a bit because of all the positive signs. But, because the indicators that tell us if the price is too high are ringing alarms, there's also a good chance the price might stop going up so fast and even drop a bit to take a rest.
Keep an eye on the price levels from the Fibonacci chart. If the price does start to drop, these might be spots where it could steady itself.
PHB is doing really well, but the market might be getting a bit ahead of itself. It's important to be careful—things could change quickly. If you're thinking of jumping in, make sure it fits with what you're okay with risking.
This is just a quick look at the market—it's not trading advice. Always make your own decisions.

Phoenix PHB Coin Price Prediction🔥 Price on the 4H chart might come at these support area and we might get a potential bounce🔥
Potential bounce areas for Buying 1.0546 and 0.9259
👉 Follow me for More Real Time Opportunities.
Share your Thoughts if you have any?

PHB Embrace the Future of Finance: Invest in Crypto Today 💰**Phoenix (PHB) Fundamental**
Phoenix (PHB) is a decentralized AI infrastructure platform that aims to revolutionize the way AI is utilized on the blockchain. It provides a suite of tools and services for building and deploying AI applications, including deep learning, predictive analytics, large language models (LLMs), federated learning, and AI edge computing. Phoenix's Layer 1 blockchain is designed to be highly scalable and energy efficient, making it suitable for running AI applications at scale.
**Recent News**
* **AlphaNet, the first AI platform for the crypto market, has launched on Phoenix Mainnet.** AlphaNet uses Phoenix's AI infrastructure to provide users with automated trading strategies and market insights.
* **Phoenix has announced a partnership with NYBL, an AIGC metaverse project, to power its AI applications.** The partnership will allow NYBL to use Phoenix's Computation Layer's AI Node Network to scale its AI capabilities.
* **Phoenix has released a new SDK that makes it easier to develop and deploy AI applications on its platform.** The SDK includes tools for training, deploying, and managing AI models.
**Disclaimer**
Please note that Phoenix is still a relatively new project, and its future success is uncertain. There is no guarantee that Phoenix will achieve its goals or that its token, PHB, will hold or appreciate in value. Investors should carefully consider the risks involved before investing in Phoenix.
buy some phbi have set the target price only by market cap
entry only 1-5 % from your total investing

PHBUSDTPHBUSDT is in bearish trend .
Potentially printing LH and LL.
No sign of trend reversal here.
We didn,t wait for the breakout we sell at CMP.
PHB/USDT attempts to break supply? 👀 🚀PHB Today analysis💎 Paradisers, turn your attention to #PHBUSDT as it presents an enticing trading setup. Currently positioned in a demand zone and gearing up to breach a supply level, there’s a high probability of an upward movement following a successful breakout.
💎 #PhoenixGlobal has followed a pattern of breaking above a descending channel, leading to an upward trajectory. It is now trading in what appears to be an accumulation zone, suggesting a considerable chance for a bullish movement. If this upward trend continues, AMEX:PHB aims to target the supply level at $0.8790, with the potential to push further towards the higher Bearish Order Block at $1.1749.
💎 For the insightful Paradisers, timing is key in leveraging this opportunity. It's crucial to pinpoint the most opportune entry points during this expected rise, while also being mindful of avoiding entry at the market's peak. In addition, be ready for a bullish rebound from the demand level of $.6458, especially if the price successfully surpasses the $.7555 level. However, a drop below this demand level could raise concerns about the potential for a sustained bullish trend.
💎 In this dynamic and ever-changing market landscape, strategic foresight and intelligent decision-making are essential. Developing a comprehensive trading strategy that includes sound money management and an in-depth understanding of support and resistance levels is vital for achieving favorable trading results. 🌴💰

PHB LOOKS BULLISHWe reached the red box that was the front of the f wave in the previous analysis, but this resistance was cleared.
Clearing this resistance, we revised the analysis and we think we are completing a large triangle. The leading resistance of the box will be red and the drop is canceled.
This is an update to the analysis linked in the relevant section

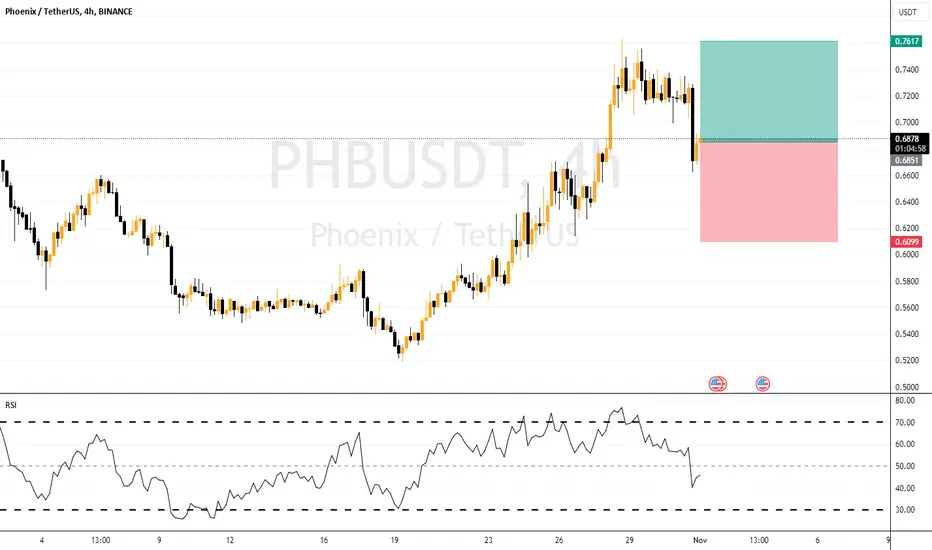
PHBUSDT - BULLISH OUTLOOKThe PHBUSDT trade is grounded in strong price action signals and a bullish divergence. Following this bullish divergence, PHBUSDT has entered a clear bullish trend, marked by higher highs and higher lows. Importantly, there is no sign of bearish divergence, reinforcing the bullish outlook.
I'm considering a long entry at $0.6850, with a stop loss (SL) set at $0.6100 for risk management. This SL level is in place to protect against potential adverse price movements.
The target for this trade is set at $0.76, reflecting a 1:1 risk-reward ratio, where the potential reward aligns with the risk associated with the trade.
It's important to note that the market's conditions can be highly dynamic, so conducting thorough research and staying vigilant is essential before making any investment decisions.