Pippin · 5,895% Last Wave vs 3,000% Profits PotentialThis one looks good. Here the variation comes from the fact that in June there was a higher low compared to April, then again in July another higher low. Even before the last bullish wave we have higher lows and this is good.
PIPPINUSDT grew a massive 5,895% just 8 months ago. This reveals that this pair can do wild numbers. If done once, can happen again.
Then we have a full correction, the one that ended in April, and this is even better. Since the bullish move was corrected, it means a new one can develop. After the correction ended we have higher lows. Even when selling pressure was really strong (based on the volume) you can see how buyers were always present.
The next rise can hit an easy target of $0.208 for a massive 1,100%. A standard bull market with the current chart can yield 3,000% at $0.531. The end result can be something different.
Prices can end up moving up but not reaching our targets or everything can happen where prices move much higher. Lower is not likely and very low probability. 1,100% I would say is the minimum and an easy target because it was already hit in January 2025, much higher. With the higher lows in place, clear and strong, we aim for a higher high and that is a new all-time high. 3,000%. Seeing the 5,000% done easily months ago, we know it is possible and it is likely that it will be done. It is going to happen.
Namaste.
PIPPINUSDT.P trade ideas

PIPPIN/USDT recently flipped the 0.017 major resistance into strong support, signaling a potential base for the next bullish leg. Price action is consolidating above this key level, showing strength and readiness for continuation. A healthy retest of the green box entry zone

PIPPIN/USDT Long Setup Update!!PIPPIN Breakout Alert – 100% Potential on the Table
Hey Traders — if you're into high-conviction setups with real momentum, this one’s for you.
PIPPIN is breaking out from a falling wedge pattern on the 4H timeframe after a long period of consolidation. This structure typically signals a potential reversal with strong upside momentum.
With the recent breakout, we’re looking at a fresh long opportunity:
Entry:
Current levels: 0.0172 and add more up to $0.0155
Stop-Loss:
Below support: 0.0141
Targets:
Target 1: 0.0336
Target 2: 0.0450
Target 3: 0.0550
Target 4: 0.0650
✅ Risk-reward remains highly favorable from this point.
✅ Tight stop-loss to manage risk in case of any invalidation.
✅ Watch for confirmation above immediate resistance for further strength.
Disclaimer: Always manage your position size and risk. Trade safe!

PIPPIN IS ABOUT TO EXPLODE AGAIN??!!🔍 Chart Structure
Descending Wedge Breakout:
Price has broken out of a long-term descending wedge pattern.
This breakout is typically bullish, especially when accompanied by increased volume or momentum indicators turning up.
Support/Resistance Levels:
Current Price: ~0.0201 USDT
Key Resistance Zones:
0.02200 – Minor resistance
0.02310 – More substantial historical resistance
0.02473 – Intermediate target
0.02847 – Major target from chart box
Support Zones:
0.01815 – Key local support
0.01600 – Lower risk invalidation/support
Trade Box:
Green box = Potential long trade setup.
Looks like a Risk/Reward ratio of about 2.5–3:1 based on entry and stop vs. target.
Entry: ~0.0200
Stop: ~0.0182
Target: ~0.0284
📊 Indicators
RSI (Relative Strength Index):
Current RSI: ~41.75
Still in a neutral zone, suggesting there’s room for upside before becoming overbought.
Mild bullish divergence could be forming if previous lows were lower than the RSI lows.
⚠️ Considerations
Volume Confirmation: Look for increasing buy volume after breakout to confirm strength.
Retest of Wedge Line: If price pulls back, a retest of the breakout line could be a good secondary entry.
Macro Resistance: 0.0284–0.0300 has historically been a supply zone; expect selling pressure there.
✅ Potential Strategy
Long Entry: 0.0200 (Confirmed breakout)
Stop Loss: Below 0.0182
Target(s):
TP1: 0.0220
TP2: 0.0247
TP3: 0.0284

PIPPIN Potential Bullish Impulse BrewingPippin (PIPP) exhibits a completed five-wave motive decline terminating towards a well-defined External Demand Zone, signaling a high-probability reversal area. The current structure reflects the onset of a corrective Wave 2 retracement, with early indications of a Wave 3 impulsive advance underway.
The Immediate Demand Zone has acted as a structural support base, with bullish rejection from the predefined sell-off zone confirming latent buying pressure. Price action recently formed an intra-wave correction around the 0.0457 pivot, likely marking the end of a minor wave within the developing larger impulsive cycle.
Sustained bullish momentum above the rejection zone would confirm the initiation of Wave 3, with Fibonacci-based extension targets projecting a medium-to-long-term rally toward $2.80. Conversely, failure to hold above the Immediate or External Demand Zones would invalidate the bullish impulse and expose the asset to a potential deeper corrective retracement.

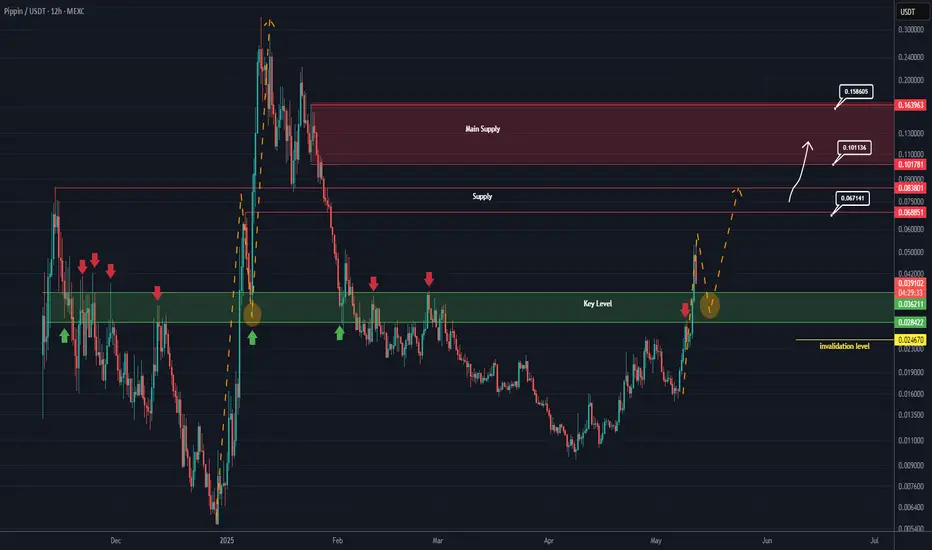
PIPPIN New Update (12H)It seems that a flip zone | or a key area | has been reclaimed here.
Previously, every time price touched this zone, it was rejected. But this time, the price has reclaimed it sharply and is now retesting the area.
Pay attention to the yellow arrows and circles.
Opening a sell/short position at this level might not be a good idea.
As long as the green zone is held, the price can move toward the marked supply levels.
If it drops below the green zone and a daily candle closes below the invalidation level, the bullish outlook on Pippin would still not be invalidated.
For risk management, please don't forget stop loss and capital management
When we reach the first target, save some profit and then change the stop to entry
Comment if you have any questions
Thank You
PIPPING breakout falling wegdeThere are must be a good move to the up direction.
P. S. If you want to get every day morning summary on a cryptomarket you could find me at the link in profile.

PIPPIN/USDT: LONG TRADE SETUP!!🚀 Hey Traders! PIPPIN Breakout Alert – Big Move Incoming? 👀🔥
If you’re excited for this setup, smash that 👍 and hit Follow for high-quality trade ideas that actually deliver! 💹🔥
🔥 PIPPIN Breakout & Retest – Time to Pump?
PIPPIN has broken out of a falling wedge on the 2H timeframe and is now retesting the breakout level. If this retest holds, we could see a strong rally ahead! 🚀
💰 Trade Setup:
📍 Entry: CMP, add more up to $0.019
🎯 Targets: $0.0225 / $0.0252 / $0.0294 / $0.0334
🛑 Stop-Loss: $0.018
⚡ Leverage: Low (Max 5x)
🔎 Strategy: Enter with low leverage now, scale in on dips, and ride the momentum to key targets!
💬 What’s Your Take?
Are you bullish on PIPPIN’s breakout? Drop your thoughts, analysis, and predictions in the comments! Let’s secure those gains and ride this wave together! 💰🚀🔥

PIPPINUSDTPippin/USDT to rise, and based on the chart analysis, that’s a possibility.
STRONG SUPPORT
- The 4HR trendline still holding, which indicates that the downtrend might slow down.
- The price has reached a key zone that was previously resistance and has now turned into support
DIVERGENCE
- The RSI is showing bullish divergence, which signals a potential price reversal.
CHAT PATTERN
- The price is forming a Falling Wedge Pattern which is usually a bullish pattern.
Possible Price Targets
- Short-Term Target: 0.049 USDT
- Long-Term Target: 0.087 - 0.110 USDT

PiPPiN: $0.06 | An Organic Discovery from the packager of LiNK GRAPH and high flying projects that spawned more projects
comes a BREAKTHROUGH in the next generation of building good stuff
enjoy reading the journal
long story short
this is close o the GOD PARTICLE that one can appreciate
took me days to digest and see through
MARVELOUS
strategy: own it and grow it
narrative: Elon will definitely love this more so the evil geniuses at OpenAi
catalyst: an invitation from the White House more so KREMLiN
playout: Bidding War is coming
