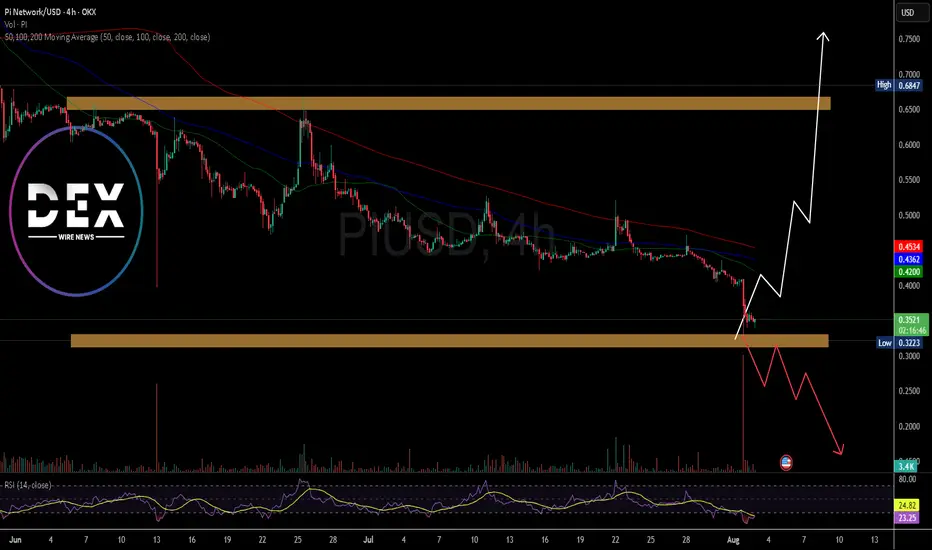
Is There Hope For PI Network? The Price of the notable altcoin NASDAQ:PI network has since seen a downtick of 80.86% since lunching and listing on major CEX like Kucoin, GateIo, OKX, etc. as per data from CMC.
The altcoin has lost the psychological $0.66 resistance zone forming a support or baseline at the $0.33 price range. with increasing selling pressure, NASDAQ:PI might experience further price dip to the $0.20 price point eventually leading to a deja vu to the $0.60 price point.
Possible factor to present price degradation is the dip in CRYPTOCAP:BTC 's price that most coins follow suit, and NASDAQ:PI wasn't an exception.
NASDAQ:PI is currently oversold as hinted by the data from Trading view. the altcoin has an RSI of 20 which entails weak momentum and possible chances of a market turnaround.
What Is Pi Network?
Pi Network is a social cryptocurrency, developer platform, and ecosystem designed for widespread accessibility and real-world utility. It enables users to mine and transact Pi using a mobile-friendly interface while supporting applications built within its blockchain ecosystem.
Pi Price Data
The Pi price today is $0.346618 USD with a 24-hour trading volume of $174,236,091 USD. Pi is down 14.58% in the last 24 hours. The current CoinMarketCap ranking is #38, with a market cap of $2,692,698,184 USD. It has a circulating supply of 7,768,487,700 PI coins and a max. supply of 100,000,000,000 PI coins.
PIUSD trade ideas
PI3USD – Bleeding With No BottomPI3 is in a clear multi-day downtrend, with successive lower highs and lower lows. Attempts to bounce have all been sold into quickly. The recent breakdown below $0.53 pushed price to new lows near $0.51. Until $0.535 is reclaimed convincingly, short setups dominate.

bullish on pi aprouching pi day 2buy now and hodle for later as pi continue making waves on crypto markets and the distribution of lockeck pi continues

Long Trade Analysis – PI/USD (30M Chart)!📈
✅ Setup Overview
Chart Type: 30-minute timeframe
Asset: PI Network / USD (OKX)
Pattern: Descending trendline breakout with confirmation candle
Trade Type: Long (Buy)
📌 Key Levels
Entry Point: ~$0.6411 (just above trendline break)
Stop Loss: ~$0.6258 (recent support)
Target 1: ~$0.6624 (near resistance)
Target 2: ~$0.6854 (upper green zone / stronger resistance)
📊 Trade Justification
Breakout from a descending triangle/trendline.
Bullish engulfing candle confirms breakout.
Strong risk-to-reward ratio, likely ~2.5R
Volume is moderate, suggesting early momentum
📢 Suggested Caption for Sharing:
✅ PI/USD Long Setup (30M)
Trendline breakout with clean support bounce.
📍Entry: 0.6411 | SL: 0.6258 | TP1: 0.6624 | TP2: 0.6854
Let’s see if bulls can push toward resistance levels!
#CryptoTrading #PIUSD #BreakoutTrade #TradingView

Trade Setup Summary – PIUSD (Pi Network / USD)!📈
Chart: 30m timeframe – OKX Exchange
🔺 Pattern: Symmetrical Triangle + Downtrend Line Breakout
The price is pressing against confluence resistance – triangle top + descending trendline + yellow horizontal resistance.
📍 Entry Zone: Around $0.7396
Price is attempting a breakout; needs candle close above $0.74 for clean confirmation.
🛑 Stop-Loss (SL): $0.7261
Below triangle support and white horizontal support zone.
🎯 Target Levels (TP):
TP1: $0.7580 (Red resistance – short-term barrier)
TP2: $0.7826 (Green zone – swing high resistance)
⚖️ Risk/Reward Ratio:
Favorable: approx 1:2 to 1:2.5 depending on target.
🧠 Technical Highlights:
Triangle squeeze is near completion; breakout decision imminent.
Horizontal resistance and trendline overlapping (yellow + pink) – watch closely.
Volume bar (2.48) is relatively low – look for volume spike for stronger breakout.
✅ Bias:
Bullish above $0.74
Bearish below $0.726 (breakdown risk)

PI/USD Breakout Confirmed – Bulls Taking Control!🟢 Trade Type: Long (Buy Setup)
Pair: PI/USD (Pi Network vs US Dollar)
Timeframe: 30-Minute Chart
Current Price: $0.7410
🔍 Technical Setup
Pattern: Falling wedge breakout (bullish reversal pattern)
Entry Point: Breakout and retest around $0.7410 (highlighted with a yellow circle)
Trend Reversal: Price broke a long-term downtrend line (pink), confirming breakout potential
🎯 Targets & Stop-Loss
Take-Profit (TP):
TP1: $0.8328 (previous resistance zone)
TP2: $0.9393 (major supply zone)
Stop-Loss (SL):
Below wedge base/support: $0.6946
⚖️ Risk-to-Reward (R:R):
Estimated R:R: Over 2.5:1
Tight stop, wide target = good potential for swing move
🧠 Trade Logic
Broke out of major downtrend + clean wedge
Pullback held above support zone
Strong green candles on breakout with volume starting to build

Trade Setup – PI/USD Long!📈
Pattern: Falling Wedge Breakout (Bullish Reversal)
Entry Zone: Around $0.7169 (confirmed breakout in progress)
Support Zone: Around $0.6867 (marked in white)
Resistance/Target Levels:
TP1: $0.7706 (minor horizontal resistance)
TP2: $0.8493 (major resistance/previous range top)
Stop-Loss (SL): Below $0.6860 (structure invalidation area)
📊 Technical Highlights
Falling wedge pattern breakout with a bullish candle.
Price is respecting support (highlighted in yellow box).
Bullish divergence likely forming (RSI not shown but implied by price action behavior).
Risk-to-reward ratio is favorable based on the green box projection.
✅ Summary
Direction: Long (Buy)
Entry Confirmation: Breakout + retest of wedge resistance.
Good R:R Setup: Reward zones are clearly mapped with logical SL.


Trade Setup: Falling Wedge Breakout (Bullish Reversal)!📈
🔹 Pattern:
A falling wedge pattern has formed and appears to have broken out with a strong bullish candle.
📌 Entry Zone:
Around $0.96 – near the breakout of the falling wedge pattern and previous horizontal support.
❌ Stop-Loss:
Below $0.85 – under the wedge's lower trendline and previous support zone (shown in white and yellow lines).
🎯 Take Profit Targets:
TP1: $1.0860 – nearest resistance level (white line)
TP2: $1.2603 – next horizontal resistance (yellow zone)
TP3 (Extended): $1.3516 or $1.5783 – potential upper resistances if strong momentum continues
🧠 Trade Logic:
The breakout from the falling wedge suggests reversal.
Entry aligns with previous horizontal support zone.
Volume also appears to pick up at breakout (check volume confirmation).
✅ Summary:
Direction: Long
Reason: Falling wedge breakout + support bounce
Targets: 1.08 → 1.26 → 1.35+
Stop: Below 0.85
Risk/Reward: Favorable if entered around 0.96

Long Trade Setup – PIUSD!📈
Timeframe: 30-Minute Chart
Setup Type: Falling Wedge Breakout (Bullish Reversal)
📌 Trade Plan
Entry Zone: Around $1.10 (breakout confirmation above trendline)
Stop-Loss (SL): Below $0.95 (invalidates wedge & structure support)
🎯 Take Profit Targets
TP1: $1.32 – Recent resistance zone
TP2: $1.57 – Measured move from wedge breakout
🔍 Technical Highlights
Falling wedge pattern signals reversal potential 📉➡📈
Clean breakout candle above the wedge with consolidation
Strong demand at ascending trendline support
Volume stabilizing post-selloff
📊 Risk-Reward Ratio
Risk: $1.10 - $0.95 = $0.15
Reward to TP2: $1.57 - $1.10 = $0.47
R:R ≈ 1:3.13 ✅
🚀 Execution Strategy
✅ Enter only on confirmed breakout and candle close above trendline
🛑 SL just below $0.95
🎯 Partial profit at TP1, trail rest toward TP2
⚠ Invalidation Risk
❌ Strong bearish rejection from $1.10
❌ Bearish engulfing candle with volume below trendline

PI:short target have been reachedPI:short target have been reached
.
Let's see how PI has run!
.
US STOCKS- WALL STREET DREAM- LET'S THE MARKET SPEAK!

Pi network got sniped prove me wrong, I locked 600 away 3 years ago and now i see this, what a joke crypto has become.
this is a warning to all people looking into crytpos, just stick to the well backed coins.

PIUSD: Inside bar patternPIUSD: Inside bar pattern
Less supply volume at the bottom.
Tighter range.
Wait and see a break!
US STOCKS- WALL STREET DREAM- LET'S THE MARKET SPEAK!

Have your heard of $Pi ?! NASDAQ:PI , an OG project that allows you to mine NASDAQ:PI coins on your mobile device, without draining your battery. Mainnet is out and coinbase could list NASDAQ:PI soon.

WHY NOT?As most of you know. Pi struggling against High selling pressure now and make a lot of people disappointed . But depends on the Overall market condition and especially Pi network i can say this Idea gonna be good. If Pi could play out . Let's see what's going on .

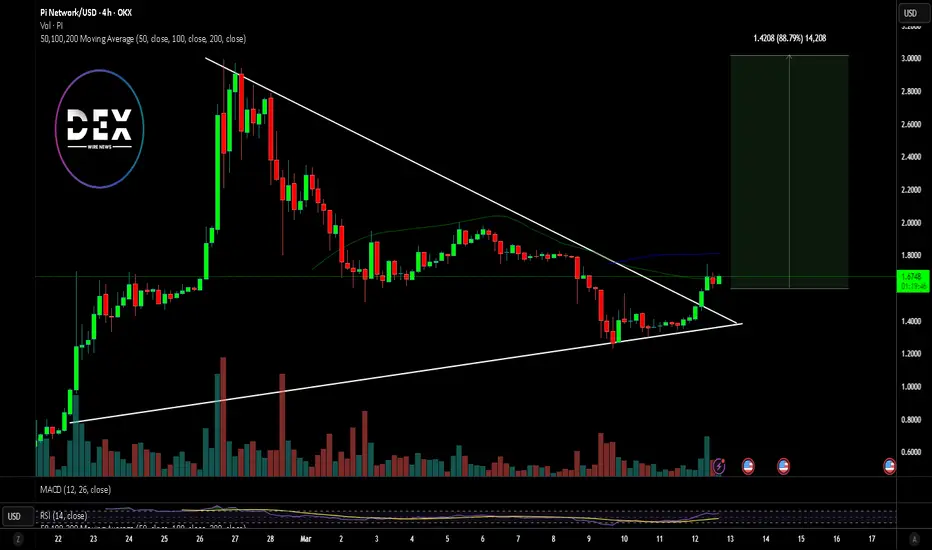
$PI Set for Massive Breakout Amidst Bullish Symmetrical TriangleThe long-awaited launch of NASDAQ:PI has ignited excitement in the crypto space. After six years of mining, Pi Coin finally hit the open market last month, and its price action suggests a potential major breakout. With a bullish symmetrical triangle pattern forming and key technical indicators aligning in its favor, NASDAQ:PI is gaining traction among investors and traders alike.
Technical Analysis
Pi Coin is currently trading at $1.66, having surged 22.75% in the last 24 hours. Its 24-hour trading volume stands at an impressive $811,256,445, indicating strong market interest.
Symmetrical Triangle Formation
A symmetrical triangle is often considered a continuation pattern, signaling a potential breakout in the direction of the prior trend. NASDAQ:PI recently broke out of this bullish formation, setting the stage for further upside movement.
The Relative Strength Index (RSI) sits at 62, suggesting increasing buying pressure. An RSI above 70 typically signals overbought conditions, but with room for growth, NASDAQ:PI is positioned for an extended bullish campaign. If buying pressure intensifies, NASDAQ:PI could soon breach the key psychological resistance at $2, with the next pivot point set at $3.
Market Capitalization and Trading Volume
NASDAQ:PI boasts a live market cap of $11.91 billion, with a circulating supply of 7.15 billion coins. Such a high ranking underscores the coin’s growing adoption and market confidence.
Conclusion: What’s Next for Pi Coin?
With strong technical indicators and a solid fundamental foundation, NASDAQ:PI appears well-positioned for continued growth. If the buying momentum sustains, breaking the $2 resistance could open the door for a push towards $3. Meanwhile, its unique approach to mining and real-world adoption potential make it an intriguing project for long-term investors.
PI NETWORK: Catch the bottom, if you can!PI NETWORK: Catch the bottom, if you can!
-Key level and demand zone support.
-Less supply zone at the bottom.
Let's enjoy cafe then!
.
See more plans at US STOCKS- WALL STREET DREAM

PI NETWORK: Second movementPI NETWORK: Second movement
-Inside bar pattern swinging on consolidation range.
-Less volume.
.
Wait for a break soon! But a shakeout at 2 would be a wonderful buy entry!
Wait and see!
US STOCKS- WALL STREET DREAM- LET'S THE MARKET SPEAK!

PI NETWORK- Crypto for Web 3.0-Swinging on tight triangle consolidation with less supply volume.
-Key level as support and ressistence zone as image.
-Waiting for a break soon!
.
Wait n see!
US STOCKS- WALL STREET DREAM- LET'S THE MARKET SPEAK!
