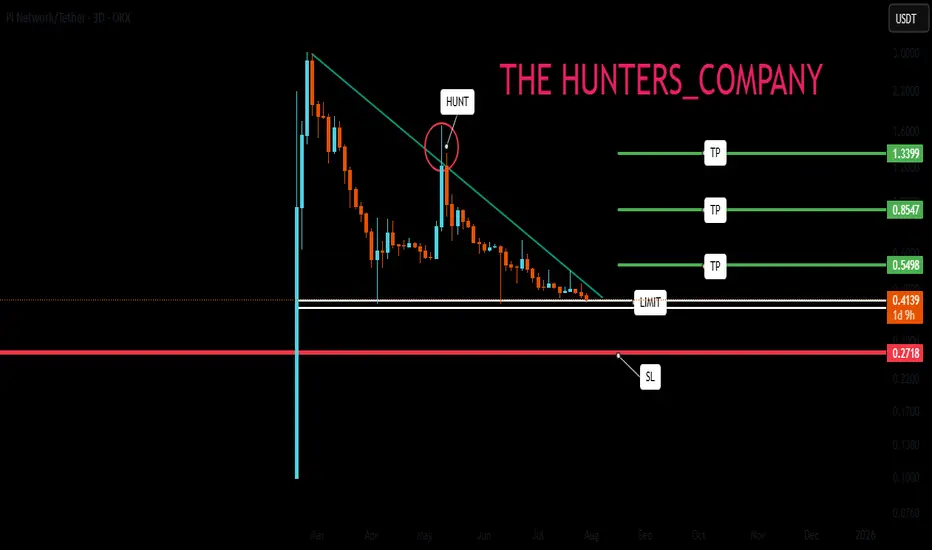
PI NETWORK : Will it finally be pumped?Hello friends🙌
👀According to the decline we had, you can see that the price has reached an important area and has formed a floor in this area. Considering the classic ego that is forming on support, you can enter the trade by breaking the resistance, of course, by managing risk and capital and movi
Related pairs
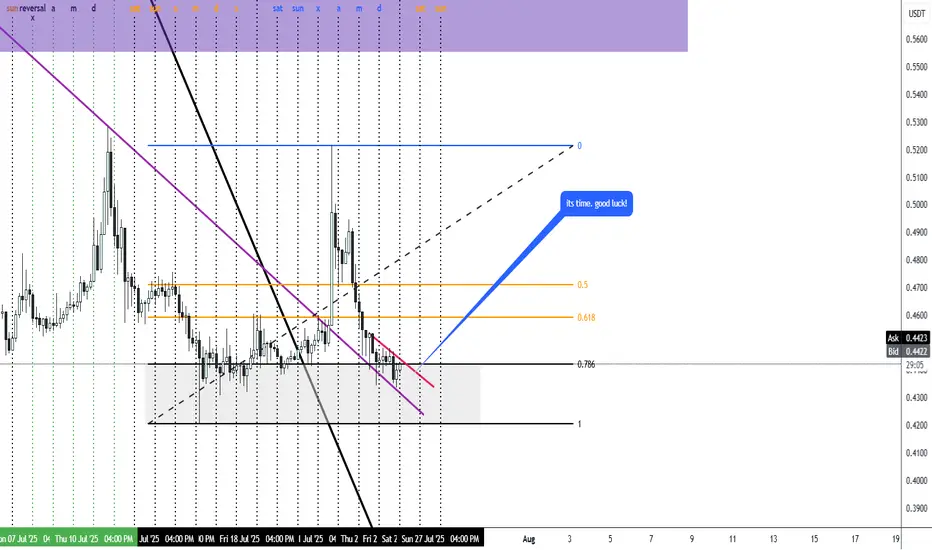
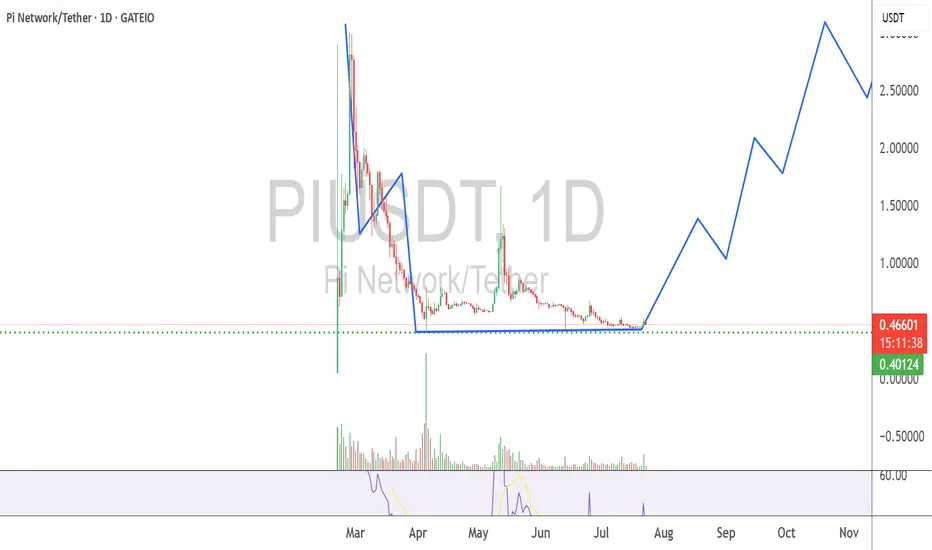
PIUSDT Time is NOW - BullishWe saw change of character.
i think It is now time to get in.
good luck to all!
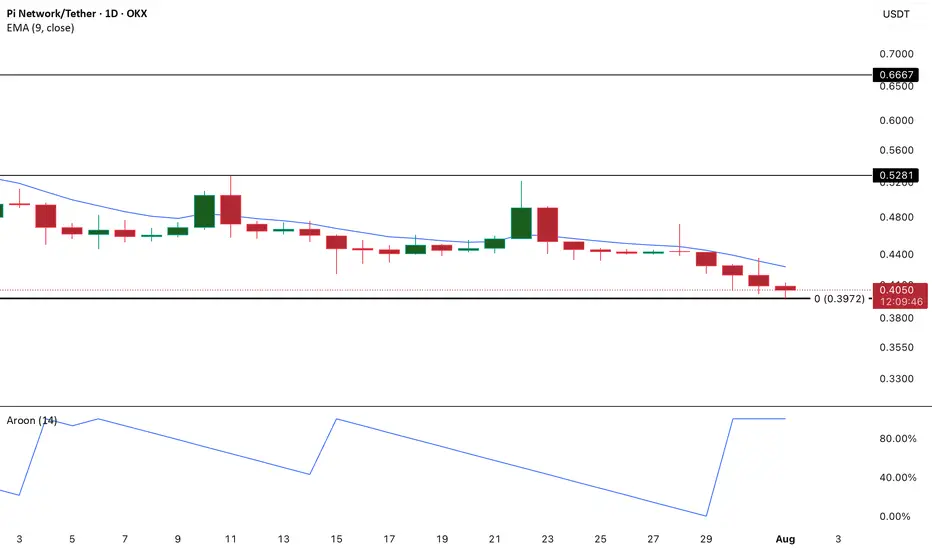
PI in Full Bear Control as Aroon Down Hits 100%PI continues to flash warning signs as technical indicators lean heavily bearish. Most notably, the Aroon Down Line on the daily chart has surged to a reading of 100%.
For context, the Aroon indicator is designed to identify the strength and duration of a trend, and when the Down Line reaches the
PI / Usdt OKX:PIUSDT
### **📊 Chart Overview – PIUSDT (1H):** -----Scam Coin remember -----
* **Current Price:** \$0.4484
* **Recent Move:** Sharp spike toward **\$0.48**, followed by an immediate rejection and retracement.
* **Volume Spike:** Notable surge in volume during the recent breakout, indicating

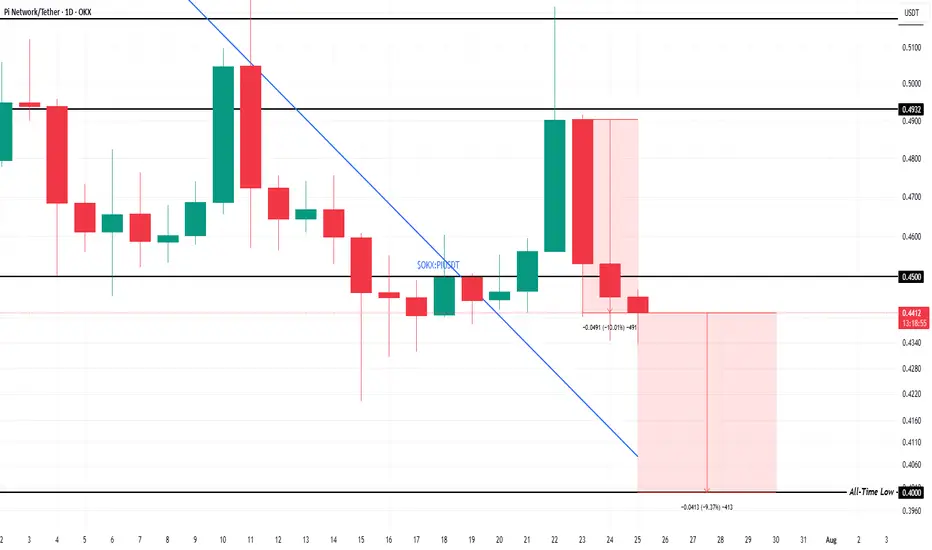
Pi Coin Price Falls 10%, All-Time Low Now Just 9% AwayOKX:PIUSDT price is currently hovering at $0.44, just 9% away from its all-time low of $0.40 . The recent decline has pushed the altcoin below the support of $0.45, indicating a weak position. The next support level for Pi Coin is crucial as it attempts to hold above its current levels.
With Pi
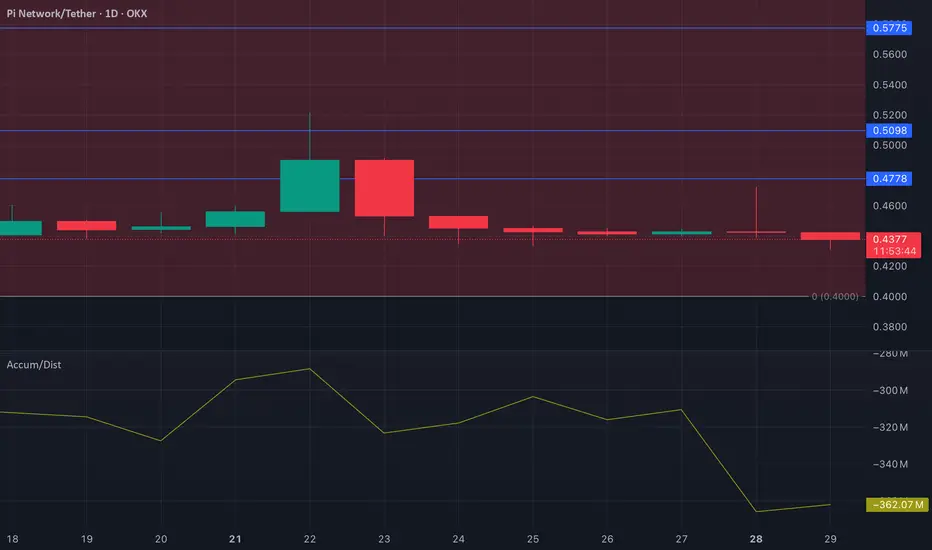
PI – Bearish Pressure Mounting as A/D Line CollapsesPI’s daily chart paints a bearish picture, with technical indicators showing no signs of a recovery. A standout signal is the Accumulation/Distribution (A/D) line, which has been on a sharp downtrend since June 26.
This steep decline in the A/D line signals that sellers have been dominating the ma
PI Faces Continued Sell Pressure as BoP Turns NegativePI continues to exhibit a bearish structure, with momentum indicators reinforcing the downtrend. The Balance of Power (BoP) indicator currently reads -0.49, signaling that sellers remain firmly in control. This negative reading reflects a market dominated by sell-side pressure, with minimal resistan

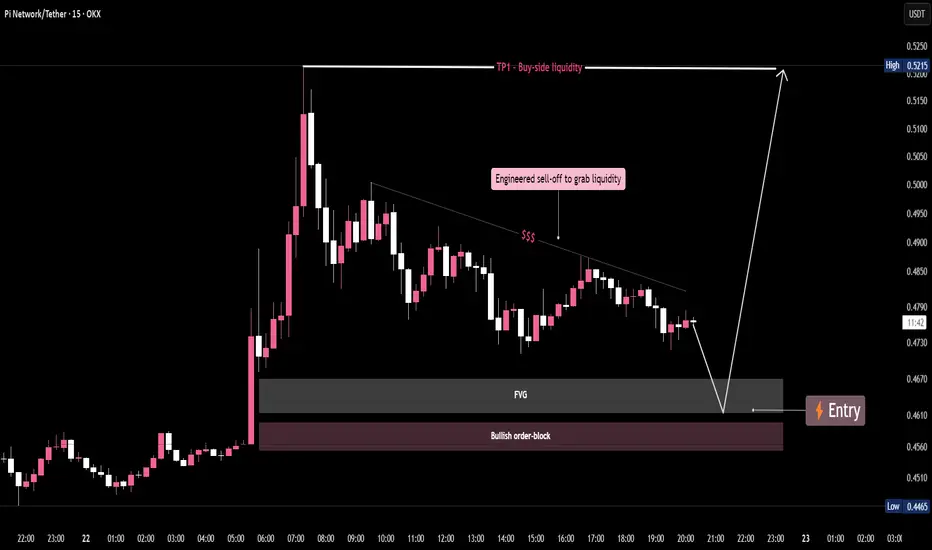
PI/USDT- Liquidity Grab Loading.....Price is sweeping trendline stops before tapping into a key FVG + bullish order block.
Smart money is accumulating below—next stop: buy-side liquidity above $0.52.
A textbook SMC play unfolding. Are you ready?
What does the future hold for Pi Network?Pi Network Coin (PI) is the native cryptocurrency of the Pi Network, a decentralized blockchain project designed to make cryptocurrency mining and usage accessible to everyday people via mobile devices. Unlike traditional cryptocurrencies like Bitcoin that rely on energy-intensive mining hardware, P
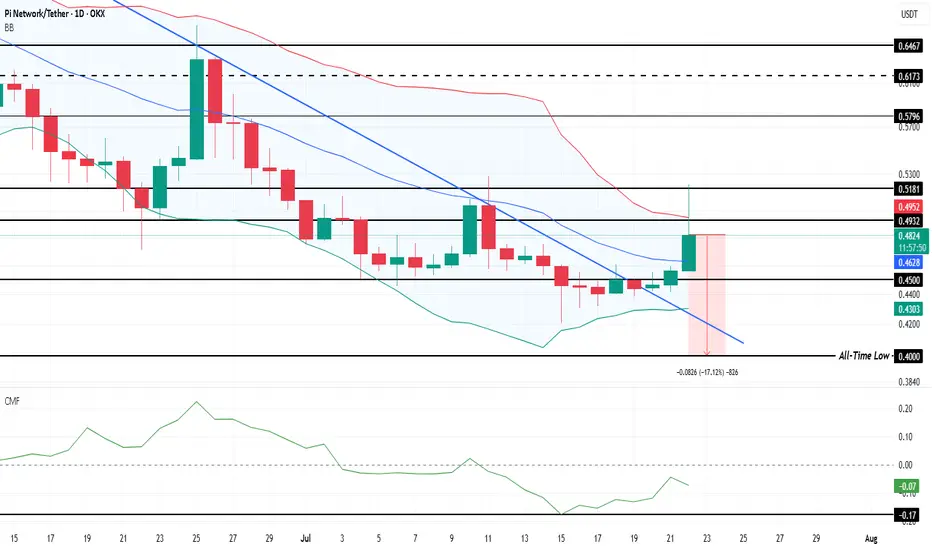
Is Pi Coin Set To Repeat History With a 114% Price Surge?OKX:PIUSDT is currently trading at $0.48 after consolidating sideways for several days. This consolidation has worked in its favor, helping the altcoin escape its two-month downtrend. Investors are now watching closely for the next resistance to be broken.
OKX:PIUSDT Bollinger Bands are conve
See all ideas
Summarizing what the indicators are suggesting.
Oscillators
Neutral
SellBuy
Strong sellStrong buy
Strong sellSellNeutralBuyStrong buy
Oscillators
Neutral
SellBuy
Strong sellStrong buy
Strong sellSellNeutralBuyStrong buy
Summary
Neutral
SellBuy
Strong sellStrong buy
Strong sellSellNeutralBuyStrong buy
Summary
Neutral
SellBuy
Strong sellStrong buy
Strong sellSellNeutralBuyStrong buy
Summary
Neutral
SellBuy
Strong sellStrong buy
Strong sellSellNeutralBuyStrong buy
Moving Averages
Neutral
SellBuy
Strong sellStrong buy
Strong sellSellNeutralBuyStrong buy
Moving Averages
Neutral
SellBuy
Strong sellStrong buy
Strong sellSellNeutralBuyStrong buy
Frequently Asked Questions
The current price of Pi Network/Tether (PI) is 0.3528 USDT — it has fallen −0.37% in the past 24 hours. Try placing this info into the context by checking out what coins are also gaining and losing at the moment and seeing PI price chart.
Pi Network/Tether price has fallen by −8.43% over the last week, its month performance shows a −14.99% decrease, and as for the last year, Pi Network/Tether has increased by 252.80%. See more dynamics on PI price chart.
Keep track of coins' changes with our Crypto Coins Heatmap.
Keep track of coins' changes with our Crypto Coins Heatmap.
Pi Network/Tether (PI) reached its highest price on Feb 26, 2025 — it amounted to 3.0000 USDT. Find more insights on the PI price chart.
See the list of crypto gainers and choose what best fits your strategy.
See the list of crypto gainers and choose what best fits your strategy.
Pi Network/Tether (PI) reached the lowest price of 0.1000 USDT on Feb 20, 2025. View more Pi Network/Tether dynamics on the price chart.
See the list of crypto losers to find unexpected opportunities.
See the list of crypto losers to find unexpected opportunities.
The safest choice when buying PI is to go to a well-known crypto exchange. Some of the popular names are Binance, Coinbase, Kraken. But you'll have to find a reliable broker and create an account first. You can trade PI right from TradingView charts — just choose a broker and connect to your account.
Pi Network/Tether (PI) is just as reliable as any other crypto asset — this corner of the world market is highly volatile. Today, for instance, Pi Network/Tether is estimated as 12.50% volatile. The only thing it means is that you must prepare and examine all available information before making a decision. And if you're not sure about Pi Network/Tether, you can find more inspiration in our curated watchlists.
You can discuss Pi Network/Tether (PI) with other users in our public chats, Minds or in the comments to Ideas.