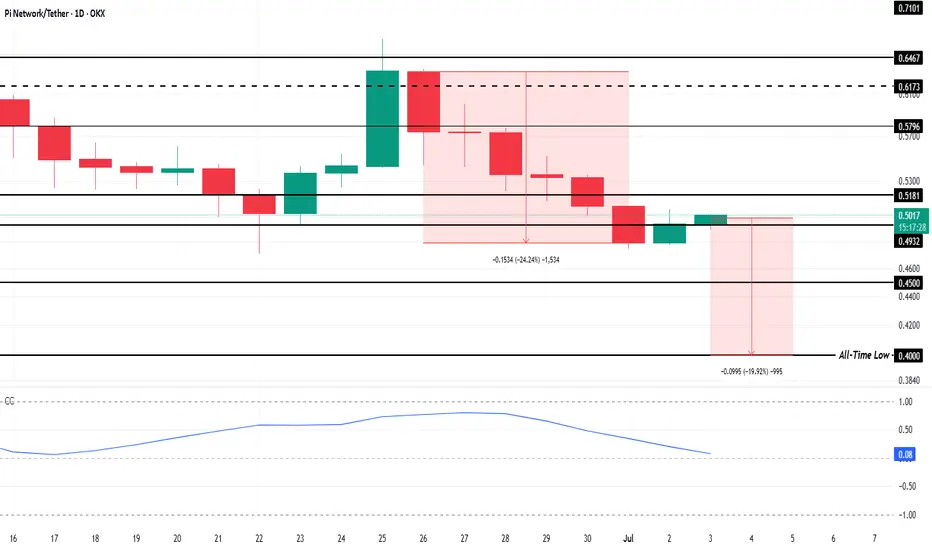
Pi Coin Closes In On All-Time Low; Bitcoin ResponsiblePi Coin’s price is currently hovering around $0.499, which is approximately 20% above its all-time low of $0.400. However, the overall market environment suggests further decline may be imminent. With continued bearish sentiment and decreasing confidence in Pi Coin , the altcoin could struggle to maintain its current levels.
Furthermore, the correlation between the Pi Coin and Bitcoin has steadily decreased. Currently, it is just 0.07, a stark contrast to the positive relationship the two coins once shared.
A low or negative correlation means that Pi Coin is moving independently of Bitcoin. This is concerning for investors who have relied on Bitcoin’s momentum to drive altcoins like Pi forward.
If Pi Coin loses the support level of $0.493, it may drop further, potentially testing the $0.450 mark. A sustained decline below this support would make Pi Coin vulnerable to hitting its all-time low again. The ongoing outflows and negative market sentiment only add pressure to Pi Coin’s price, keeping it on a downward trajectory.
However, should the altcoin experience a shift in momentum, Pi Coin could find demand from investors looking to capitalize on a potential recovery. If the coin breaches $0.518 and flips into support, it could open the door for a price rebound. A reversal would allow Pi Coin to regain investor confidence and potentially invalidate the current bearish outlook.
PIUSDT.P trade ideas
Head and Shoulders Head and shoulders at the bottom of a downtrend.
Closed below neckline and rejected the neckline on the uptrend.
Heigh of head to neckline (price difference) x 2 = price target.
needs to close above the right shoulder to invalidate.
Always set a SL

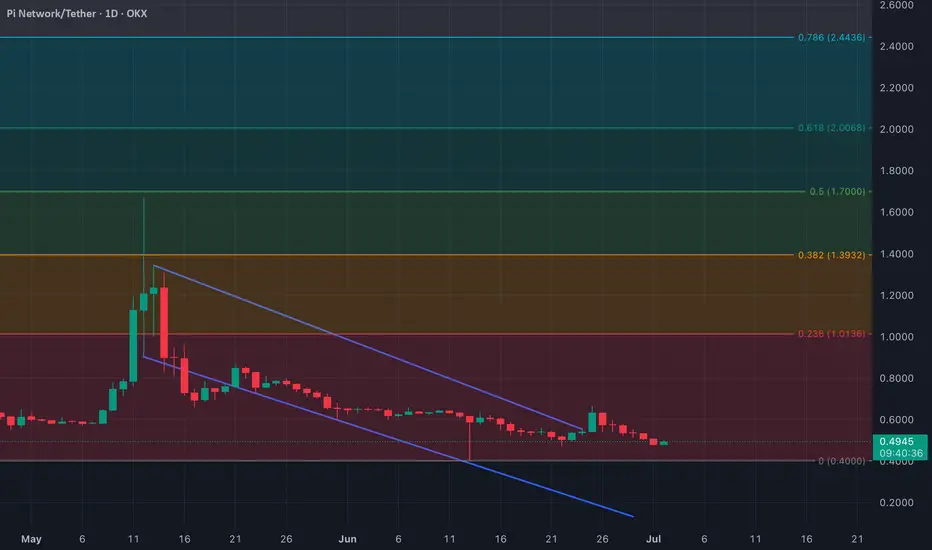
PI Slips Back Into Downtrend – Eyes on $0.40 SupportPI has fallen back into its descending trendline after a brief breakout on June 25 failed to hold. Selling pressure remains dominant, increasing the risk of a drop toward the all-time low at $0.40.
If bearish momentum persists, further downside is likely. However, a spike in demand could invalidate this outlook and push PI back toward the $1.01 resistance.
Pi scalp risky but lets GO!!!!Hello traders, hope you're doing well!
NASDAQ:PI is showing strong bullish signs.
It's currently moving within a falling wedge pattern.
A breakout and pump could be coming soon.
If you profit from this, don’t forget to like and follow!

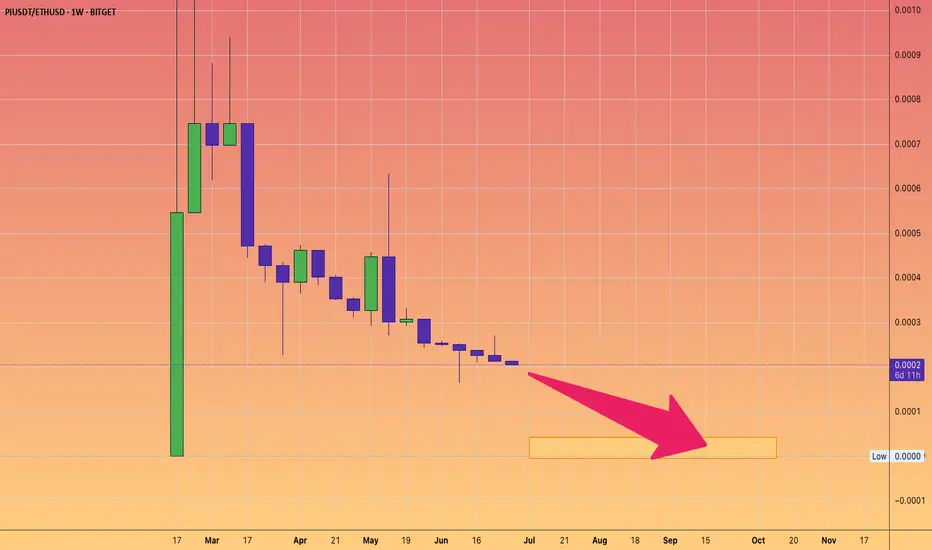
DON'T BUY Pi Network. It's a PUMP and DUMP.But feel free to short it if you desire.
This is Pi v ETH chart
It will continue it's trend to near ZERO.
Market makers will keep dumping into oblivion.
PI/USDT Final Call before it flies to the next galaxyWe see so many bullish signs.
Price could potentially tap into the discount zone
before it soars.
Good luck!

Pi can recapture the last support trend line soonLooking at the possible ascending head and shoulder pattern, Pi can recapture the last support trend line soon.

Pi USDT WILL MAKE A LONG RUN AGAINPi/USDT
After analyzing the Pi Network chart, I noticed it seems to be repeating a previous pattern, which caught my interest. As a beginner trader, I decided to test the water with a small position (just trying my luck 😅).
My entry point is 0.4946, and if I decide to scale in aggressively, I might just enter at the market price.
Here’s a quick summary:
Entry: 0.494
TP1: 0.57
TP2: 0.66
TP3: 0.85
If I have a long-term vision and the patience to hold, I might extend my take-profit levels from $1 to $1.25 or even higher.
May God make us among the successful traders 🙏🏽.
Ibrahim Ibrahim Shuaibu #Chaza 📌
#Danbolajari #CryptoTrader #CryptoTrading #Success #Hausa #crypto

$PI TECHNICAL ANALYSIS ! !NASDAQ:PI is finally breaking out of the long-term downtrend and showing early signs of strength.
Price has reclaimed the falling wedge resistance and is now pushing toward the 0.236 Fib zone around $0.69 that we need to break to move further up.
If bulls hold momentum, the next target could be $0.88 (0.382 Fib), with $1+ in sight if the trend continues.
The structure looks bullish, but watch for a clean breakout and retest, and continuation.
DYOR, NFA

PI's situation+ Target PredictionThe price has broken the ascending wedge, and this could push it toward the middle of the channel, potentially happening very quickly.
Best regards CobraVanguard.💚

PIUSDT falling wedge breakout 🚨 Hello Traders!
PIUSDT has successfully broken out of a falling wedge — a strong bullish pattern.
This breakout may indicate the start of an upward move.
Watch for a retest of the breakout zone for potential entries.
Volume confirmation will add confidence to the setup.
Stay alert and always apply proper risk management. 📊

PIUsdti dont see any reason for pi to go above a dollar for now. in as much pi team is still in control of billions of token, the investors will always go short. so am still expect pi team to release community token after the price drop below 0.07

The falling wedge of Pi Coin?Falling wedge Pi network pattern?The Pi Network (PI) token is currently showing signs of forming a falling wedge pattern, which is often interpreted as a bullish reversal signal in technical analysis. This pattern is characterized by two downward-sloping trendlines that converge, indicating a slowdown in bearish momentum.
One week to go.. just wait what will happen next.

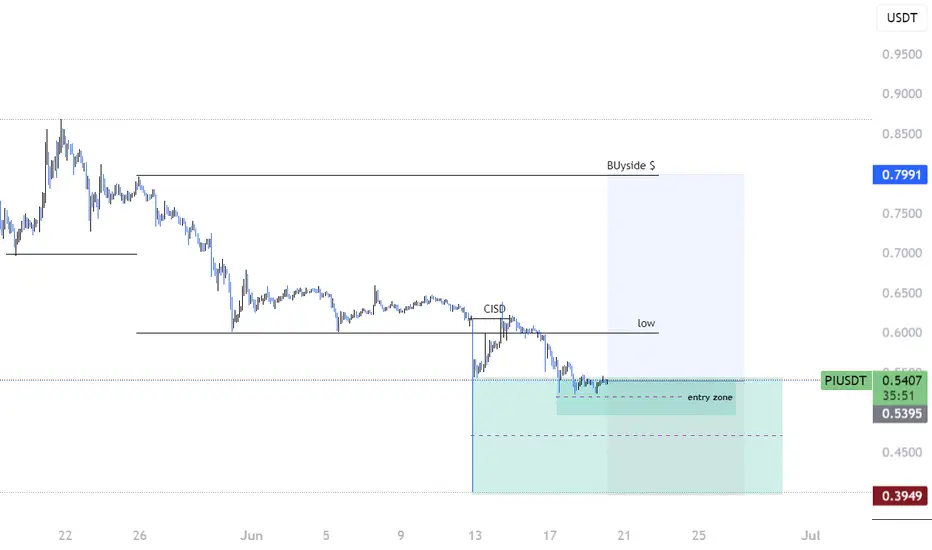
Pi long !! proper risk management Hello traders, keeping a close eye on NASDAQ:PI — forming a solid pattern.
Strong wick indicates a potential buy zone in this area.
We do have some untapped downside liquidity below.
However, with CRT in play, a bullish move is likely.
We’ve already completed CISD confirmation on the 3H timeframe.
Looks like a good opportunity to position for the upside.
PI/USDT potential entry before flying to the next galaxyCould this be the zone?
Either we will make profit or be liquidated.
Good luck babies!

PI breakout !!Trendline Break:
Price has broken above a descending trendline — often a bullish signal.
A small retest is visible, indicating confirmation of the breakout.
Equal Highs (Liquidity Pool):
Labelled “$$ same highs” — this suggests buy-side liquidity is resting above that level.
Price often targets these highs to grab liquidity before a reversal or continuation.
BSL (Buy-Side Liquidity):
Two BSL levels marked; price may aim for these as upside targets.
FVG (Fair Value Gap):
The green shaded zone above represents an imbalance (FVG), usually a magnet for price.
Price may fill this area, targeting between 0.95 – 1.10 USDT.
📈 Expected Move (Bullish Bias):
Short-term: Move above the “$$ same highs” to run liquidity.
Mid-term: Push towards first BSL (~0.75 USDT).
Long-term: Potential fill of the FVG zone around 1.00 USDT.
⚠️ Watch for:
“same highs” area (could be a stop hunt).

PI/USDT will fly to the next galaxy soonThis pair in the next couple of weeks will fly soon.
Good luck with the entries and leverage.
Cha-ching!!

Building Momentum After the Dump🧠 Idea Summary:
After a sharp drop, PIUSDT is showing signs of stabilization and recovery. Price is climbing along a short-term ascending trendline, supported by key Fibonacci retracement levels. Buyers are attempting to regain control above the $0.58–$0.59 zone.
🔍 Technical Highlights:
Current price: ~$0.583
Recent structure: V-shaped bounce from ~$0.50 lows
Key Fibonacci retracement levels:
0.382 – $0.545
0.5 – $0.558
0.618 – $0.572
0.786 – $0.592
Resistance to reclaim: $0.592 (Fib 0.786) and $0.617 (Fib 1.0)
Price is currently moving within a bullish ascending channel, showing higher lows.
🟢 Bullish Scenario:
If price holds the ascending trendline and breaks above $0.592, a move toward the full recovery zone at $0.617+ is likely. Sustained buying pressure above this level could lead to a trend reversal.
🔴 Bearish Scenario:
A breakdown below the trendline and $0.572 (0.618 Fib) would invalidate the current bullish structure. In that case, watch for support at $0.558 and $0.545.
📌 Conclusion:
PIUSDT is at a decision point. Holding above the trendline and reclaiming $0.592 would signal bullish continuation. This setup could offer a low-risk entry with a clear invalidation point below $0.572.

Pi Network at the cliff edge ?SInce there a lots of speculation about Pi coin, people are still doubt about it and beliving that Pi coin will bankrupt. No real CGV price USD 314,159 will be done somewhare 10 years ahead, the cummunity of Pi pioneers getting more weaker and no trust with the project.. Eventually Pi coin end like a shit coin dies in the blockchain space with no value. Floating in the space with tears and no hope.....
BUT !!
The awaitting news this 28th June 2025, will it change on more again? Or just a pity small news that no changes at all, like the Pi core team does when 6 years past, the project phase. Lies with lies.. and more lies ahead ? Just stay tune, keep mining, and no body realy knows what in the future.. Baba Vanga never told about Pi Coin, only the Simpson was telling about the Pi.

Piusdt I love the massive rejection from the candle stick we were expecting price to get to the zone den buy up and price didn't just get to the zone it brought out a sweet rejection so we are waiting for pi to change direction on the 4h then we buy

PI to 1.5$ ? :)Folks
Pi broke a major trendline on the 4H timeframe, and it's been crawling for a while.
This could be a preparation for a big rise!!
Buckle up, let's warm up the engines ;)
Good luck <3


Picoin scalp long to $0.6392Entered a picoin scalp long a while ago. TP $0.6393
Stop: $0.6233
Time sensitive
2RR
Market likely to retest internal 4hr HH point
