PIVX - about to launch!There is nice ascending triangle for PIVX. look for large volume breakout and enjoy the ride
1st Target Price =0.00043814
2nd Target Price = 0.0004657
Caution: Beware of any significant price increase or decrease in BTC as this will either delay the setup or make it invalid
PIVXBTC trade ideas

Pivx: An UpdateI am already in this trade at .00037. I forgot to update this chart when I saw this opportunity. Pivx has broken previous resistance, however, it has a stronger resistance to break. This trade has a big risk, therefore I wouldnt use a big sum of capital on this trade. As long as bitcoin doesnt rally tomorrow, I can see this trade being successful. Along with many other alt coins to rise. What are your thoughts?
Trade with care.


PIVX looking for a breakout soonWe have some signals PIVX is getting some momentum. This is confirmed by playing with the cloud resistance. I would recommend waiting for a stable entry point or buy the break-out at 0.00036 sats level. If we have to buy the break-out make sure to move stop up. PIVX in general breaks with violence and volatility. Goodluck

PIVX to .0025 to .004 ($45 to $72)Been watching this one a while. Many alts appear to want to break out. Keep an eye on her.

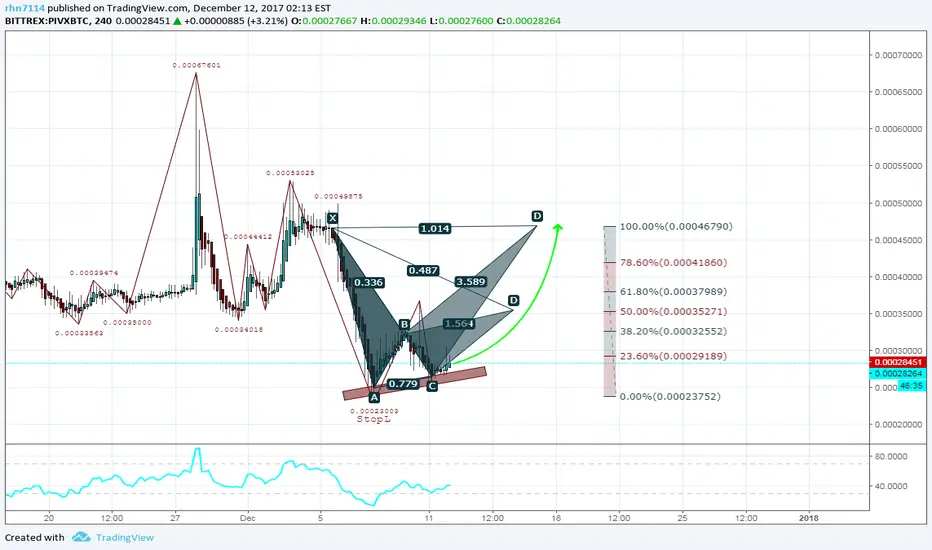
PIVX/BTC#Swing
#Pivx(PIVX)
Buy Zone :0.00027980-0.00028451
Sell Zone :1-0.00032552
2-0.00037989
3-0.00040309
StopL : 0.00023752
Timeframe :1 W

PIVX: Decision Time BITTREX:PIVXBTC has been moving down to the tip of the symmetrical triangle it formed over the last two day. Technical look bullish and support for this alt is strong so it is likely to be a break upwards (many altcoins are currently in a similar position). I don't usually pay a lot of attention to PIVX but recent news + price spikes + this triangle caught my attention. PIVX is likely a longer term hold but will yield consistent returns. Suggested entry on breakout. TP's on chart.


PIVX 1D Timeframe 3 December 2017PIVX, the privacy coin which I'm heavily in to. Pretty decent infrastructure and technical background on this one, heavily undervalued in my opinion.
But ok, let's go to the Technical Analysis. As we can see, PIVX had a huge spike at the end of April this year, resulting in a ATH of around 178K. After that it retraced back to the 0.236 level for three times. As we continue doing this analysis we can see a pattern coming for PIVX, which is the Elliott Wave in a descending triangle. The three bottoms around the 0.236 Fibonacci Level are the A, C and E waves. After that we can come to the conclusion that we'll see an ABC after this coming (after a ABCDE wave, you'll most likely see an ABC wave coming, which we've seen before with PIVX as well).
I'm expecting a pattern like the ones approached with the arrows. And if we see it, then we'll be seeing an pretty high ATH coming.
Will update this one weekly.

PIVX - Cup & Handle Formation. PIVX Is forming a cup & handle formation which is indicating a potential bullish trend, I would suspect that the price will consolidate at its current price for a couple of days until it punches through the resistances shown on the graph. However, we could break through the support which could send the value back down again, fortunately, I think we are more on the bullish trend and this is the less likely event to occur.
Orange - Resistance.
Pink - Support.

Pivx: Here Goes The TurkeySo I have had 2/2 on Pivx thus far. Lets see if I can get a Turkey. Lets get it!


PIVX/BTC short-mid term analysis | Compression Release PendingOverview:
Using the setup (detailed below) we see an emerging compression triangle over the next 1-14 days. The 7hr average is currently being compressed by a downwards BTC trend (orange line) and an upwards baseline support (green line). I expect trades to oscillate between this triangle for the next week before a major breakout emerges should PIVX 7 push past the 77hr and 231hr averaages. Currently, charts are showing downward trends for both 77 and 231. Should 7hr averages remain stable (or increase), expect a passing threshold around Dec 9th-10th. Upwards of 150k spike, with new floor around 70-75k Sats.
Using a new zero floor at this junction (around 40k Sats), we see some interesting patterns emerging. Extending Fibs (setting 1 at the previous high), we see the 786 intersect the upper Trend support (yellow line passing from nexus through the second junction of 7,77,231) around 150k sats. We also observe a potential new baseline support around the 236 (70k sats), which interestingly passes almost perfectly through the previous two intersections of 7,77,231).
CURRENT SETUP
I use a 7/77/231 hour of trends (7-white, 77- purple, 231 - white cloud).
Charting baseline support (~34k Sats)
Nexus Separation (7,77,231): 2/8/2017 1500 sats
First 7,77,231 intersection: 4/22/2017 127k sats
Second 7,77,231 intersection: 7/28/2017 75k sats
Third 7,77,231 intersection: 10/8/2017 75k sats
EST 4th 7,77,231 Intersection: 12/9/2017 40k sats
Downward BTC trend extends from Peak Price, and same trend placed through first 7,77,231 intersection. Notice the Path of 7 through this channel.
Upward Support extends from nexus to current 7 / baseline support intersection.

PIVX: I like to have my tea in private.Cup and handle for a small gain on pivx. Check my previous post on pivx before the pump and dump. What are your thoughts?
Trade with care.

Pivx: Long term play: 5 weeks.If you seen my previous post, you saw how I managed to enter and exit Pivx right when the pump happened. Well, I hope you don't miss out on this one too. The risk is little, but you can more than double your investments, if done properly. What are your thoughts?
Trade with care.


PIVXBTC Trade Idea !PIVX seems not done on the correction mode which has been doing. More down side is expected .

PIVX/BTC--> Nicely hold the trend line
--> Double top observation
--> Red lines demonstrates the previous behaviour, Blue lines are the expectation.
--> RSI will go up
My targets: Buying around 35k-37k range, Selling around: 62k-66k range.
NOTE: IF BTC WILL NOT MAKE ANOTHER ATH.

PIVX ideaLooks to be converging into the crosshairs of both a bullish downtrend and a very long term support
touches on this support have previously meant good reversals. we also have
- Bullish RSI trend
- Increasing volume

Pivx bullish divergenzeI noticed a bullish divergence, but noticed that the MASD did not make the cross up. I recommend waiting for the signal to confirm the idea.
Purchase 0.0004
stop-loss 0.00033
target 0.00053-0.00062
