XPTUSD COT data shows a rise in net short positions on platinum, indicating bearish sentiment from institutional traders. This suggests growing expectations of weakness in XPTUSD.
About Platinum (XPTUSD)
Platinum as an investment has a much shorter history in the financial sector than does either gold or silver, which were known to ancient civilizations. Experts posit that platinum is about 15-20 times scarcer than gold, on the basis of annual mine production. Because of this fact, platinum has nearly always tended to sell at a significant price premium to gold. More than 75% of global platinum is mined in South Africa.
The price of platinum changes along with its supply and demand; during periods of sustained economic stability and growth, the price of platinum tends to be as much as twice the price of gold; whereas, during periods of economic uncertainty, the price of platinum tends to decrease because of reduced demand, falling below the price of gold, partly due to increased gold prices.
The price of platinum changes along with its supply and demand; during periods of sustained economic stability and growth, the price of platinum tends to be as much as twice the price of gold; whereas, during periods of economic uncertainty, the price of platinum tends to decrease because of reduced demand, falling below the price of gold, partly due to increased gold prices.

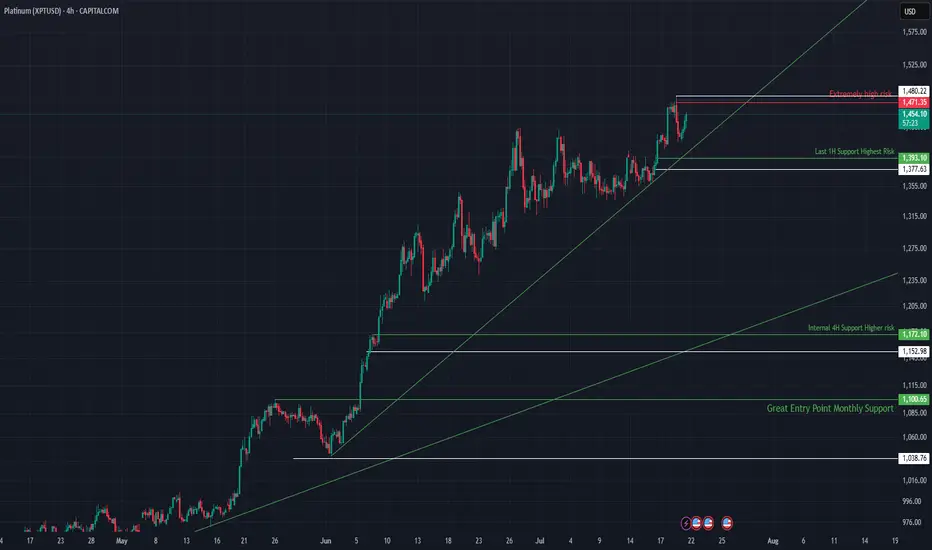
XPTUSD Consolidates Below Light Resistance Within Bullish Struct📈 XPTUSD Hovering Below Light Resistance, Structure Remains Bullish
Platinum is consolidating beneath a relatively light resistance zone after an extended rally, maintaining a strong bullish structure supported by rising trendlines and stacked demand zones. With price action still above key support
Platinum SellI'm taking this sell trade on platinum because, after a strong three-month rally, the price has now reached a key resistance zone that has historically seen significant selling pressure—most notably back in August 2014. Given the extended bullish move and the fact that we're approaching a major supp

Platinum Wave Analysis – 23 July 2025- Platinum reversed from resistance zone
- Likely to fall to support level 1350.00
Platinum recently reversed down from the resistance zone located between the round resistance level 1500.00, upper daily Bollinger Band and the resistance trendline of the daily up channel from May.
The downward rev

Platinum drops after NFP beat: Is it time to buy the dip or waitPlatinum bounced after a sharp correction but it is not sitting at a major support level. With NFP data stronger than expected and unemployment dropping, the dollar could rise—but momentum in platinum is still holding. We explore two setups: early dip buying and a safer breakout trade above the rece

My high win rate scalping strategySimple, I use leverage and bet on bart patterns completing only. 8/10 scalp win rate

Possible target ~$1800Platinum is breaking out on weekly and daily time scale our of ascending triangle and channels with big volumes.
multiyear breakout possible with high certainty as geopolitical situation will change the things for long as low trust environment (which is not new) but now with attack on Iran, and Ukra

Fatty Platty PattyPlatinum
Is it time, Sir?
bodl and hodl thx
Look, Sir, chart description must be satisfying some certain minimum character limit. Therefore I tell you, buy Sir, buy. Based on this one descending line, Sir. We are in breakout mode, Sir, with confluence of averages most beautiful, Sir. The time fo

XPTUSD 1W:While Everyone Watches Gold, Platinum Quietly Wakes UpGold gets the headlines — but platinum just broke two years of silence with a clean, high-volume breakout from a symmetrical triangle on the weekly chart. And this isn’t noise — this is the structural shift traders wait for.
Price has been coiled inside a compressing wedge since early 2022. Equal h

Platinum trade review and new setupLast week we called the dip in Platinum. In this video, I break down how the trade idea played out, the different ways you could have entered, and what to watch next. We also look at the weekly chart, Fibonacci levels, and key support zones to prepare for the next move. Still bullish, but execution

See all ideas
Displays a symbol's price movements over previous years to identify recurring trends.