XPTUSD REJECTS SUPPORT. LONG TRADEI am going long on XPTUSD after seeing a bullish doji form on the 12 hour chart. This is also a Daily level and I am going to target previous resistance.
PLATINUM trade ideas

xptusdthis is an update for the previous analysis, i believe as you see in the chart its a bullish signal, and we can long from here.
however, trade carefully.
good luck.

XPT/USD updateI think this is Wave C correction, after a sell signal appears as in the chart, this scenario will Fail if the price closes above 1035.
please correct me if am wrong.
Trade carefully.

xpt/usdThis what I expect for xpt/usd , its a correction for a while. please correct me if you think am wrong.

Updates: Gold, Silver and PlatinumPositive follow-through following our recent flags.
Gold: Massive move lower from 02 June where I flagged the 200-day starting to slope down while suggesting the reward-to-risk not being attractive on the long. From the time of publication to Monday, we saw a $200 price decline. Possibly some big selling during Monday's Asian session.
Silver: I suggested closing the prior short however the strong selling continued, with the price declining from $27 to $22.
Platinum (Part 1 and 2)
Part 1: In May I highlighted the bear flag via my research which played out as the price decline from $1200 to this week's low of $968.
Part 2: Most recently I also had an idea to go long above 1063 however that level never triggered as the price continued to decline on the back of a stronger USD.

PLATINUM - Potential Bullish Reversal!Hello everyone, if you like the idea, do not forget to support with a like and follow.
PLATINUM is sitting around strong support in green so we will be looking for buy setups.
Before we buy, we want the buyers to prove that they are taking over again.
You don't want to buy a bearish market right?
on H1: PLATINUM is forming a channel in orange but the upper trendline is not valid yet, so we are waiting for a new swing high to form around it to consider it our trigger swing. (projection in purple)
Trigger => Waiting for that swing to form and then buy after a momentum candle close above it (gray zone)
Meanwhile, until the buy is activated, PLATINUM would be overall bearish can still trade lower till the 900.0 support before going up.
Good luck!
All Strategies Are Good; If Managed Properly!
~Rich

Platinum short platinum made head and shoulder on monthly analysis.
we should see more downtrend in the next couple of weeks.

XRP / Platinum (INTRADAY!) - SHORT tradeHello traders,
New trade is ready for a setup! Potentially pretty big trade.
We saw platinum making a bearish moved continued by a bullish pullback, slow movement.
Now we saw a H&S develop to confirm our bearish intentions on the structure that this pair made.
Lets wait for our indicators to check for the entry.
Kind regards@

PLATINUM a move to 1000 🦐PLATINUM on the 4h chart is currently testing a daily support.
The market after the break of the ascending channel is testing a potential neckline.
According to Plancton's strategy if the price will break below we will set a nice short order.
–––––
Follow the Shrimp 🦐
Keep in mind.
🟣 Purple structure -> Monthly structure.
🔴 Red structure -> Weekly structure.
🔵 Blue structure -> Daily structure.
🟡 Yellow structure -> 4h structure.
⚫️ Black structure -> <4h structure.
Here is the Plancton0618 technical analysis , please comment below if you have any question.
The ENTRY in the market will be taken only if the condition of the Plancton0618 strategy will trigger.

XPTUSD trend analysis updateXPTUSD has reached a position for a short-term technical rebound. Please confirm breaking through the 4 hour resistance.

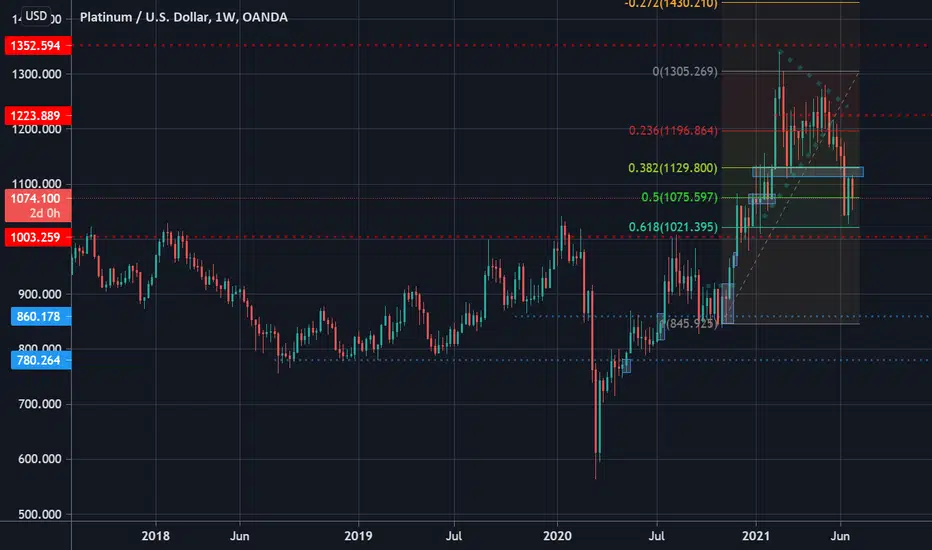
2021-08-02 XPT USD - support61.8% fib retracement from last weekly swing high.
Price is looking to backtest a clear trendline around 1,000.
All hands on deck to go long

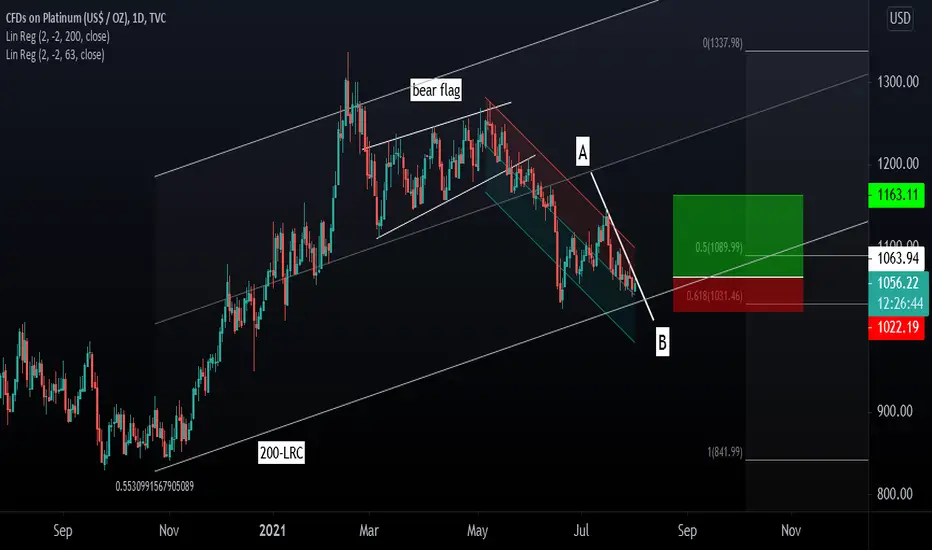
Platinum/Aberdeen Standard Physical Platinum Shares ETF (PPLT)At current levels, the reward-to-risk for a buy/long on Platinum is starting to appear compelling.
Time Frame: Medium Term
The bear flag we highlighted in May has fully 'played out', with the commodity now being 21% off its YTD high. At current levels, it is trading at levels of interest, that being:
- The lower boundary of its 200-period linear regression channel.
- The 61.8% Fibonacci retracement level, of which the current test of the zone is the second in the last 6 weeks.
A 'conviction candle' above line A_B would suggest a reversal of trend, from bearish to neutral and then possibly bullish.
Provisional Levels:
Buy on break of line A_B (approximately above $1063 from current levels)
Stop-loss: $1022
Target: $1163
Current: $1054
Exposure also possible via the Aberdeen Standard Physical Platinum Shares ETF (PPLT)

PLATINUM VS PLGLooks like $XPTUSD is outperforming $PLG. $PLG has catching up to do and that shows in a recent 10% run #platinum #gold #silver

XPTUSD About to confirm a bullish break-out.Pattern: Bullish Megaphone on 1D.
Signal: Buy as the RSI broke above its Lower Highs trend-line. For a stronger confirmation you may wait for either a break above the 1D MA50 (blue trend-line) or the Lower Highs trend-line of the price since the February 16 High.
Target: Either the 5.0 or 6.0 Fibonacci extension.
** Please support this idea with your likes and comments, it is the best way to keep it relevant and support me. **
--------------------------------------------------------------------------------------------------------
!! Donations via TradingView coins also help me a great deal at posting more free trading content and signals here !!
🎉 👍 Shout-out to TradingShot's 💰 top TradingView Coin donor 💰 this week ==> Ether2020
--------------------------------------------------------------------------------------------------------

PLATINUM (update every week)three possibilities:
- sideways into range (purple zone)
- ascending channel rising into grand ascending channel
- break drown and the correction extends below $1050

SILVER a turn at the 0.618 🦐SILVER after the last bearish impulse retraced at the 0.618 first and then retested the 0.5.
Now the market is approaching daily support and according to Plancton's strategy if the market will break below we will set a nice short order.
–––––
Follow the Shrimp 🦐
Keep in mind.
🟣 Purple structure -> Monthly structure.
🔴 Red structure -> Weekly structure.
🔵 Blue structure -> Daily structure.
🟡 Yellow structure -> 4h structure.
⚫️ Black structure -> <4h structure.
Here is the Plancton0618 technical analysis , please comment below if you have any question.
The ENTRY in the market will be taken only if the condition of the Plancton0618 strategy will trigger.


2021-06-30 PLATINUM - Support areaPlatinum consolidating around the 61.8% retracement of last upswing.
Weekly resistance level now turning into support.
Looking for long entries in July on daily chart