XPTUSD - BEARISHXPTUSD is exhausting right now there are many reason to keep an eye on this instrument as sentiments a bearish pattern and a strong resistance is lying at the current top. Moreover if XPTUSD test the resistance and then a new lower low comes to existence the entry would be more relying. So I might a little at least 2 things to sync the a lower low and the résistance to be tested. Thanks
PLATINUM trade ideas

PLATINUM XPTUSD Bearish Robbery Plan to make money 🤑💰Hola Platinum Robbers,
This is our master plan to Heist Bearish side of PLATINUM XPTUSD market. kindly please follow the plan i have mentioned in the chart focus on Short entry, New entry traders pls enter only in pullback of smaller timeframe then enter to rob the money. Our target is Green Zone that is High risk Dangerous area Consolidation will happen. Be safe and be careful and Be rich.
Loot and escape near the target 🎯
support our robbery plan we can make money take money 💰💵 Join your hands with US. Loot Everything in this market everyday.

XPTUSD has cross-over and shows short opportunity XPTUSD has broken its bottom trendline with a 3 EMA crossing over the 10 EMA to the downside. At the same time we're getting the EMAs crossing over the Stochastic is heading down and crossing over the 50% mark giving three confluences to look for shorts
Ill be targeting a 1% move down underneath a support i have drawn out on the 4H chart

More downside for XPTUSD (Platinum)XTPUSD has been rallying ever since it broke out of its two week sell off a couple days ago but there are now signs showing that the upward momentum could be coming to a end.
Technical : The 3 EMA is crossing over the 10 EMA to the downside while at the same time the Stochastic is crossing the 50% mark to the downside as well. These Bearish confluences are happening while we are nearing the bottom Trendline, making a breakdown higher probability. Target a 1-1.5% move down from your entry/break

XPTUSD SetupThis is my Setup to go LONG on XPTUSD . Market is bullish and given a CHoCH on 1 hour time-frame so we expect market to mitigate our extreme POI in this case and then continue move upward. Traders may look for LTF confirmation on 5 mins for entry.

4H XPTUSD (Platinum) Long waiting on retestXPTUSD has broken the Bullish (TOP) Trendline after multiple (5) touches, we dont have a clear safety line to give us a stop loss so i wont enter of the initial break. Im going to instead wait for a retest of the Bullish Trendline we'd just broken, Waiting allows me get a better idea of the breakout to see if its just trying to fake us out. If this bullish situation plays out ill be targeting Resistance above at 943.95.

XPTUSD Strong Higher Low buy opportunity. 1D Golden Cross formedPlatinum (XPTUSD) gave us an excellent bottom buy signal last time (March 13, see chart below), as the metal entered a Channel Up pattern following the bottom just below 880.00:
Currently we are on the 2nd Bearish Leg of the Bullish Megaphone pattern that emerged and will complete a Golden Cross on the 1D time-frame today. As per the December 02 2023 Golden Cross, which was formed after a similar rebound, but on a more aggressive Channel Up instead of a Megaphone, we should be expecting another Higher High near the 1.382 Fibonacci extension. Our Target is 1060.
-------------------------------------------------------------------------------
** Please LIKE 👍, FOLLOW ✅, SHARE 🙌 and COMMENT ✍ if you enjoy this idea! Also share your ideas and charts in the comments section below! This is best way to keep it relevant, support us, keep the content here free and allow the idea to reach as many people as possible. **
-------------------------------------------------------------------------------
💸💸💸💸💸💸
👇 👇 👇 👇 👇 👇

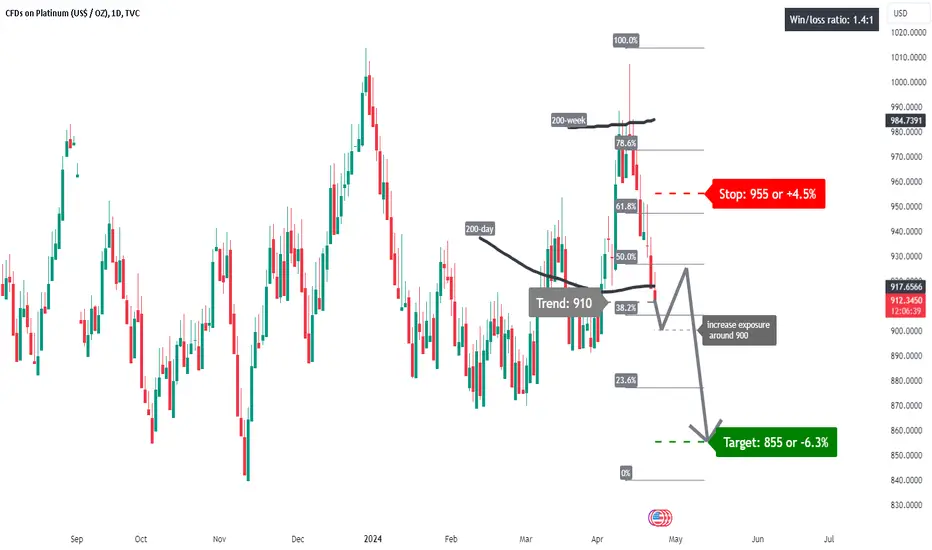
Platinum $: re-test of the 200-day?A price action below 910 supports a bearish trend direction.
A price action below 900 supports further downside potential.
The stop-loss price is set at 955 (just above its 61.8% Fibonacci retracement level).
The profit target is set at 855.
Crossing below its 200-day, might initiate a re-rest of its 200-day and then a leg down.
XPTUSDT - Down TrendXPTUSDT Chart is printing Bearish Engulfing Candle with Bearish Divergence and price rejected from 2nd resistance.
Therefore I'm doing short from here at market price.


Platinum- Can it Bridge the Gap with Gold?For the past 10 months, OANDA:XPTUSD has been trading within a range between approximately 850 to 1000.
However, upon closer examination of this range, it appears to resemble a rounded bottom formation and also after dipping below 900 at the beginning of March, Platinum has been establishing higher lows, suggesting that the price is ready for a strong rise.
Conservative traders may want to consider waiting for a break above 1000.
In such an instance, the price could potentially accelerate and reach 1300 in the medium term.
On the other hand, more aggressive traders could opt to buy dips near 950.
With a stop loss set below 850 and a target of 1300, this strategy could potentially yield a risk-to-reward ratio of more than 1:3.

PLatinum Quick Video Idea - -2024.04.08EASYMARKETS:XPTUSD
Disclaimer:
easyMarkets Account on TradingView allows you to combine easyMarkets industry leading conditions, regulated trading and tight fixed spreads with TradingView's powerful social network for traders, advanced charting and analytics. Access no slippage on limit orders, tight fixed spreads, negative balance protection, no hidden fees or commission, and seamless integration.
Any opinions, news, research, analyses, prices, other information, or links to third-party sites contained on this website are provided on an "as-is" basis, are intended only to be informative, is not an advice nor a recommendation, nor research, or a record of our trading prices, or an offer of, or solicitation for a transaction in any financial instrument and thus should not be treated as such. The information provided does not involve any specific investment objectives, financial situation and needs of any specific person who may receive it. Please be aware, that past performance is not a reliable indicator of future performance and/or results. Past Performance or Forward-looking scenarios based upon the reasonable beliefs of the third-party provider are not a guarantee of future performance. Actual results may differ materially from those anticipated in forward-looking or past performance statements. easyMarkets makes no representation or warranty and assumes no liability as to the accuracy or completeness of the information provided, nor any loss arising from any investment based on a recommendation, forecast or any information supplied by any third-party.

Continuation upside move and a break of this daily level?As we start a new week, we seem to be ascending to the upside and potentially testing the daily resistance level (934) again. Whoever said XPT is correlated with XAU, I don't see it. Weekly time frame, still scream a slow bear trend for me. Hence why I'm still looking for a long term bear play. For now I will ride up this uptrend for now

Plat, time to join the party with gold and silver.Gold is leading the gains in the basket of precious metals and it is only a matter of time before the rest of the metals follow and break higher. The move higher in precious metal prices is immensely rand positive but we will have to see platinum come to the party for sustained rand gains before the local elections. Platinum has broken above the 50-day and 200-day MA’s and it is looking set to test the 61.8% Fibo rate of $957 per ounce and the major downward trend line in the days to come if it maintains levels above $915 per ounce.

XPTUSD Monthly Chart Symmetrical Triangle - Play on BreakMonthly Chart Symmetrical Triangle
Break of 8030 or 1030 will create a strong trend
As of April 2024, trend is positive for XPTUSD
being green 70% for April last 10 years and testing
bottom of the symmetrical triangle and nearing monthly support
Can buy dips down. As long as 850 holds can play long if it breaks, switch bias

Descending trend?Hope all is well traders! As we observe XPT on the hourly, I do see a descending trend line here. As it continues to create lower highs, the past couple hourly candles have been very flat. We can possibly see it climb up toward 903.69 or even up to 905 (top of the trend line) But I'm aiming for the long term short on here and break below the 891 support.

XPTUSD - IN BEARISH TRENDXPTUSD is trading in bearish trend in 4hr time frame as it is showing lower highs lower lows and confirmed by the formation of Bearish Engulfing Candlestick.

A rally back up to create this downtrendAs we observe XPT break the ascending TL on the 4h. It has tested the weekly resistance and has reversed the trend. I'm looking for it to rally back up at 927 to potentially create a lower high.


Are we going to continue to moon? As we observe the hourly, we have created a slightly higher high. Like I mentioned on my last analysis, we're in a nice uptrend on the 4h. Zoom in the smaller time frame, it seems to be ranging around the 942 and I would need it for it to crack above for a buy. If it doesn't, we might see a pullback

XPTUSD broke above the 1D MA200 and is ready to rally.Platinum (XPTUSD) broke above the 1D MA200 (orange trend-line), and being on 1D RSI Higher Lows, we may be having a strong rally in its early stages. At least this is what the very same Higher Lows RSI pattern has led to when Platinum made the very same 1D MA200 break-out on October 26 2022.
The result was a +28.50% instant rally from the bottom and then a finaly blow-out just below the 1.382 Fibonacci extension. As a result, we are bullish on Platinum targeting a minimum at 1060 (sub 1.382 Fib), even though it may very well reach the upper (red) Resistance Zone.
-------------------------------------------------------------------------------
** Please LIKE 👍, FOLLOW ✅, SHARE 🙌 and COMMENT ✍ if you enjoy this idea! Also share your ideas and charts in the comments section below! This is best way to keep it relevant, support us, keep the content here free and allow the idea to reach as many people as possible. **
-------------------------------------------------------------------------------
💸💸💸💸💸💸
👇 👇 👇 👇 👇 👇

Continuation to this steep up-trend We approach the previous daily highs @ the 932. 4h shows a continuation uptrend so we might see a test and potential breakout of this daily high.

XPTUSD Bearish Divergence Hourly Chart - Sell on RetracementPlatinum has been trading in a range on hourly and 4 hour chart
Hourly Chart Bearish Divergence
Sell on retracement to 0.382 fib level
Stop Loss set above the highs and
TP set with 1:1 ratio and previous resistance
turned support
