PLNUSD trade ideas


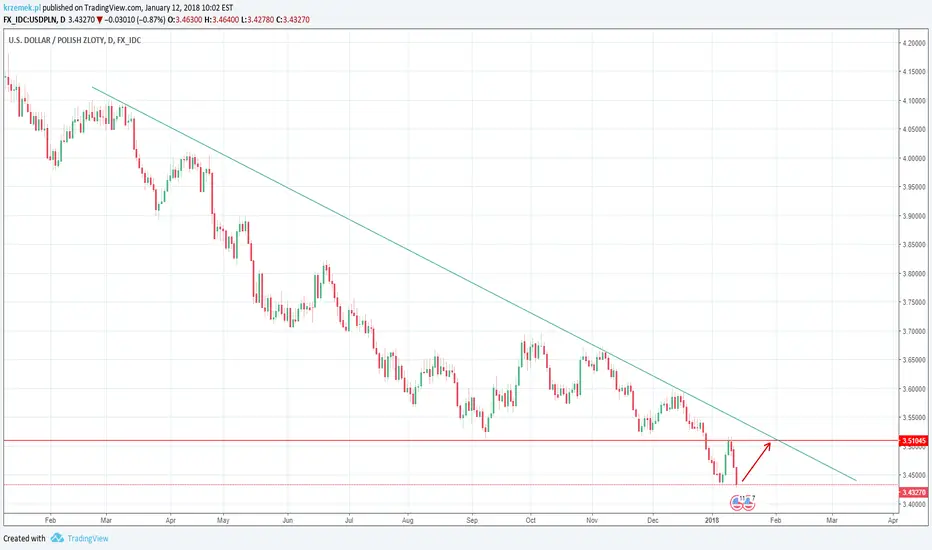
BUY opportunity on USDPLNWe just forced down trend line on D1 chart. Next strong resistant on 3.50900

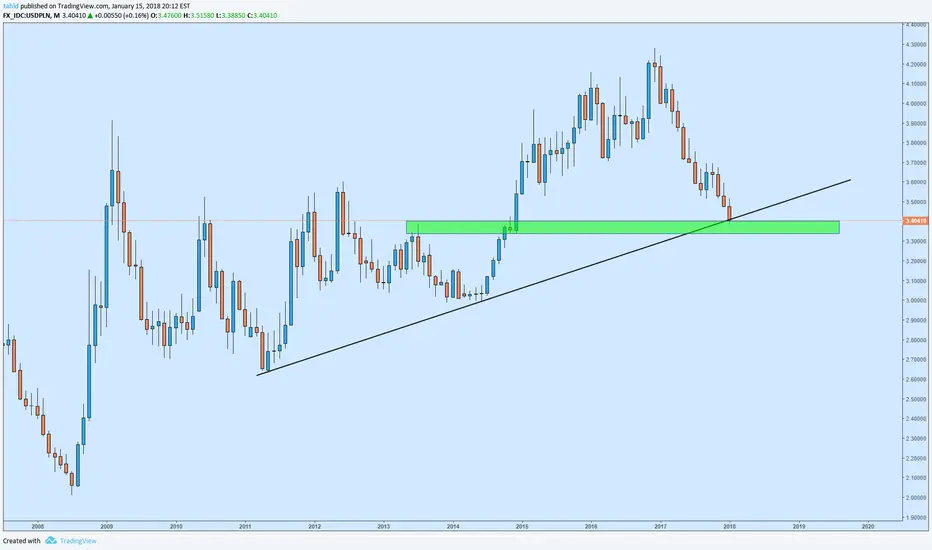
USDPLN, just touched the top of downtrend channel. SHORTBuy in 3.445, target 3.3880 , stop loss 10%.
Moreover I think the new uptrend channel is forming so there will be long opportunity , the formation will depend on tomorrow news at 10 o clock (I will update the information)
Thank you and good luck
Learning don't invest.
USD/PLN 1H Chart: Trades in triangleThe US Dollar has diminished its trading range against the Polish Zloty within the last few months, thus forming a medium-term triangle.
After bouncing off the lower boundary of this pattern last week, the pair has entered a minor period of consolidation towards the senior channel located near the 3.42 mark. It is apparent that the pair has been reluctant to edge higher during the last three trading sessions. This might suggest that a test of the senior channel could be followed by a decline, as supported by technical indicators on the weekly time-frame.
In case the channel line is breached to the upside, the pair is likely to find resistance near 3.44 prior to approaching the bottom triangle line. A possible downside target for the following two weeks could be the monthly S1 at 3.3450.

USD/PLN 4H Chart: After breaking long term trendsThe large fundamental changes in the strength of the US Dollar have caused a massive change of direction on the USD/PLN currency pair’s charts. Namely the decline in the US equity markets and the shift in the US monetary policy combined broke the resistance lines of all of the dominant patterns of the USD/PLN.
Due to that reason Dukascopy analysts set Fibonacci retracement levels and trend lines to the recent surge.
It was discovered that the pair is trading in two ascending channels. Meanwhile, the pair has made a retracement near the 23.60% Fibo. Due to that reason beware near the next retracement level.

USDPLN Bullish For more setups Please follow my page on facebook (FX Exclusives PIPS Generator)
or join the free channel on telegram t.me

USD/PLN 1H Chart: Pair stopped by senior channelUSD/PLN is trading in two channels which are guiding its movement. During the past six weeks, the Greenback has been trading sideways in the 3.3085/3.4330 area. Its latest movement upwards, however, was disrupted by the senior channel near the 3.40 mark, thus sending the US Dollar for a minor period of decline.
It is likely that this dominant pattern, reinforced by the 55– and 100-hour SMAs, the 23.60% Fibo retracement and the monthly PP, pressures the rate even lower during the following sessions. A possible downside target is the 3.36 level where the 200-hour SMA is located.
However, the pair should eventually gather enough bullish momentum to approach the upper boundary of the junior channel near 3.4340.


USD/PLN 1H Chart: Gradual recovery from many-year lowThe US Dollar has been trading against the Polish Zloty in a descending channel since November, 2016. The bottom boundary of this long-term pattern was tested on January 25 near 3.31—level which also marks the lowest point since mid-2014. The pair has since edged higher; however, it has failed to move away from the senior channel.
Meanwhile, the pair’s latest wave down has been bounded by two medium-term channels, the most junior of which was being tested today. The pair is expected to make another decline in this session, as a breakout north is likely to be hindered by the combined resistance of the 100– and 200-hour SMAs and the weekly PP circa 1.3430.
However, the bullish sentiment should eventually take over the market, thus allowing for the US Dollar to test a channel line in the 3.38/40 area and subsequently move towards the upper boundary of the most senior pattern.

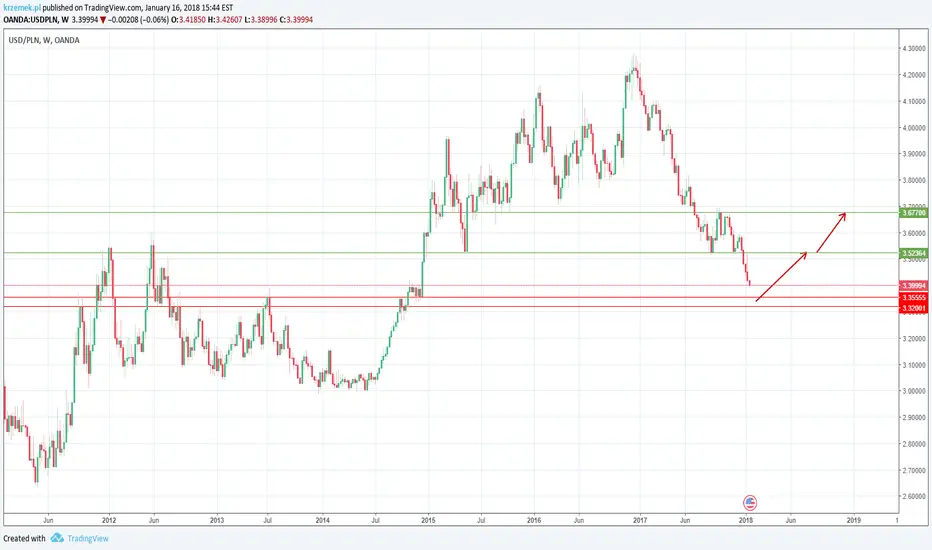
Long from very strong support zoneI will look for price action signal to buy for longer time USDPLN at least to 3.52 or maybe longer. It is now going to very, very strong support.
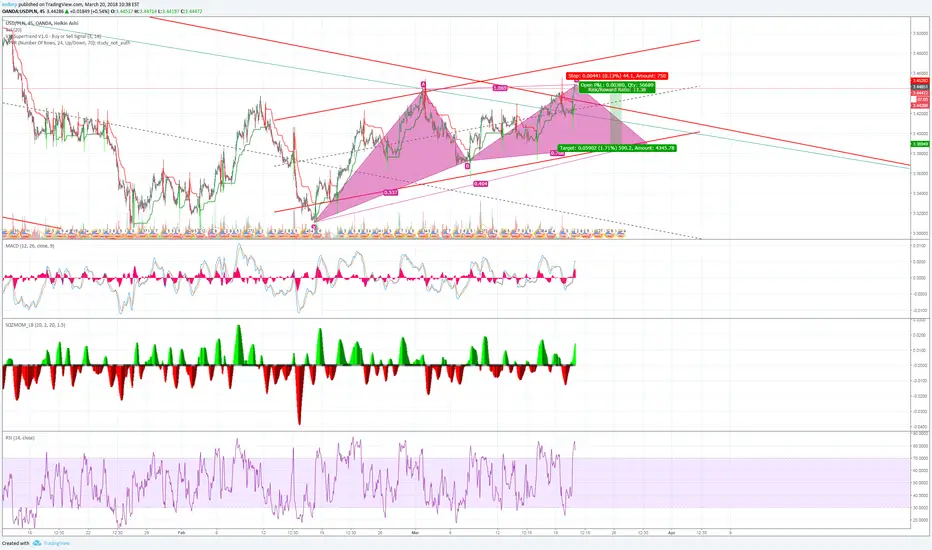
bearish gantlet usdpln d leg still not complete I think this is forming a bearish gartley on the h1 I plan on riding out D leg and then fib from AD to for my short position I will be updating and possibly posting the short upon completion..
thanks comment, critique
still perfecting my craft so anything is helpful thanks.


Possible sell on USDPLNPossible return to mid term down trend as we reach resistant area- previous strong support tested multiple times. SL: above 3.51100

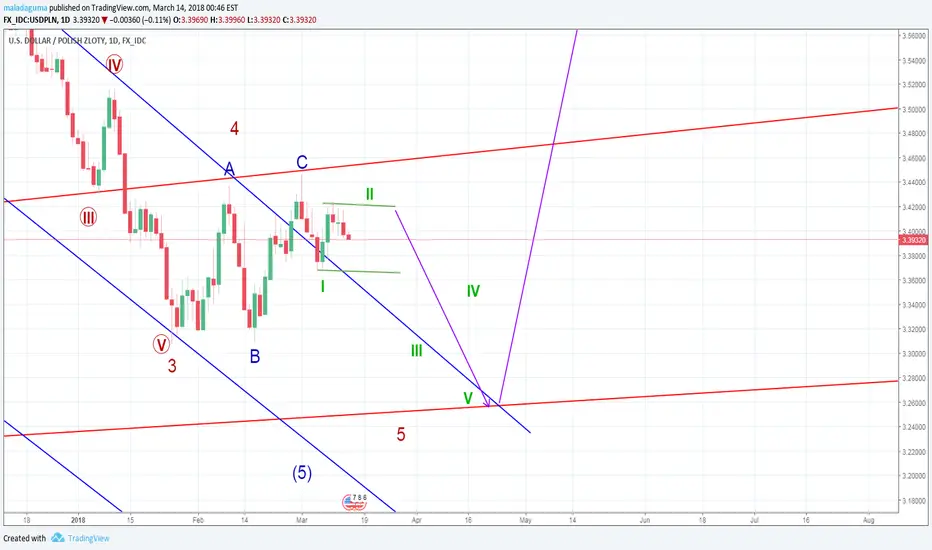
2018 could be a bull year for USD - long term viewThis is deciding point for USDPLN pair. First signs of potential reversal at the bottom of the channel are visible on the lower time frames.


USD/PLN 4H Chart: Highly volatile surgeThe US Dollar is surging against the Polish Zloty in a highly volatile manner. The pattern, which is considered the junior one, has had its both trend lines touched even during a daily timeframe.
However, recently the currency exchange rate has been beaten down by a resistance cluster, which does not include the upper trend line of the ascending channel. Due to that reason the various resistance levels just above the 3.59 mark need to be watched closely.
Most likely the rate will pass them eventually, as the pair is being supported by the 55-hour simple moving average.

USDPLN Short SummaryTrading method: RSADVANTAGE Stage 5, 95% accurate system manually forward tested over 3 years designed to stay out of ranging markets and only target strong trends. This system is made of custom technical indicators that properly detect trends very early and provides exit signals at the possible dynamic S/R zones. Average yearly pips gained is 40k per pair on D1 charts alone.
USDPLN
Technical Outlook
To open SHORT positions for USDPLN , it is required:
In this situation for Awesome Osci to go into negative territory alongside of our other system indicators to confirm trade entry confirmation for movement to the downside and but if the market trend continues to range this signal will become invalid. Market execution for entry, I will confirm signal once the conditions have been met but for now I have entered a small lot position at 3.58208.
Risk Description: Once signal is confirmed 108 pips will be up for grab with small risk SL at swing high.
Profit expectations: 1-2 day trade length expected before hitting profit target I will post exit strategy when signal receives a exit signal.

Decreasing wedge pattern / Patrón de cuña decrecienteActivity of technical analysis positions in tradingview,
In the forex market,
Activity 6. Increasing or decreasing wedge pattern
in this case a decreasing wedge pattern is anticipated,
a short is recommended,
a bounce was generated, however the decreasing trend is maintained
Confirmation indicators used:
the resistance and support lines are clearly identifiable,
and the support line, becomes resistance line
Bollinger Bands: The mobile average confirms the decreasing trend
-------------------------------------------------------------------------------
Actividad de posiciones de análisis técnico en tradingview
En el mercado de divisas,
Actividad 6. Patrón de cuña alcista o bajista
en este caso, se anticipa un patrón de cuña decreciente o bajista,
se recomienda un corto,
se generó un rebote, sin embargo, se mantiene la tendencia decreciente
Indicadores de confirmación utilizados:
las líneas de resistencia y soporte son claramente identificables,
y la línea de soporte, se convierte en línea de resistencia
Bandas de Bollinger: el promedio móvil confirma la tendencia decreciente
Alexis Contreras
Student / Estudiante Tecnologia_Financiera
