PONDUSDTThere is a large side area extending to 490 days inside the body of a weekly candle that has not been broken yet. If its peak is broken and the top is closed, the market will go to the shaded area above
The analysis fails if it closes below the weekly candle
Please clarify that I am helping you with my point of view, which may be right or wrong, and see my previous analyzes of many currencies and forex in order to judge the owner of this analysis with a more accurate look
Good luck
PONDUSDT trade ideas

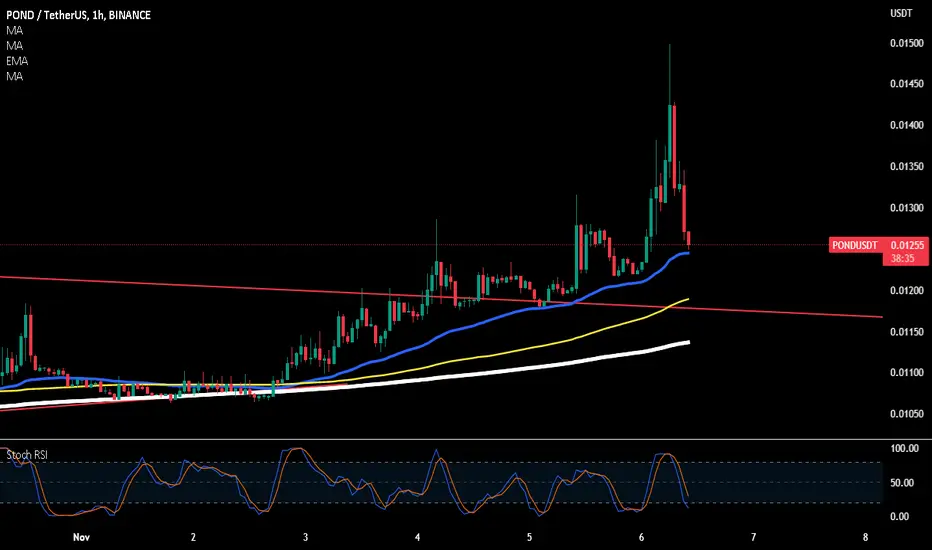
POND (strong move expected)POND / USDT
price in accumulation zone since 16 months
And also approaching major trend resistance
Potential breakout soon .. so keep your eyes on it

Pond Analysis Pond Getting Some volume & Showing Interesting Picture Here Testing Major We Have Two trendline Near & Expecting test Of them If both Got cleared Pond Can Recover Massively In Coming Weeks Expecting 200%+ bullish rally incase Of successful breakout

PONDUSDTPONDUSDT is in bullish phase printing HH and HL.
NO sign of reversal from here.
We wait and watch for the breakout of last HH.

PONDUSDT Demand Zone Formation and 50% Upside Potential 📊💎 #PONDUSDT formed a potential bottom on June 10, followed by an impressive 83% price surge. During its upward movement, #POND confidently broke above the downtrend trendline, indicating a possible shift in the long-term trend. However, after bouncing off the supply zone, #PONDUSDT experienced a significant pullback, with the price correcting down to the 78.6% Fibonacci retracement level at $0.0078.
💎 What's intriguing is the precise bounce off this Fibonacci support, accompanied by a clean rebound from the uptrend trendline. Consequently, a demand zone has been established, and as long as a new lower low is not formed, we can anticipate further upside, with a retest of the supply zone near the 78.6% Fibonacci resistance.
💎 Once/if our upside target is reached, a gain of over 50% will be achieved. Overall, the risk-to-reward ratio for buyers looks favorable, and the MCP team is eagerly awaiting the opportune moment to join this bullish journey.

PONDUSDTPONDUSDT is trading in expanding bullish parallel channel. currently the pair is forming a strong support withing channel and also the pair is trading above 50EMA which is also a bullish sign. Will the price give another bullish impulse?

Pond is ready for growth Pond found support exactly at 0.382 fib level, although it might retrace further with btc aiming to $30.000 the breakout and reclaim of one penny is just the start of this sleeping giant

Pond - breaking outAfter a massive correction and a very long accumulation TSXV:POND is ready to breakout
The obvious targets are when you just look left but really this thing can explode massively imho and I don't know at what scale
BTC is looking good,LUNC started the bull run
I'm buying here 100k pond

PONDUSDTPONDUSDT is Bullish phase there is no divergence shown in RSI which indicates trend is continue if it,s break first HH then may be it will hit TP2

#POND/USDT - Long - Potential 17.48%Direction: Long
Market: Spot | Futures
Risk: 0.25% - 1%
#USDT_POND
Exchange: BINANCE
Timeframe: 360
TP1: 1344
Entry: 1146
STOP: 1035
Entry Conditions:
| Volume spike
| Resistance break
| Support formed
| 200MA break
Left this alert this morning following the bad news from the Bank of England. Chancing it now as BTC's mini correction has given a much better entry.


POND/USDT Analysis with targets LONG!Buying some POND here
Fundamentally strong project, has given us great profit during previous rally.
At the moment it is consolidating in a tight range for a long time. Broke the $0.01$ resistance, took hold above and now forming a Falling Wedge.
Worth buying, but be careful. Bitcoin can ruin the setup partially.

PondsusdtTesting Trendline In Daily Timeframe
Incase Of breakout Expecting Massive Bounce Entry would Be valid after Breakout
Safe sl can be Placed Below Falling Wedge
note always wait for confirmed breakout

PONDUSDThey,i think pond will jump as the drawing ,what do you think i'm waiting your comment
good luck for all

$Pond- updatebelow the 200 and grinding on up the red line is the weekly downtrend line so should be a biggie
flipping this and breaking out should cause this to accelerate till then we chop

$POND- watchlistattempting to reclaim the 200 on the H4 depending on where we close today decent punt long with invalidation below that
IF not btfd on this should reclaim 200 soon
sort of at key level here as you can see its got a fair bit of resistance overhead
50 ema first flip then 99 and 200 before clear skies
thinking buy on confirmation or flip of yellow line

$pondif anyone wants in ..now's the time
pullback to breakout area
refer to earlier chart for htf targets
monday open flush possible before up
$POND will touch 1200 before October 9thBought $POND Yesterday on spot @1050 after the over 50% pumping of BTS, an asset which relates well with POND. Watch out on this coin, it is highly undervalued.


POND is Ready PONDUSDTPond is one of the few bullish charts currently in the crypto space.
Looks ready to breakout of the down sloping resistance trendline.
Buy signal has been triggered across multiple time frames. Expecting a large move soon. Ive just secured a spot position.

$pondlooks ready to go for range high
break that which it should we see a decent pump
remember this one has got battered down so the 1st impulse should be nice

$PONDalmost retraced to the 200 on the H4 also confluent with range low ..
recon this starts moving soon .
