$POPCAT – Patience Before the Pounce
BYBIT:POPCATUSDT holding up well—expecting a move after 2 weeks of ranging.
Starting to slowly scale in around 30c and under (if you haven't already).
Will reassess if 24c is lost and stays below for too long.
Still targeting $1 if momentum kicks in.
POPCATUSDT trade ideas

POPCATUSDT – Breakout Confirmation or False Signal?On the daily chart of POPCATUSDT, the price has recently broken out of a descending trendline that has been acting as resistance since December 2024. This breakout signals a potential trend reversal from bearish to bullish.
Currently, the price is in a retest phase, revisiting the breakout zone, which also aligns with a strong support and Fibonacci retracement area:
Support zone: $0.34 – $0.38
Fibonacci 0.618: $0.3490 (major technical support)
Fibonacci 0.5: $0.3759 (typical retest level after breakout)
If the price holds above this zone and forms a bullish confirmation candle, it strengthens the case for continued upward momentum.
---
Pattern and Market Structure:
Descending Triangle Breakout: The price has broken out of a long-standing descending triangle pattern, which is typically a bullish reversal signal — especially if supported by volume (not shown in chart but crucial).
Neckline Retest: The current move is retesting the breakout zone, a common behavior after significant breakouts.
---
Bullish Scenario:
If the price holds above the $0.34–$0.38 zone and forms bullish price action:
Potential targets based on Fibonacci levels:
Target 1: $0.5665
Target 2: $0.7254
Target 3: $0.9358
Major targets: $1.2247 and possibly $1.6029 if bullish momentum sustains
---
Bearish Scenario:
If the price fails to hold above $0.34 and breaks down below the support:
Potential downside towards $0.26 – $0.20 zone
If selling pressure intensifies, it may revisit the key support low around $0.1178
---
Conclusion:
POPCATUSDT is at a critical decision point. The breakout from the descending trendline is an early bullish signal, but confirmation from the $0.34–$0.38 retest zone is essential. If it holds, a strong bullish rally may follow. However, a failure to hold could signal a false breakout and resume the bearish trend.
#POPCAT #POPCATUSDT #CryptoBreakout #AltcoinAnalysis #ChartPatterns #TechnicalAnalysis #FibonacciLevels #CryptoTrading #BullishSetup #BearishScenario

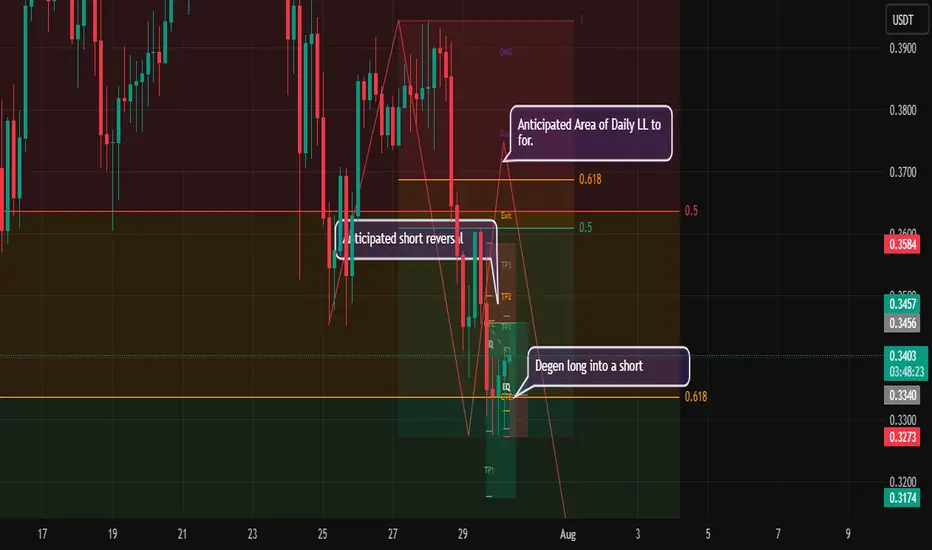
Week#3_July Wrapping_Trade #6 of week#3. PursuitOfConsistencyAs I waiting for a formation on a high probability short swing to form,
Am looking to play a degen long into a short zone and short the market lower between Asian and London session. I won't have the same Idea for NY.
If it trade NY, I will coin a thesis based on the close of London structure.
Otherwise I might wait through Friday or the weekend or whenever for my model to form.
POPCATUSDT 1D#POPCAT is consolidating inside a symmetrical triangle on the daily chart — decision time is approaching. Will it break out upwards or downwards?
We plan to accumulate near the support level at $0.3319, which aligns closely with both the triangle support and the daily SMA50.
If a breakout occurs to the upside, the potential targets are:
🎯 $0.5814
🎯 $0.7088
🎯 $0.8682
🎯 $1.1000
🎯 $1.3317
🎯 $1.6617
🎯 $2.0821
However, if the price breaks below the triangle, it could retest the lower support at $0.2304.
⚠️ As always, use a tight stop-loss and manage your risk accordingly.

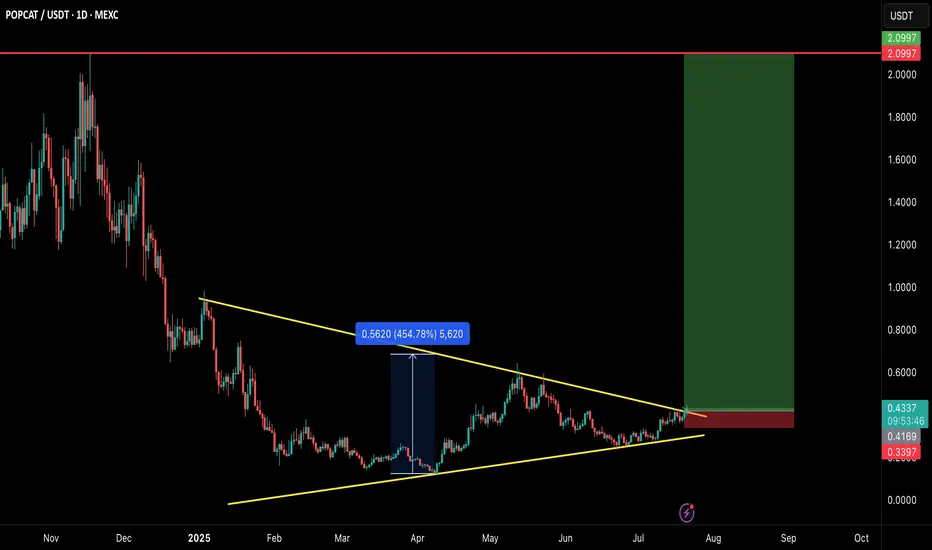
POPCAT/USDT – MEGA BREAKOUT INCOMING!POPCAT is breaking out of a large symmetrical triangle structure that has been developing for several months. This is a textbook bullish reversal setup with explosive potential — and the chart says it all! 👇
🧠 Technical Breakdown:
✅ Clean symmetrical triangle breakout on daily timeframe
🔥 Strong base formation followed by volume breakout
💹 Consolidated above trendline for weeks — breakout looks real
🛒 Entry Zone:
CMP ($0.43) or buy in dips toward $0.40–$0.42
🎯 Targets:
TP1: $0.65
TP2: $1.10
TP3: $1.60
TP4: $2.10
🛑 Stop-loss:
Close below $0.34
📊 Risk/Reward:
Solid RR > 4.0 with high potential if momentum kicks in. Volume and structure both support a strong upside.
📢 Final Thoughts:
This is not just a breakout — it's a multi-month accumulation breakout. If the market stays bullish, POPCAT could go parabolic again just like it did earlier.
🚨 Always use proper risk management and SL!
💬 Drop your thoughts in comments & don’t forget to hit that ❤️ if you find this helpful.
$POPCAT TARGETIt’s been several target hits over the weekend🤩🤩🤩
Someone shout BYBIT:POPCATUSDT.P
Aren't you excited? Well, I am!!!
This trade right here is a whooping 1:4.6RR nearly 1:5RR bringing in so much to the portfolio.
After the correction that happened on Friday, I saw a good opportunity to enter for LONG in many pairs. Yesterday being Sunday despite not being on chart, I was getting notifications of closed trades All in PROFIT, YES!!!
Today seems to give some corrections but I'm overly bullish. we just have to wait for the right entries and boom again.
WILL POPCAT HAVE A NEW WHALE VOLUME?POPCAT seems interesting then never before, even with the last correction, are we going to see a new increase round by POPCAT? The time will show, the interest is here.
If this coin is able to make new confirmations, the updates will be below.

popcat long post trade📓 Trade Follow-Up — July 16 (Entry from Previous Session)
Timeframe:
Trading window is 10:00 p.m. to 12:00 a.m. (Vietnam time).
This session, I was on the charts for less than one hour.
⚙️ Trade Setup:
Trade idea was built during the New York open.
I didn’t execute the trade in real time because I hesitated.
Price moved without me, but I left a limit order at my pre-marked zone and went to sleep.
No chasing, no new setups added after market moved.
📈 Morning Outcome:
Woke up before 5:30 a.m.
The market had returned to the entry, nearly hit the stop loss, then turned.
I was in approximately +1% unrealized profit.
🧠 Morning Decision:
I had no pre-planned rule for what to do if I woke up and the trade was active.
Market was in Sydney session with about 90 minutes left in the trading day.
Tokyo session was approaching (~1 hour and 20 mins away).
I made a quick decision to close the trade:
Reason: setup originated during New York, no longer active session context.
I didn't want to micromanage outside my committed trading window.
During the short moment it took to decide, price pulled back slightly—final profit was just under 1%.
🧩 Notes:
I need to define pre-market and post-market rules:
What to do if a trade is active when I wake up?
Under what conditions do I manage or exit a trade outside my session?
Reaction was clean, no over-involvement or chasing.
Emotionally stable, but acknowledged mild excitement and urgency when waking up to a live position.

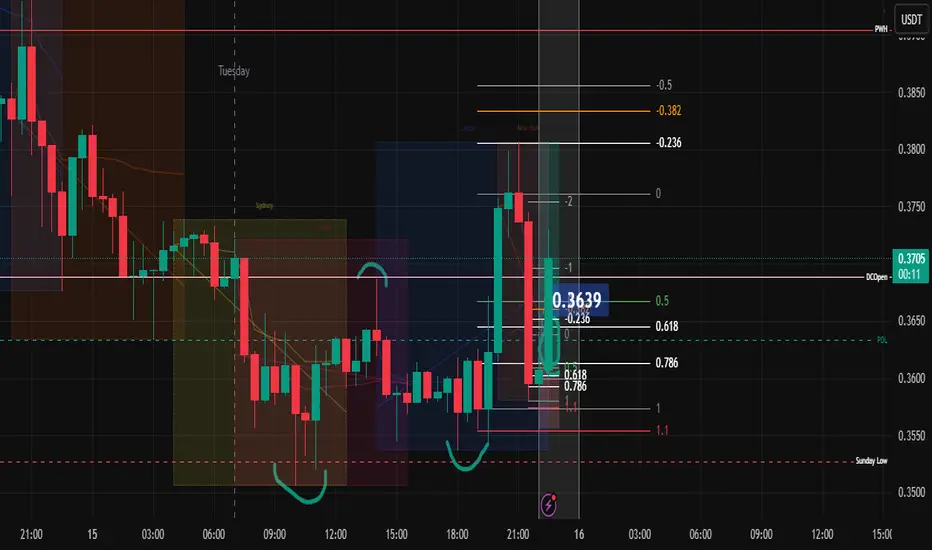
PopCat Long 15-July-2025
🧠 Trade Journal Reflection: July 15
Session: 10 p.m. – midnight (Vietnam time)
Context: Market felt “muddy” on the 1H chart. Needed time to analyze.
🔍 What I Saw:
Market was consolidating below the previous day’s low and today’s open.
Asian session stayed compressed.
London session didn’t break the range meaningfully.
New York session broke out above the day’s open—but then retraced deeply.
On the lower timeframes (45m, 30m, 15m), I identified valid swing highs/lows and noted a retracement that aligned with potential Fibs.
🎯 What I Did:
Measured my Fibonacci retracement levels.
Took time to interpret the situation—was leaning toward longing, but wasn’t fully decisive.
By the time the idea solidified, price had already moved.
I chose not to chase. Instead:
Left a limit order on the LTE (likely your identified entry zone).
Accepted that if price doesn’t come back, it’s okay—I will learn.
💡 What I Felt:
Anxious. A bit unsure. Took time to make the decision.
After placing the limit, I committed to not revenge trading or chasing another asset.
Proud that I chose patience over FOMO.
Acknowledged the lesson: Be quicker next time, but don’t force a trade.
🧭 What I Learned:
I’m becoming more self-aware. That’s rare and powerful.
Not all trades need to be executed to be valuable—this one taught me discipline.
I stayed in alignment with my time window and strategy, even though it felt uncomfortable.
If I’m more decisive and sharper tomorrow, great. If not, I’ll still be here learning.
💤 Final Words to Myself Before Sleep:
“I didn’t chase. I respected my boundaries. I traded with integrity, even if no order was filled. This is the version of me I want to show up with—calm, patient, and always learning. The market will still be here tomorrow.”
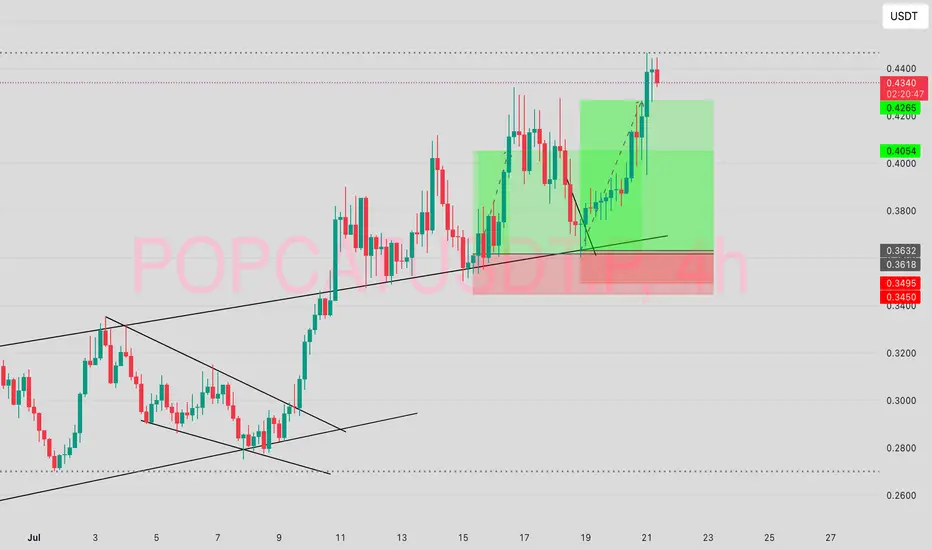
$POPCAT Bull flag breakout done$POPCAT Breaks Out of Bull Flag – Momentum Building
POPCAT has successfully broken out of its bull flag formation after respecting multiple touchpoints along the descending channel. The breakout confirms bullish continuation and flips prior resistance into support.
Key Levels:
Resistance: $0.38
Target Zone: $0.64 and potentially higher if momentum sustains
Structure favors higher highs as long as the retest zone holds. Volume trend supports the move.

$POPCAT - Chance of Seeing $1 in Q3
Haven’t posted much about Solana coins lately, but they’re starting to show signs of life again.
$POPCAT had a clear entry right at the weekly FVG below 33c. From here, it either retests the Monthly Open or begins a slow grind higher.
It performed exceptionally well last year, so there’s a good chance to offload some around the $1 mark if momentum picks up. BYBIT:POPCATUSDT

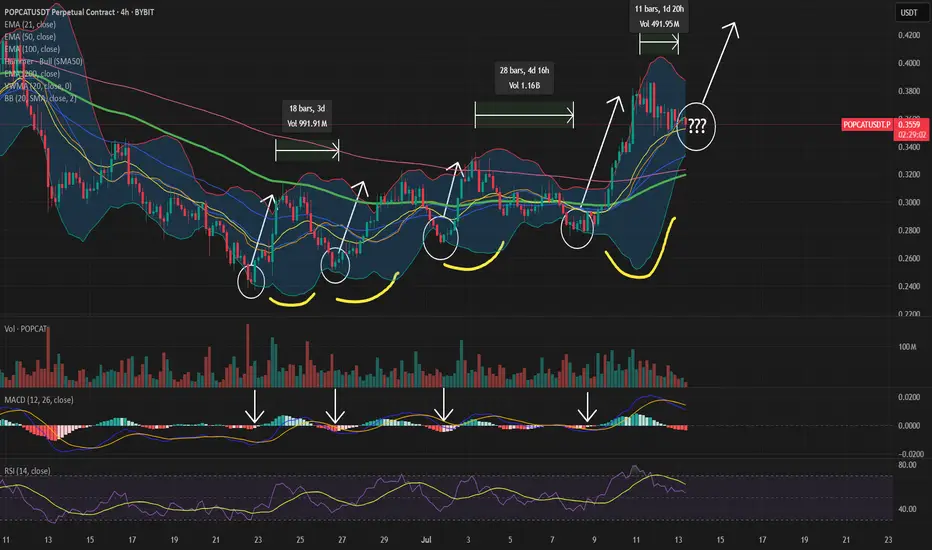
POPCAT - new breakout is coming📈 POPCAT 4H Chart Analysis – Bollinger Bands + MACD
Since 22 June, POPCAT has consistently formed higher highs and higher lows, suggesting growing bullish momentum and a potential breakout in sight.
On the 4H timeframe, POPCAT has followed a recurring pattern:
🔁 Bounce from the bottom of the Bollinger Bands → Rally to the top of the bands
This move has repeated on the following dates:
📅 Date 🔽 Support (Lower Band) 🔼 Resistance (Upper Band) 🔍 MACD Signal
22 June 0.238 0.304 Bullish cross
26 June 0.244 0.310 Momentum up
1 July 0.269 0.312 Bullish signal
7 July 0.277 0.308 MACD rising
Each time, the MACD indicator also showed a bullish crossover or increasing momentum, reinforcing the validity of the rally after the bounce.
🔒 Support has been rising, showing buyers are stepping in at higher levels.
📉 Resistance is tightening around 0.310–0.312, suggesting a potential squeeze.
After each rally, POPCAT has consolidated for a few days, pulled back to the lower band, and repeated the move upward. If this pattern continues, another upside rally could occur within 1–2 days.
TL;DR:
POPCAT is respecting a strong Bollinger Band + MACD setup. If it holds above ~0.277 and breaks past 0.312 with volume, we might see a strong continuation to the upside.
What do you think about this setup?
Drop your thoughts and charts in the comments below! 🔽📊🚀
POPCAT IDEA 29/06/25Any retracement to the 1D FVG could be a nice entry if you are not in yet
Let´s see how it respond to Premium Zone and we could expect go for mayor liquidity

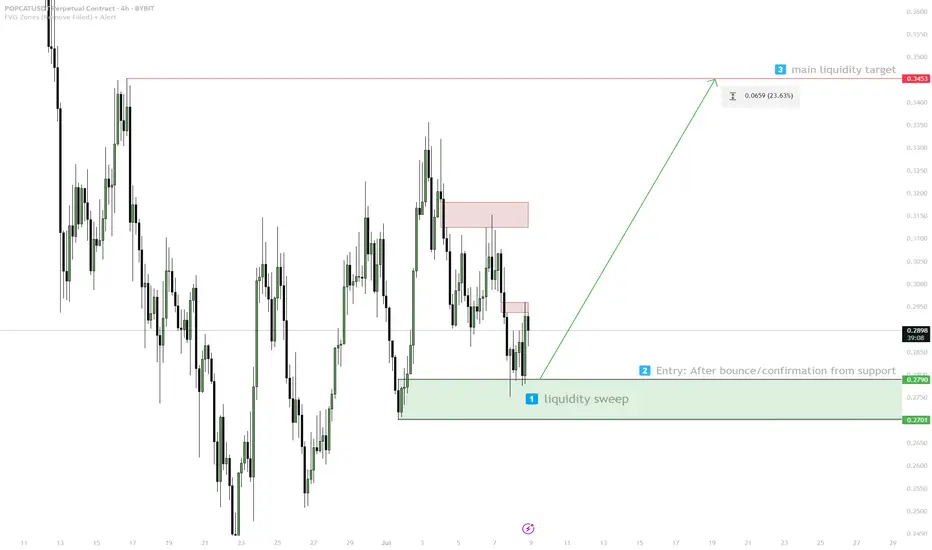
POPCAT — Liquidity Target Play1. Watch for sweep/liquidity grab in 0.270–0.279
2. Enter on confirmed bounce
3. Target: 0.3453 (liquidity zone)
4. Stop: below 0.270 — invalid
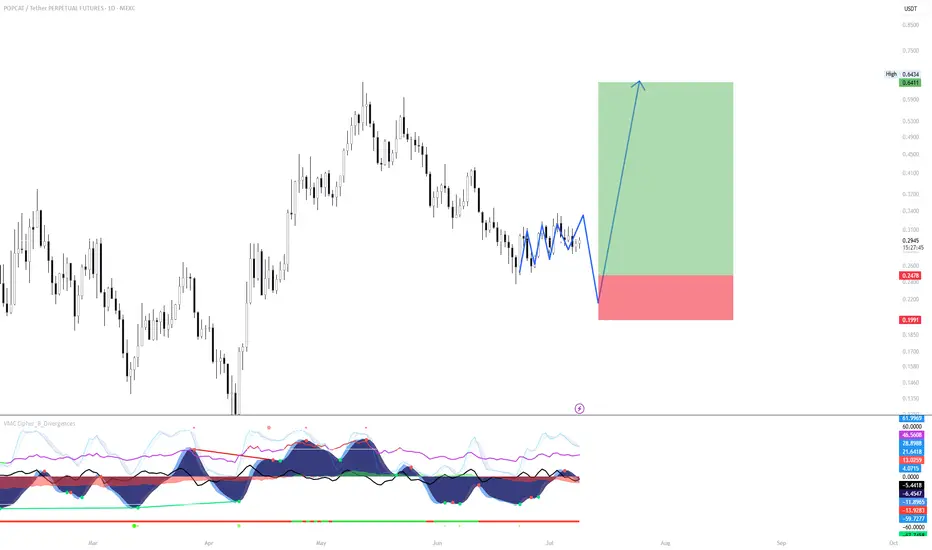
POPCAT/USDT – Tight Range = Engineered Liquidity Grab IncomingPOPCAT is currently consolidating in an unusually tight daily range, with candles compressing into a low-volatility coil. When structure becomes this tight, it often signals that market makers are engineering stop hunts—setting the stage for a larger move.
Thesis:
The current range is likely to break with a local liquidity sweep to the downside, followed by a bullish continuation in alignment with:
The macro HTF trend, which remains bullish
Ongoing Bitcoin dominance, which has a strong influence on meme-cap altcoins like POPCAT
This play anticipates the stop-loss liquidity below the range to be grabbed, triggering momentum to the upside once weak hands are flushed.
Setup Summary:
Price compression = manipulation phase
Looking for a sweep of recent lows (range bottom)
Entry after confirmation of trap / bullish reclaim
Target: $0.64+ range highs
Invalidation: Break and acceptance below the red zone
Key Point:
Tight ranges = traps being set. Be patient, let the sweep happen, and position with trend.
POPCAT SHORT TRADE Popcat (POPCAT) is exhibiting a clear downtrend, with recent increases in sell-off volume suggesting continued bearish momentum. The coin has broken through a key resistance level and is consolidating below it, indicating acceptance of the lower price range. Targeting $0.2039 aligns with a previous support level, making it a logical objective for a short position.

POPCAT/USDT — Major Reversal in Play? Strong Bounce
📌 Quick Summary:
Altcoins are starting to show signs of life, and POPCAT/USDT is now sitting at a critical price structure. After a long and painful downtrend since November 2024, the price is consolidating near a powerful support zone — potentially signaling the start of a reversal phase. Is this the calm before a major breakout? Let’s dive into the technical setup.
🔍 Pattern & Market Structure:
🟨 Descending Triangle Pattern – with Signs of Accumulation:
A clear descending triangle has formed, typically a continuation pattern — but in this context, paired with strong demand at the base, it can signal a reversal.
The horizontal support ($0.27–$0.30) has been tested multiple times, holding firm, which suggests large-scale accumulation by smart money.
A breakout above the descending trendline would invalidate the bearish bias and open the door to a bullish surge.
📐 Descending Trendline (Yellow Line):
This line has been acting as resistance since November 2024.
A clean breakout from this line would serve as a strong bullish signal, likely attracting new buyers and triggering FOMO.
🟩 Bullish Scenario (Reversal Potential):
If the price successfully breaks above the descending trendline and holds above the breakout level, the following targets are in play:
1. 🎯 Target 1: $0.4067 – Minor horizontal resistance
2. 🎯 Target 2: $0.5714 – Previous support turned resistance
3. 🎯 Target 3: $0.8874 – Strong psychological and structural zone
4. 🎯 Target 4: $1.5238 to $1.9510 – Possible macro target if the crypto cycle enters full bullish mode
🧠 Market Psychology Insight: This type of breakout from a long-term downtrend often leads to high-momentum moves, especially if backed by volume. Swing traders and mid-term holders may see this as a golden entry.
🟥 Bearish Scenario (Continuation Risk):
If the price fails to reclaim the descending trendline and breaks below the demand zone:
1. ❌ A breakdown below $0.27 opens room for:
Minor support: $0.20
Long-term low: $0.0869
2. 📉 This would confirm extended bearish control and possibly a deeper retracement phase.
🧭 Strategy Tips for Traders:
✅ Aggressive Approach: Begin accumulating around the $0.27–$0.30 zone with tight stop-losses below $0.26
✅ Conservative Approach: Wait for a confirmed breakout and successful retest before entering toward the next key resistance levels
⚠️ Always combine technical setups with proper risk management and volume confirmation
💬 Final Thoughts:
POPCAT/USDT is at a key decision point. The current support zone shows signs of strength and accumulation by buyers, offering a potential launchpad for a powerful breakout. If the descending triangle breaks to the upside, this could mark the beginning of a trend reversal — with potential gains of 100%+ on the horizon.
The chart is setting up for something big. Are you ready?
#POPCAT #CryptoBreakout #AltcoinReversal #POPCATUSDT #DescendingTriangle #CryptoTrading #ChartAnalysis #BullishSetup #CryptoSignals #BuyTheDip #CryptoTechnicalAnalysis

my new long trade on POPUSDT.Pi have opened this long trade on POPUSDTp,
please share your thoughts.
not financial advice but rather request for thoughts.

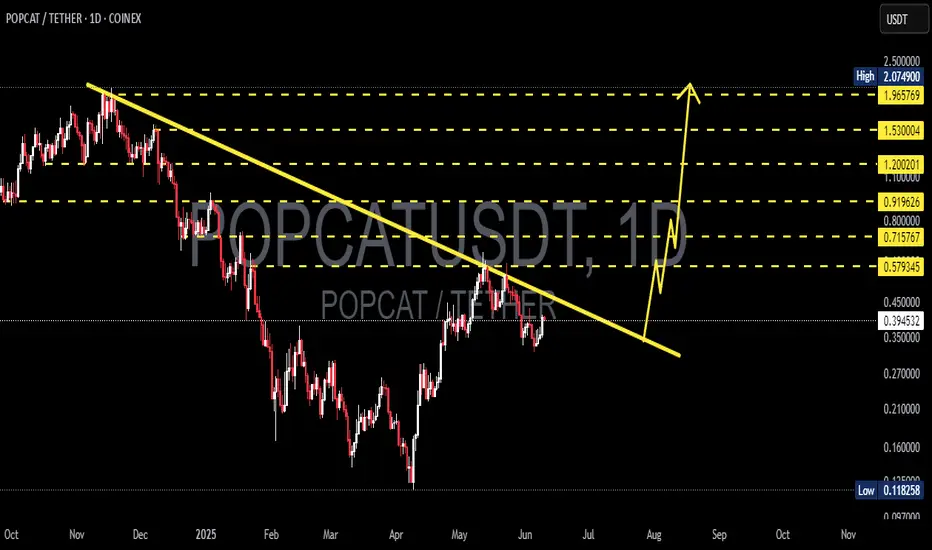
POPCATUSDT 1D AnalysisPOPCAT ~ 1D Analysis
#POPCAT Buy after successfully breaking this resistance line with a short term target of at least 15%+, Long term target $2
"POPCAT - Time to buy again!" (Update)The popcat will increase 7 cents and reach to the top of the wedge in the coming days .
Best regards CobraVanguard.💚

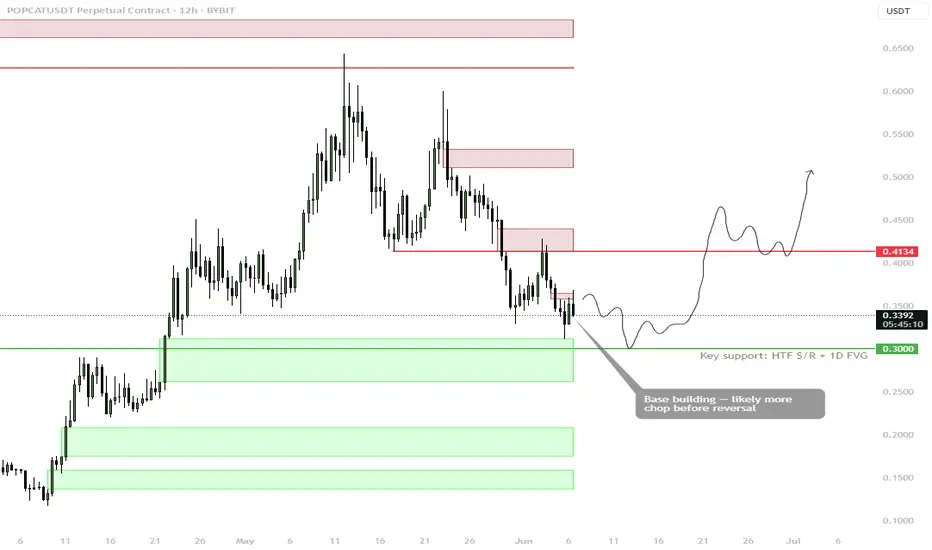
POPCAT — Base Building Near HTF SupportBYBIT:POPCATUSDT is showing early signs of a bottoming process near a key HTF S/R level + 1D FVG zone around $0.30. Price is consolidating just above support, suggesting a base is forming, but more chop is expected before a clean reversal.
🟩 Key Support: $0.30
• Confluence of 1D Fair Value Gap + prior S/R
• Ideal zone to monitor for a long trigger
• No aggressive entries yet — wait for structure
🔁 Likely Scenario:
• Sweep / wick into $0.30
• Higher low forms → reclaim of $0.41 confirms reversal
• First resistance: $0.45–$0.55
• Larger expansion possible on breakout above $0.60
🟥 Invalidation:
• Full breakdown below $0.30 = reevaluate, next support lower at $0.23–0.20
📌 Let the bottom form. The cleaner the base, the stronger the breakout.
POPCAT It will grow soon...The price has formed a Triangle on the 4h time frame, and if it breaks out, it can drive the price up to around $0.65.
Give me some energy !!
✨We spend hours finding potential opportunities and writing useful ideas, we would be happy if you support us.
Best regards CobraVanguard.💚
_ _ _ _ __ _ _ _ _ _ _ _ _ _ _ _ _ _ _ _ _ _ _ _ _ _ _ _ _ _ _ _
✅Thank you, and for more ideas, hit ❤️Like❤️ and 🌟Follow🌟!
⚠️Things can change...
The markets are always changing and even with all these signals, the market changes tend to be strong and fast!!

my next long orderi am making this trade on popcatusdt.p
buy@ 0.432
Stop Loss at 0.4
target 1 at 0.60
target 2 at 0.85
target 3 at 1.00
