$POPCAT - Market Outlook BYBIT:POPCATUSDT | 1d
I'm noticing a potential weakening in dominance, which could pave the way for altcoins to rally toward their nearest inflection points if the trend continues.
For $POPCAT, I project an upward move to the $0.64–$0.76 resistance zone, where a price reaction is anticipated.
If the $0.30–$0.40 range is defended as support or undergoes a bullish retest with confirmation, I expect a breakout above $1 upon a subsequent challenge of this level.
Immediate support: $0.45 to $0.40
POPCATUSDT trade ideas

POPCAT Breakout Alert – Fresh Rally Incoming?🚀 POPCAT Breakout Alert – 60% Potential Incoming?! 👀🔥
Hey Traders! If you're all about high-conviction plays and real alpha, smash that 👍 and tap Follow for more setups that actually deliver! 💹💯
POPCAT has just broken out cleanly from its ascending triangle pattern on the 4H timeframe 🔥. This follows a strong consolidation phase after its last explosive move of 61% gains—and it’s looking primed for a fresh leg up! 📈
Key Levels:
💥 Entry: $0.416 and add more in dip
🎯 Targets:
1️⃣ $0.48
2️⃣ $0.55
3️⃣ $0.61+
🛡 Stop-loss: Below $0.378
Why I Like This Setup:
✅ Clear breakout from a textbook pattern
✅ Strong volume pickup
✅ Previous breakout history shows solid momentum
Keep your eyes on this one 👀—momentum could build fast! Let’s ride the trend 🚀

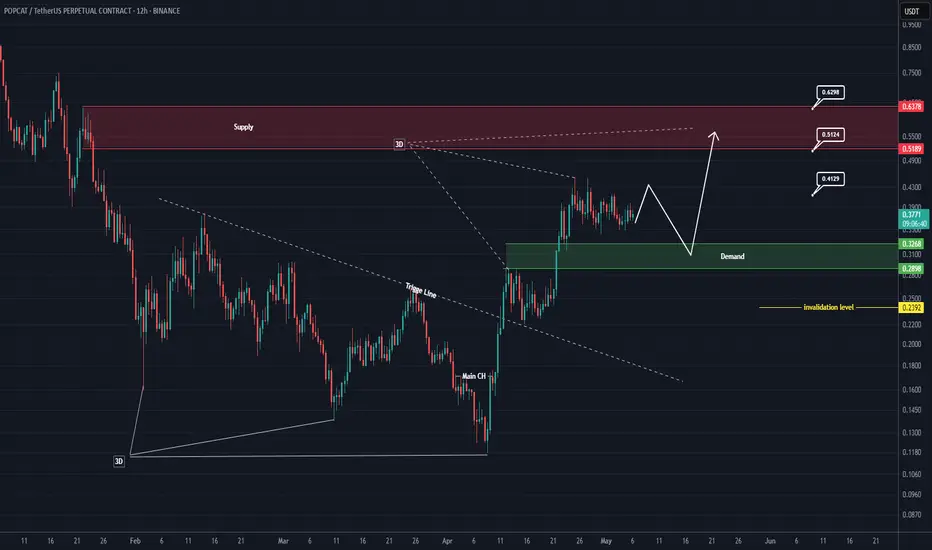
POPCAT Looks Bullish (12H)At the bottom, a 3D pattern can be seen, which indicates that the downtrend had ended.
Now, after a strong break of the trigger line, it seems that the price is aiming to form a bullish 3D pattern.
The green zone is the area from which the price may initiate the third drive.
The targets are marked on the chart.
A daily candle closing below the invalidation level will invalidate this analysis.
For risk management, please don't forget stop loss and capital management
When we reach the first target, save some profit and then change the stop to entry
Comment if you have any questions
Thank You

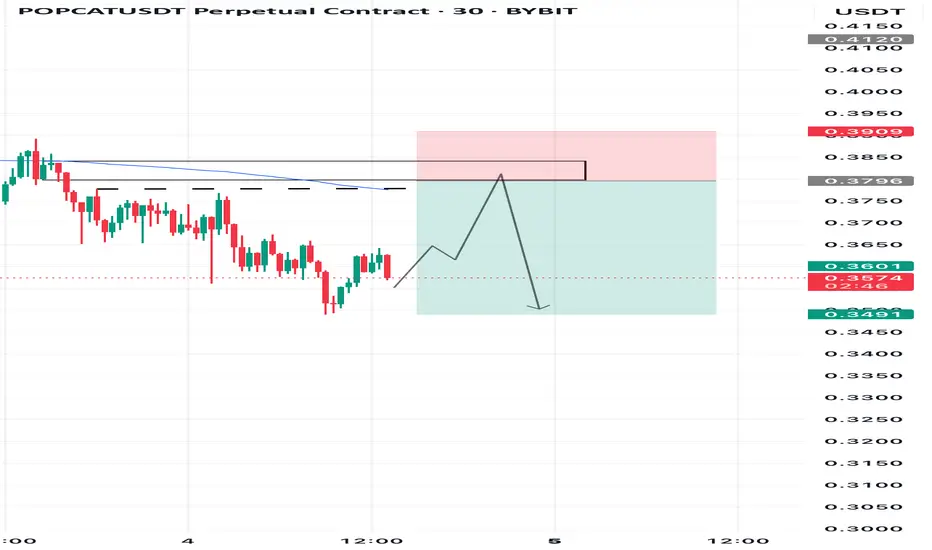
POPCATUSDT – Short Opportunity (30M Chart Analysis)Price is retracing into a key resistance zone ($0.3796–$0.3850), which aligns with the 200 EMA and a former support level. The overall market structure is bearish, and this looks like a classic lower high setup.
Trade Setup:
• Short Zone: $0.3796–$0.3850
• Stop Loss: $0.3909 (Above supply zone)
• Take Profit: $0.3491 (Targeting fresh low/demand area)
• Risk/Reward: ~2:1
Bias: Bearish — looking for rejection and continuation of the downtrend.
Confirmation Needed: Wait for bearish candlestick formation (e.g., bearish engulfing or strong wick rejection) before entry.
This setup fits within a broader context of trend continuation — no trade if the resistance breaks. Manage risk accordingly.
POPCATUSDT MidTerm Price StructurePOPCATUSDT experienced a decisive breakdown from a well-defined rising wedge pattern, a classic bearish reversal structure, leading to an aggressive 50% decline in price action. This drawdown culminated in a test of a key demand zone, characterized by prior accumulation and strong historical buying interest. Since the retest of this demand zone, price has exhibited signs of stabilization and consolidation above the support threshold.
Should this demand zone continue to hold, a bullish corrective phase may unfold, potentially driving price back toward the previous all-time high (ATH). However, the region surrounding the ATH represents a high-probability supply zone, where institutional distribution and profit-taking are likely to re-emerge, leading to a renewed sell-off.
The strategic approach involves initiating accumulation within or near the immediate demand zone while maintaining vigilance around the aforementioned major supply zone. The final projected upside target, derived from prior price structure and Fibonacci-based confluence, is annotated on the accompanying chart for reference.

PopCat is at a critical decision point.PopCat has been riding a strong bullish trend, but now it’s showing signs of hesitation near key resistance. After rallying from the $0.13 region, the asset has posted a series of higher highs and higher lows—textbook signs of bullish market structure. However, the rally is now facing a crucial test around $0.41.
Price is stalling near this resistance level, and early signs of rejection are visible on the lower timeframes. On the 4H chart, this aligns with overhead supply, creating pressure for a potential pullback.
Below current levels, there’s a key zone of interest: a confluence of support including the VWAP SR, the value area high (VAH), and short-term moving averages. If bulls manage to defend this zone and establish another higher low, it could set the stage for another push higher—possibly targeting the $0.71 area, which lines up with a projected bullish extension.
However, if this key support breaks, it would signal the first failure in the current uptrend structure. That would increase the likelihood of a deeper retracement and mark the beginning of a more prolonged consolidation phase.
One important factor that continues to support bullish bias is how the point of control (POC) has consistently acted as a strong demand zone. Buyers have stepped in aggressively from this level before, making it a likely candidate for renewed interest if price retests it.
At this stage, it’s all about reaction. Hold and bounce = bullish continuation. Break and close below support = corrective move likely. Monitor closely.

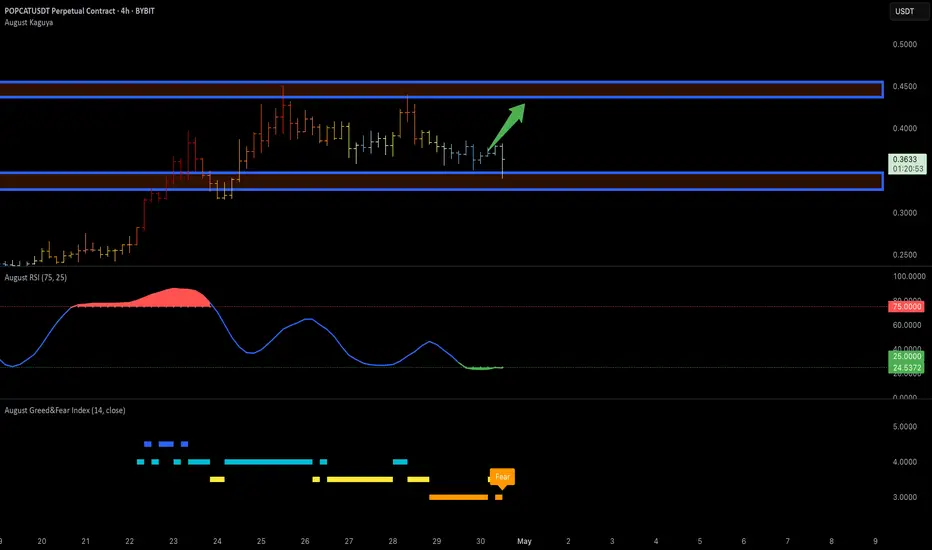
POPCAT is ready to continue Price is climbing back up after a dip and is now heading straight toward the key resistance around $0.45. If it breaks that level, we could see some solid upside.
RSI just bounced from the oversold zone (~23), showing momentum is picking up again.
Greed & Fear Index is sitting in the Fear area — usually a good time for bulls to sneak in.
Candles are shifting from cold to warm, momentum building.
A clean break above that blue zone could open the door for a bigger move.
POPCAT when you look 4h timeframe it is returning from fvg and i expect this fvg should make it new high otherwise it will really strong pull back. but when you look 1h time frame bullish mitigation stronger than bearish. I am expecting to go up. Let see

POPCAT Key Resistance| Price Action| Trend PopCat is at a major support region, and if price holds the higher low and breaks above 40.40 with volume, a rally toward 71.00 becomes highly probable. Still, resistance remains unbroken — caution is key.
Key Highlights:
Key Resistance: 40.40 — two failed breakout attempts so far
Critical Support: 33.33 — must hold to preserve bullish structure
Bullish Confluence: 0.618 Fib, value area high, and volume shelf
Price is compressing within a crucial range, with 33.33 acting as a potential higher low. If bulls manage to reclaim 40.40 with conviction, it opens the door for a breakout targeting the 71.00 resistance — almost a 100% move from current levels. However, failure to break above resistance soon could reduce the probability of a bullish outcome and expose PopCat to deeper pullbacks.

Be careful with POPCAT !!!Currently, POPCAT is forming an ascending triangle, indicating a potential price increase. It is anticipated that the price could rise, aligning with the projected price movement (AB=CD).
However, it is crucial to wait for the triangle to break before taking any action.
Give me some energy !!
✨We spend hours finding potential opportunities and writing useful ideas, we would be happy if you support us.
Best regards CobraVanguard.💚
_ _ _ _ __ _ _ _ _ _ _ _ _ _ _ _ _ _ _ _ _ _ _ _ _ _ _ _ _ _ _ _
✅Thank you, and for more ideas, hit ❤️Like❤️ and 🌟Follow🌟!
⚠️Things can change...
The markets are always changing and even with all these signals, the market changes tend to be strong and fast!!

POPCAT at Breakout Level After Extended ConsolidationPOPCAT is currently testing a major resistance level at $0.39, a price it has failed to reclaim for over 78 days. This marks a critical zone for a potential structural shift.
Key Points:
Price is attempting a breakout after prolonged accumulation below $0.39.
Confirmation will require a clean acceptance and bullish retest of this level
If bulls manage to flip $0.39 into solid support, a fast-paced rally could be triggered, targeting $0.70 and possibly $0.95. However, without acceptance above, this remains resistance.
POPCAT tests a crucial breakout zone after 78 days of consolidation. A confirmed move above $0.39 could trigger a rally toward $0.70 and beyond.

Pop chat chartPop cat chart with key levels.
Price should keep support and climb on top of resistance for the bull run to continue, if it goes under support it will drop to the initial pump point

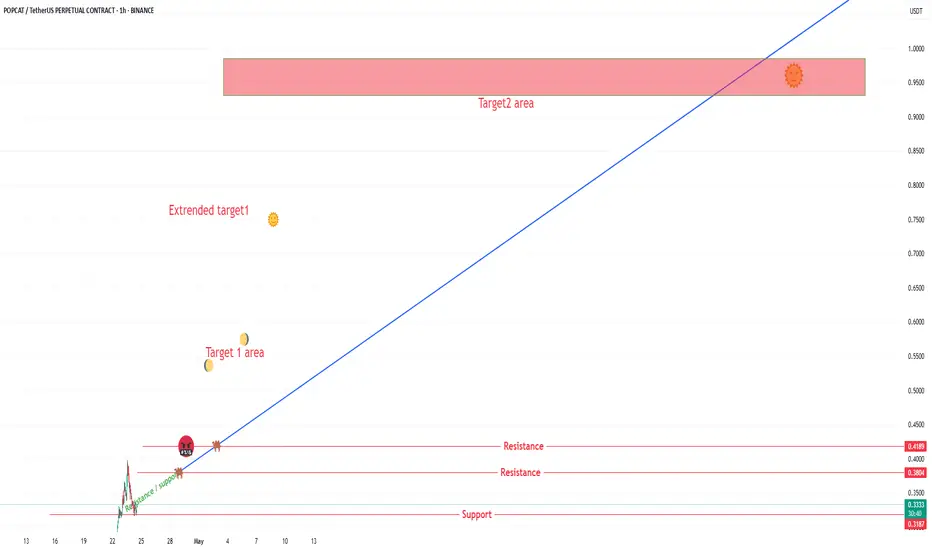
Pop cat chartPop cat chart. Key levels, right now price is at major resistance, and it can turn bullish once on top of it.
Each target can reject to a new low, or push to a new high.
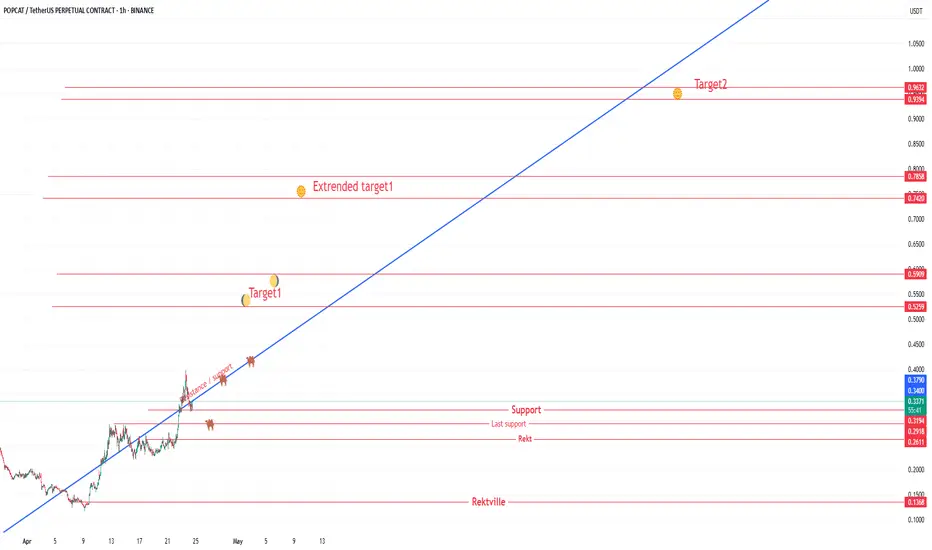
Pop cat chartPop cat chart.
All lines are support / resistance and can reject to new lows or push to new highs.
The little pictograms don`t mean anything, or do they? I guess we will find out.
If support is broken price will drop to the point of the initial pump.
we wait for BTC... we wait BTC to touch trendline again somewhere at 78-80k$ ... so, in that case I think PopCat will fall and then rise wit him

POPCAT SHORTCrypto Introduction
$Popcat is a meme coin on the Solana chain on a recent vertical run — now showing signs of overheating printing lower low/high. Entry at volume area high + 0.382fib + 15m gap.
Stop just above the highs, targeting a retrace to the next support for 2.55R.

...bounce back from 61. fibonacci on 4h chart?...bounce back from 61. fibonacci on 4h chart?
... it looks like nice support,... If BTC bounce back... POPCAT will follow

POPCAT/USDT Analysis – Trend Reversal
The short-term downtrend on this coin has shifted into a strong bullish trend.
During the rally, we broke through the sell zone at $0.182–$0.195 without any significant reaction, forming a mirrored zone as a result.
At this point, entry opportunities could be considered on a pullback to the $0.195–$0.18 zone , or from the lower support area at $0.173–$0.16 .

POPCAT rally stopped. False breakoutPOPCAT is testing the trend resistance.
The counter-trend growth is stopped by the descending resistance. Bears are not ready to give up. A false breakout is formed against 0.2143 and downtrend resistance
Scenario: false breakout of resistance and correction or continuation of the trend.
Consolidation below 0.2143 (or below the downtrend line) will be the entry point.

POPCAT at the verge of Breakout $POPCAT/USDT is forming a falling wedge on the daily chart, a bullish reversal pattern. Price recently bounced from the descending support and is now approaching the minor resistance zone near $0.21.
A breakout above the resistance trendline could signal a trend reversal and trigger upside momentum. RSI at 45.93 is rising, supporting the bullish bias. Confirmation above the wedge is key for further upside.
DYOR, NFA

popcat Outlook after the Dip. What to expect NOW?Finally, the price broke the wedge, and the price experienced a significant drop. I think now is the time for POPCAT to rise again to 0.26 . STRONG SUPPORT 0.382=0.18.
Give me some energy !!
✨We spend hours finding potential opportunities and writing useful ideas, we would be happy if you support us.
Best regards CobraVanguard.💚
_ _ _ _ __ _ _ _ _ _ _ _ _ _ _ _ _ _ _ _ _ _ _ _ _ _ _ _ _ _ _ _
✅Thank you, and for more ideas, hit ❤️Like❤️ and 🌟Follow🌟!
⚠️Things can change...
The markets are always changing and even with all these signals, the market changes tend to be strong and fast!!

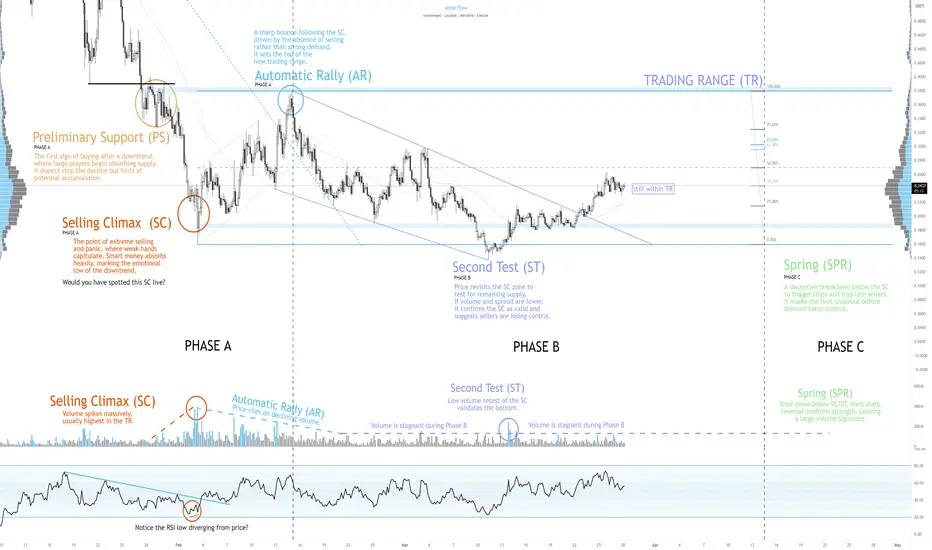
Accumulation, when spring?This is $POPCAT / #POPCAT
I don’t think the bottom is in yet. The volume signature and price action still don’t align with a true Spring. but hey, alts have bottomed like this before.
This doesn’t mean the top of this rally is in either.
If we stall around the 0.5–0.618 fib, I’d expect one more leg down, a proper Spring would be ideal.
But if we rip to the top of the trading range, I’ll be watching the 0.618 retrace measured from the ST low to the Phase B high.
Just something to keep on your radar