POWRBTC trade ideas


POWR (Power Ledger) Wait to get it.POWR is going wave 4. Prepare to wave 5, target sold at 100% of Fibonacci.
Wait to get it.
If you find our post useful, please give us a BIG LIKE Your support will be a great motivation for us to update chart every day! If you have any opinion about this chart, don’t hesitate to comment below! The discussion will make us better! Thank you, guys!


Powr/btc accumulation. Powr/btc is in an accumulation, Perhaps will breakout very soon. Green dotted lines are targets.
Lets see where it goes.
This is not an investment advice.
Happy hodl and trading session! :)

Strong Support power btc must Buy (power btc price analysis)hi friends
as we can see the similar pattern forming in power btc chart its bounce so many time from that 3800-4000 sats support level now we can see that support is attracting buyers and this can be a good entry level
entry lever 4000-40100
take profit 4400 sats
Good Luck


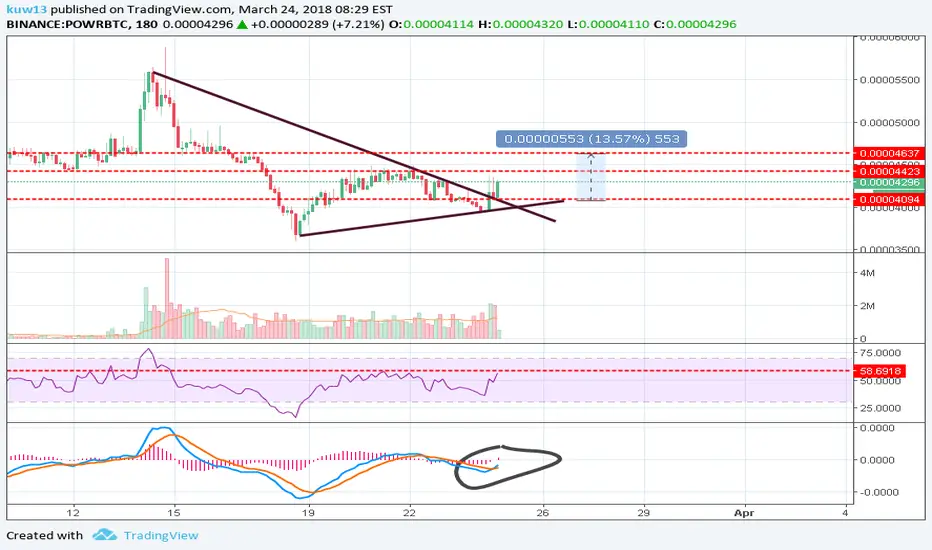
POWR is consolidating and looks like a breakout is nearLooking at trend lines it looks as if POWR should be making a move soon towards the 60k satoshi levels. I have added a buy order at 39k and will wait for this to drop as it has already dropped down to 39.1k so far.
POWRBTCThis should be a bull flag.
In H1 we see impulses that bounced from the bottom
15 mins more, we should at least see this candle hold for confirmation that we are going for an uptrend market


POWR buy breakout or sub ~3.4k
better looking binance coins atm tbh if you dont need the liquidity
fundamentals good too tho if u care about that


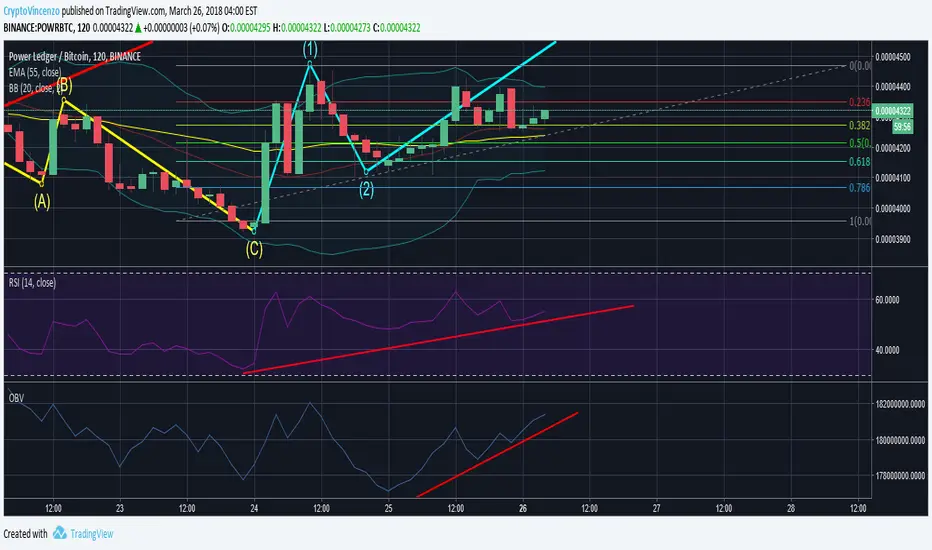
POWR May be Getting Ready to Go!POWR had a pretty big retracement after the first wave. RSI is making higher highs and the OBV is also turning bullish. Bollinger Bands are also squeezing down meaning we should break out soon. I entered around 4200 sats.
POWRBTC seems promising.This is not an investment advice. please do not trade on this idea.
Correction waves spotted on the chart.
TK/KJ cross above the kumo seems bullish.


POWR - 2X POTENTIAL PROFITPowr just broke out of heavy downtrend since February, good potential profit. 2X your portfolio by next month.
*I am not your financial advisory; it's your money so it's your decision.

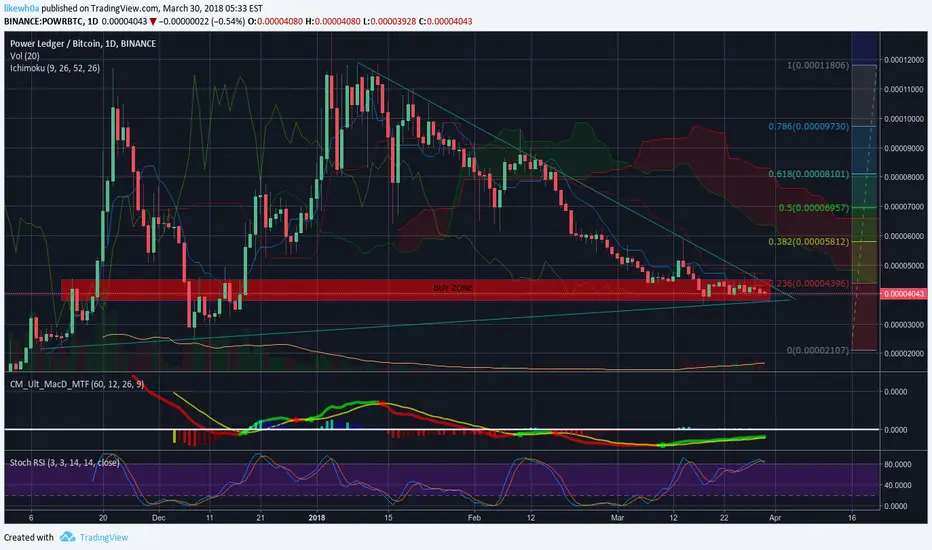
Bullish Gartley PatternI just realized that Bullish Gartley has already been formed for POWR 5 days ago.
It's in good support zone atm and oversold RSI is about to break downtrend line.
If BTC stays calm for a while POWR can reach the targets which i pointed.

POWR/BTC long entryPower is still in a correction. Investors EMA are still in expansion for a bearish trend. RSI also show weakness, no momemtum.
I would start building a long entry between 0.00003900-0.00003500 and place some bids around 0.00003000 hoping to catch some knives.

