ABOTBullish Divergence:
The Relative Strength Index (RSI) at the bottom of the chart shows bullish divergence
This indicates potential upward momentum or trend reversal.
Safe Buying Zone:
The analyst suggests that buying is relatively safer near the lower boundary of the channel, where support has been confirmed.
Target Price (TP 11250):
The expected price movement is shown with an arrow, indicating a potential upward move towards the target price of 1,250 PKR.
ABOT trade ideas

ABOT longCurrently at a very good level.
Broke its all-time high and then came back to retest.
Golden cross about to happen on monthly TF.
Mov Avg 10 is also near, can come back to retest before jumping again but it can / cannot be the case always.
Next targets can be 1690 or 1700. Better to get out at 1650 at a safe side.
Some big candles at daily TF also suggest that player has positioned itself for long flight.

ABOT Technical Analysis: Potential Bullish SetupABOT is showing a solid uptrend, currently holding within the 0.618-0.78 Fibonacci retracement zone—a key support area. It's respecting its trendline, and we're seeing bullish divergence in both volume and RSI, hinting at more buyers stepping in, which is a good sign. Plus, ABOT's fundamentals are strong!
Trading Recommendations:
Buy 1 (CMP): 1038
Buy 2: 1000
Stop-Loss (Closing Basis): 890
Target 1: 1295
Target 2: Open
Happy trading!

ABOT - PSX - Monthly - LONG (BUY) Trade Call On monthly chart Crab harmonic pattern has been drawn. It is evident that in long run this SCRIPT is going to perform.
On Daily TF, price is above EMA 89 line and Klinger is also above zero with RSI indicator close to 70 mark with no divergence. Moreover, the last candle closed without any wick which indicates a GAP up opening on next day or at least bullish trend for the day.
ABOT PSX Buy Call
Entry (Buy) : 899
SL: 751.18
TP1: 1078
TP2: 1675

Bullish Divergence on Weekly as well as Monthly TF.
Bullish on All Time Frames.
669 - 670 is an Important Level to Sustain.
If Sustained this level, we may witness 780 - 815
On the flip side, 557 - 560 is Important Support Zone.

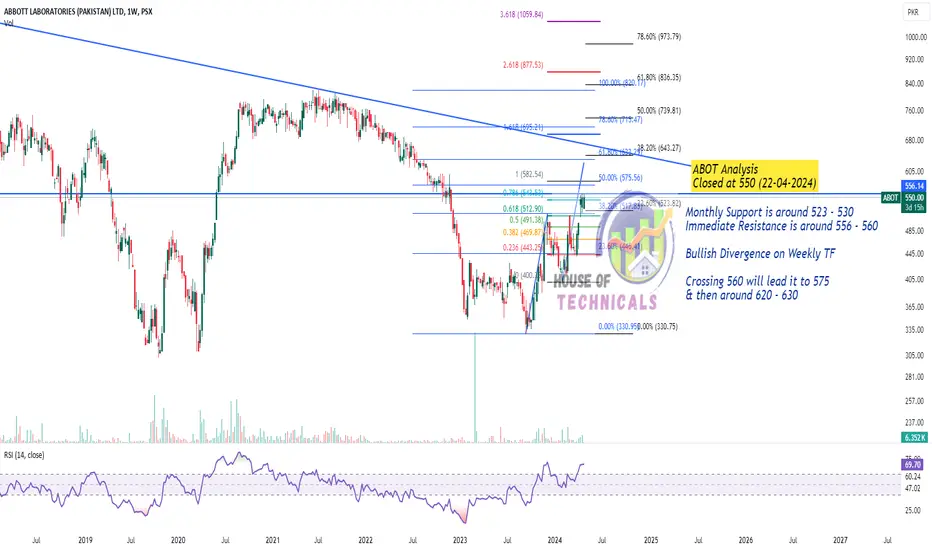
Bullish Divergence on Weekly TFMonthly Support is around 523 - 530
Immediate Resistance is around 556 - 560
Crossing 560 will lead it to 575
& then around 620 - 630