AGTL is at good buying priceAGTL is at a good buying price, a partial entry may be taken today, and remaining on the breakout.
AGTL trade ideas

AGTL monthly ChartAGTL is showing good level for buying in monthly chart. it will gives high returns in coming months.

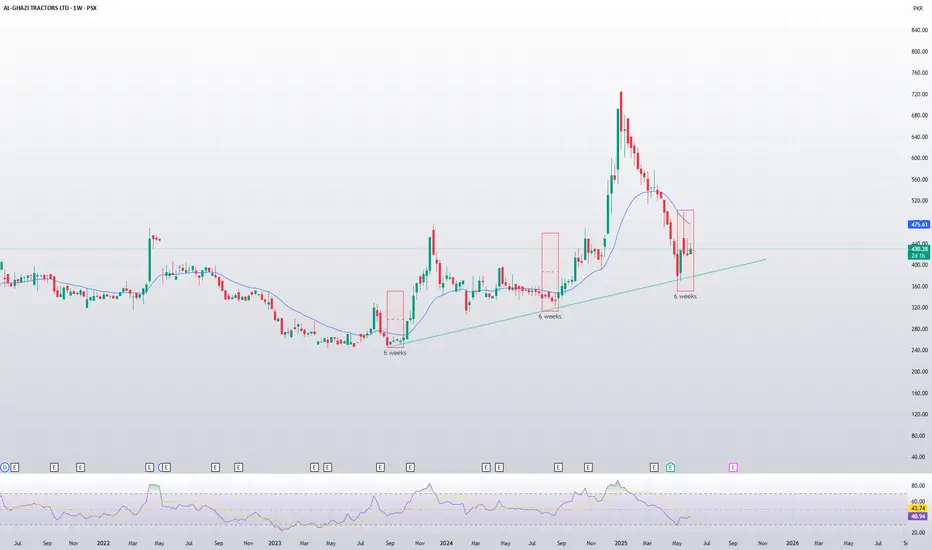
AGTL Weekly Chart Analysis (PSX: AGTL)🟢 Consistent Bullish Reaction from Trendline Support
Trendline Support: Price is respecting a strong ascending trendline that has been tested multiple times since 2023.
Key Observation:
Each time price touches the trendline, it consolidates for exactly 6 weeks.
After this 6-week consolidation, AGTL typically enters a strong bullish rally.
🔁 Repeating 6-Week Pattern
First Zone: October 2023 — 6-week base → breakout rally.
Second Zone: July 2024 — again 6-week accumulation → bullish trend resumes.
Current Zone: May 2025 — AGTL touched the trendline again and has completed another 6-week base.
This is the third time this exact behavior is repeating, indicating a strong fractal pattern and high probability of a new uptrend starting soon.
🔮 Bullish Outlook
If history repeats, AGTL is likely to start rallying soon, potentially leading to a new swing high over the coming weeks/months.
The 6-week cycle provides a time-based edge to anticipate movement rather than reacting late.
📌 Possible Price Projections for Bullish Trend
These are historically grounded targets based on actual previous price movements following similar trendline+consolidation patterns.
If AGTL follows the same 6-week base → rally pattern again:
Short-term target: ~670 PKR (87%)
Extended bull case: ~1030 PKR (188%)
📈 Conclusion
AGTL is showing strong technical consistency:
Each touch of the trendline has led to a 6-week accumulation followed by a bullish breakout.

AGL Trade1 . Bulish trend
2 . break of continution pattern
3 . break of resistance and sustane 4 . no bearish divergence
5 . long trade
6 . TPs hit 38 % increase

Al Gazi (AGTL PSX)-BuyAGTL is making HH and HL. After making recent HH, it retraces to Fib 50% level and formed bullish flag formation. Today it gave breakout of bullish flag formation which shows that bulls are again taking charge from bears. Bullish flag projection will be target price.
Further fundamentally, it is very solid company, one may hold it for longer time frame also

AGTL:- CONSOLIDATION IS ABOUT TO TURN IN TO BULL RUN.Al-Ghazi Tractor has been resting and regaining the strength for last 6 months. Early signals of strength are appearing as the weekly and daily 200 SMA is rendering its support.
To have the confluence it is suggested we may initiate the long position when the price close above 385.
Stop loss and TP has been marked on the chart.
Have a profitable trading.

AGTL is BullishAGTL is looking good, as it has broken previous lower high and bulls seem to be in control of the price action. It is currently trying to break previous higher high and once it does that the price would move to new highs. Targets are mentioned on the chart.
