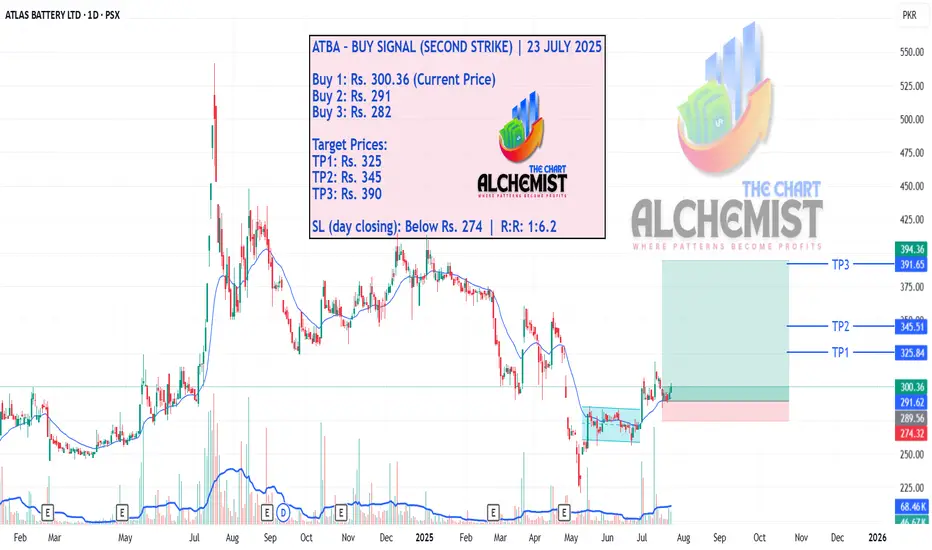
ATBA – BUY SIGNAL (SECOND STRIKE) | 23 JULY 2025 ATBA – BUY SIGNAL (SECOND STRIKE) | 23 JULY 2025
We previously gave a buy call for ATBA stock, which remains valid. However, the current price action has developed a new bullish structure, offering another high-probability opportunity for a second strike. This setup provides favorable entry levels aligned with strong quantified targets.
ATBA trade ideas
ATBA is ready for long term investmentATBA is ready for long-term investment.
After completing its retracement, it has given a strong breakout.
A very high target can be achieved.

ATBA LongATBA is making inverse head and shoulders pattern.
After the war fiasco, it broke the orange trendline and is currently struggling to close above it on monthly chart. A monthly closing above 270 would be a very good sign.
Once it closes above it, next resistances will be 283, 333 and 383 before eventually moving towards its all time high (500-530)

ATBA is going to 500 againATBA is maintaining
support of 386 and
its next resistance
is 423, after breaking
423 it could cross
468 and 540 again
Note: This is not a
buy/sell call
Use stop loss

Hidden Bullish Divergence on Daily TF.
350 - 351 is an Important Resistance for now.
If this level is Crosses & Sustained, we may
witness 371-373 then 395.
On the flip side, 318 - 320 & then 292- 293
are very important Support Levels that should
be respected.

ATBA: Bias longAll details given on the chart. I have used monthly chart to come up with the long term targets. Further. Rs 450 is based on the fact that there is a gap that needs to be filled.

ATBA Hourly AnalysisScrip has taken a good correction of more than 50.00% and penetrated the Golden Zone. Formation of a Green Candle hopefully signals a move towards the upside and relevant Price levels / zones marked.
But as markets aren't predictable 100% and can move in any directions, therefore we should also be prepared for the unforeseen movement and define levels towards the downside as well. Approximate Levels have also been marked towards the downside; in case the scrip move down.

ATBA plunge & possible downside TargetsIf Scrip continues its downward movement, then it may come down to fill in the GAP highlighted in GREEN as it has already filled in the first GAP also nullified / also mitigated the first FVG as well.
Its next GAP filling is due at the level 425-412 approx. and Next CAP price Level is calculated @ 410.22, both are more or less at the same price levels.
If it still goes down then before confronting the next GAP filling it has to cross the Equilibrium zone (which is halfway between the Premium & Discount zones or 0.500 Fib level), which stand about at 400-389 Price level. After that GAP filling area is 389-376 approx.
The second unmitigated FVG on Daily TF is between 389-350 approx., and the above-mentioned GAP is part of this second FVG, and this can be another price zone that can be mitigated towards the downside.
Worthwhile to mention here is the fact that the Scrip may bounce to the upside depending on the Market Demand & Supply forces BUT the most probable area of reversal can be the FVG i.e. 389-350 price level.
IF THIS SOUNDS A BIT CONFUSING THEN GO THROUGH THE BELOW APPROXIMATE PRICE LEVELS AS PER SMC IN CASE SCRIP MOVES TOWARDS THE DOWNSIDE: -
▶ 425-412 Gap Filling zone
▶ 400-386 Equilibrium zone
▶ 389-376 Gap Filling zone
▶ 389-350 i.e. complete FVG price level zone / area - Gap Filling zone = 389-376

ATBAATBA is in bullish momentum, break out is observed on a weekly time frame, support and resistance levels are mentioned on the chart.

ATLAS BATTERYBullish on atlas batteries
Breaking the all time high
As electric vehicles companies are bullish and for electric vehicle and solar demand increase, batteries demand is rising.

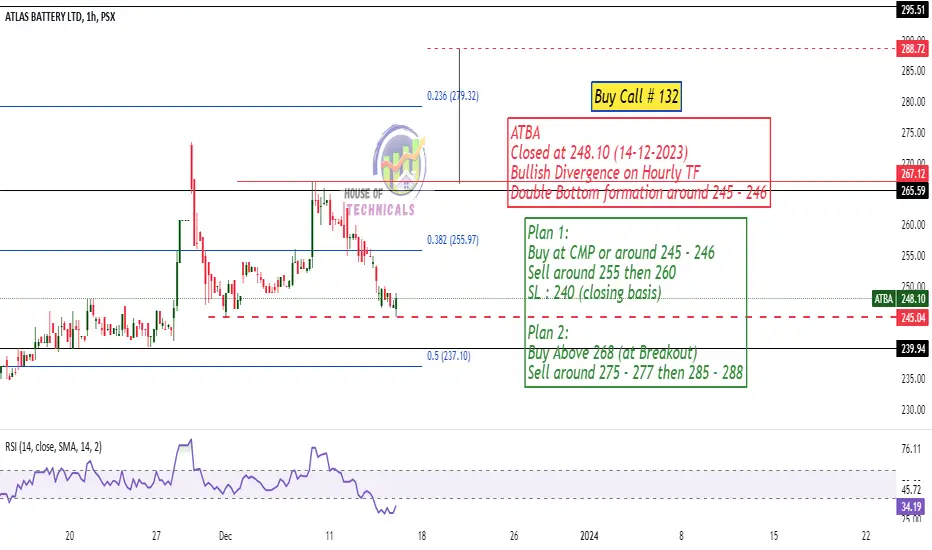
ATBAPlan 1:
Buy at CMP or around 245 - 246
Sell around 255 then 260
SL : 240 (closing basis)
Plan 2:
Buy Above 268 (at Breakout)
Sell around 275 - 277 then 285 - 288